Market Waves: 7.23 Bitcoin (BTC) Market Analysis Reference:
The current price of Bitcoin is 65600, and the daily chart overall maintains a high-level oscillation pattern. The price is continuously operating based on the middle band of Bollinger Bands, with short to medium-term moving averages providing upward support. The MACD remains in the bullish zone, but the volume bars are gradually shrinking, and the upward momentum has slowed down. The KDJ and RSI indicators are at a neutral to high level, indicating insufficient upward motivation in the short term. It is highly probable that the market will continue to oscillate and digest the increase, and there is a certain space for a pullback. Focus on the support at 64200 below and resistances at the previous highs above.
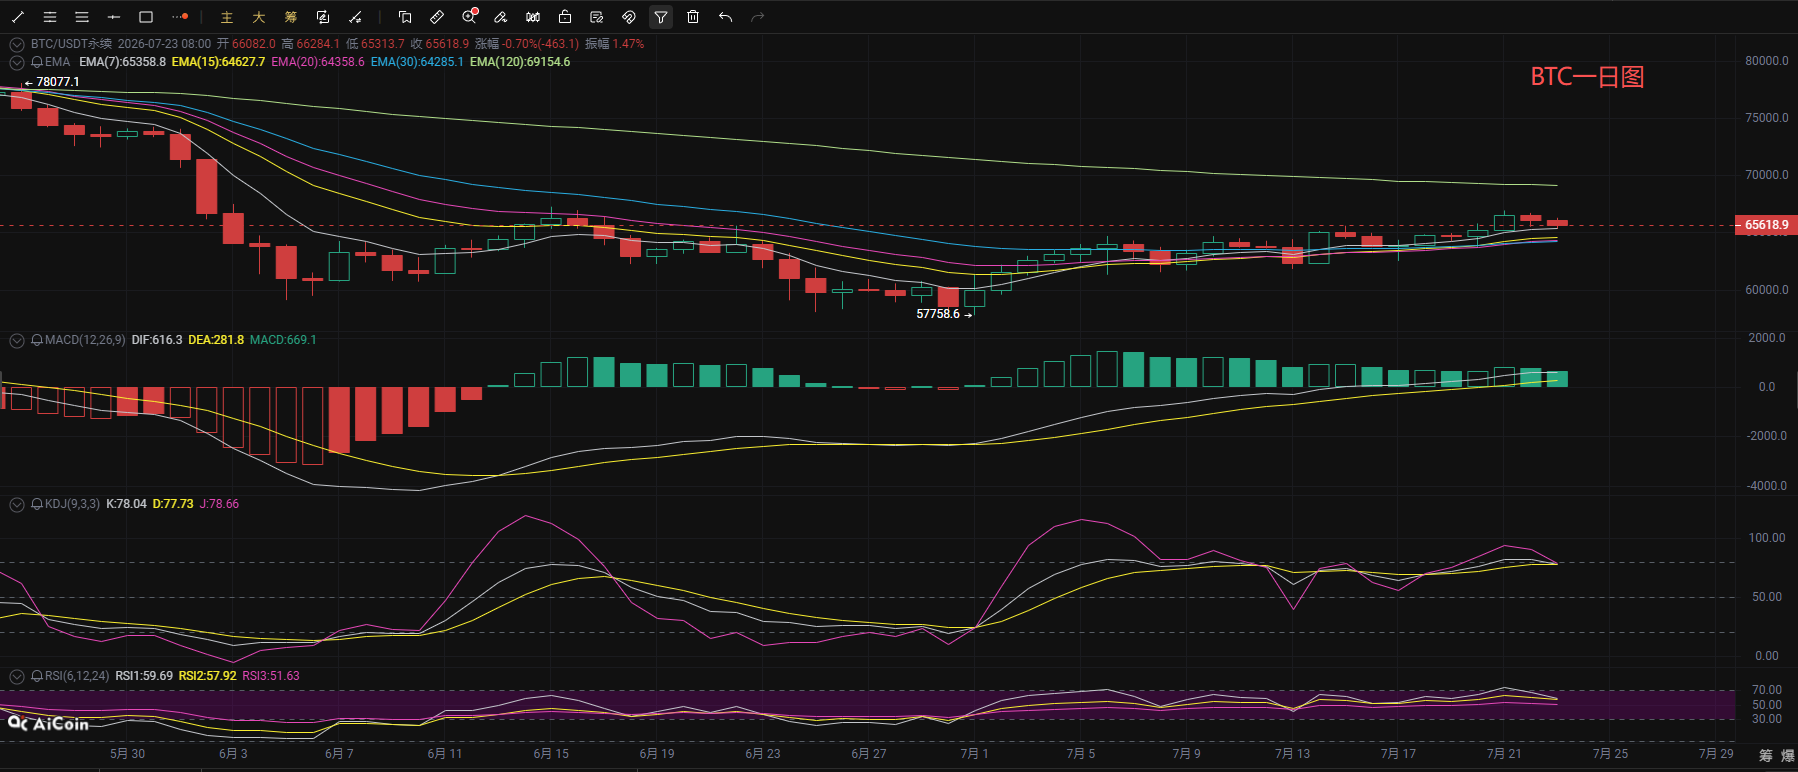
In the short-term 4-hour level, there has been a pullback from the high point of 66924. The price is competing around the middle band of Bollinger Bands. The MACD has formed a death cross and entered a bearish area, while the KDJ is running downwards into a low area, and the short-term bearish force has been released. Currently, the market is in a phase of oscillation consolidation. If the support at the middle band of Bollinger Bands holds, it is expected to retest the previous high. However, once the support area is effectively broken, there will be a further down adjustment in the short term. At this stage, it is not suitable to chase blindly; wait for a pullback to consolidate support before entering long positions.
Market Waves: 7.23 Bitcoin Short-Term Reference:
Long Position: Buy between 64000-64600, stop loss 500 points, target 65500-66500,
Short Position: Sell between 66900-66300, stop loss 500 points, target 65500-64500,
Market Waves: 7.23 Ethereum (ETH) Market Analysis Reference:
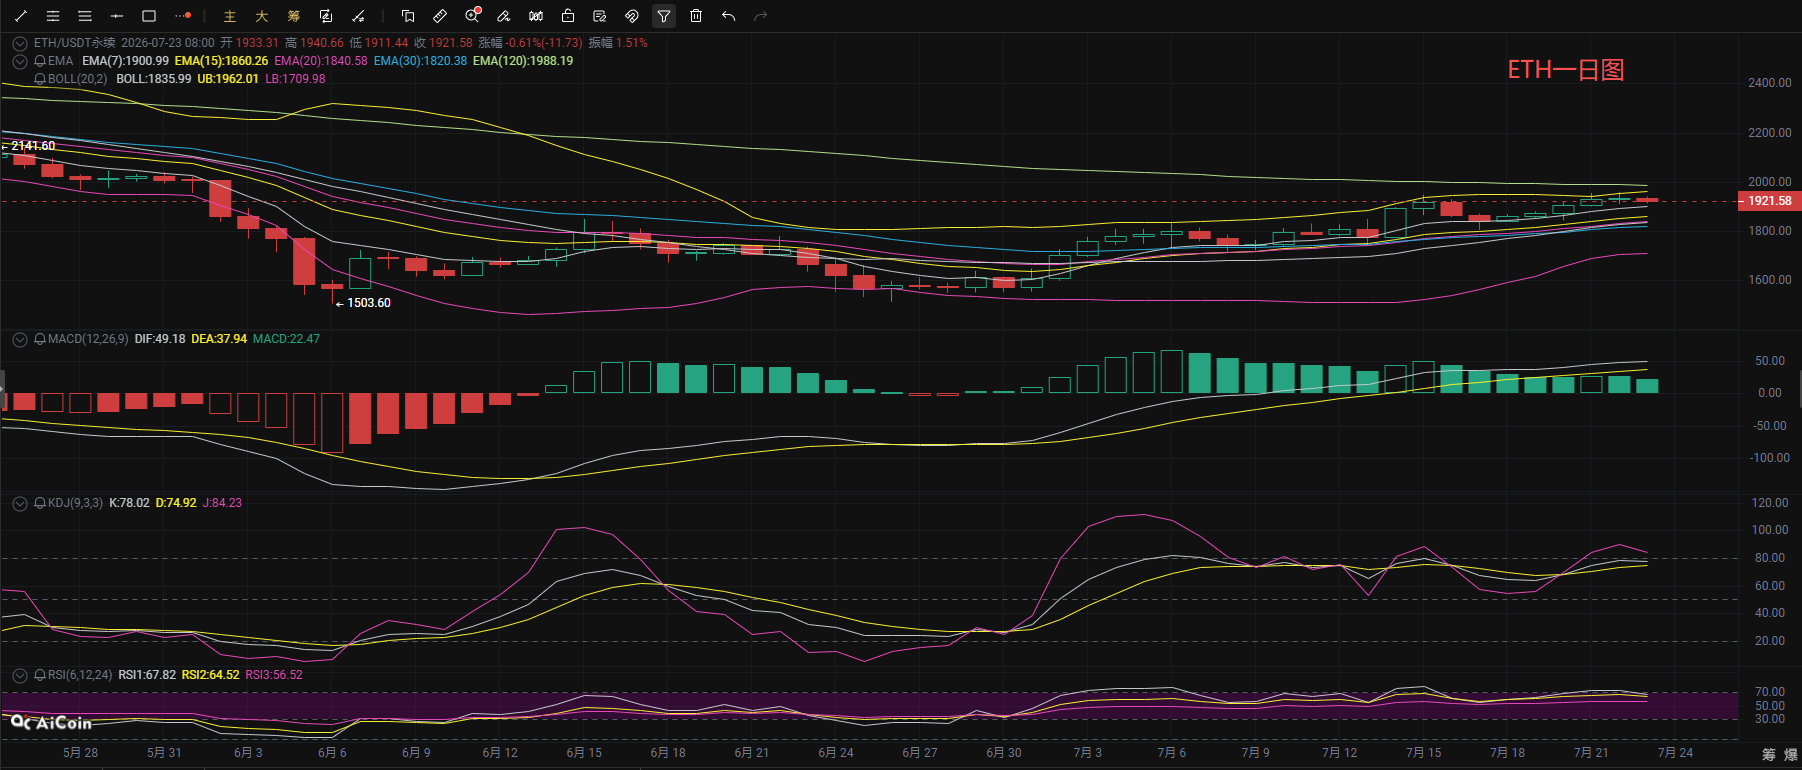
Ethereum's daily chart shows a gradually upward step-like pattern, with the price steadily rising based on short to medium-term moving averages, and the overall bullish structure remains intact. Although the MACD is still in the bullish area, the bullish momentum has weakened, compounded by several oscillation indicators being at high levels, making it difficult for the price to sustain direct upward movement in the short term. It is likely to digest the selling pressure above through horizontal oscillation, with key support at 1840 below. After reaching the high point of 1958, the 4-hour level's upward rhythm has slowed down, entering a high consolidation phase. The MACD has formed a death cross, and short-term bearish forces are beginning to show, although the price has temporarily stabilized at the lower band of Bollinger Bands at 1881. If the support holds, the market will continue to maintain a range oscillation for consolidation; however, if this position is lost, a deep pullback will be welcomed in the short term.
Market Waves: 7.23 Ethereum Short-Term Reference:
Short Position: Sell between 1980-1950, stop loss 30 points, target 1930-1880,
Long Position: Buy between 1840-1880, stop loss 30 points, target 1900-1950,
Daily updates on real-time trading strategies, providing free analysis for position management and market operational knowledge. Scan the QR code to follow the public account for one-click access to connection methods!

The above analysis and strategies are for reference only, and risks are borne by the reader. The article review and publication may have delays; strategies may lack timeliness; do not operate blindly.
免责声明:本文章仅代表作者个人观点,不代表本平台的立场和观点。本文章仅供信息分享,不构成对任何人的任何投资建议。用户与作者之间的任何争议,与本平台无关。如网页中刊载的文章或图片涉及侵权,请提供相关的权利证明和身份证明发送邮件到support@aicoin.com,本平台相关工作人员将会进行核查。


