Academic in the cryptocurrency circle: Comprehensive interpretation of the 7.24 Bitcoin (BTC) moving average indicators, revealing the current real strength and weakness? Latest market analysis and operational advice breakdown
Currently, Bitcoin is at 64,700, positioned in a critical zone of market competition, with no clear one-sided trend or breakout signal. Many people always think about determining the outcome in one go, yet overlook the survival rules in a volatile market: do not chase highs, do not bottom fish, and make light trades at key positions for trial and error, while keeping stop losses in place. The market is always right, and what is wrong is our subjective judgment. Respect the trend and fear the market to go further in the cryptocurrency circle.
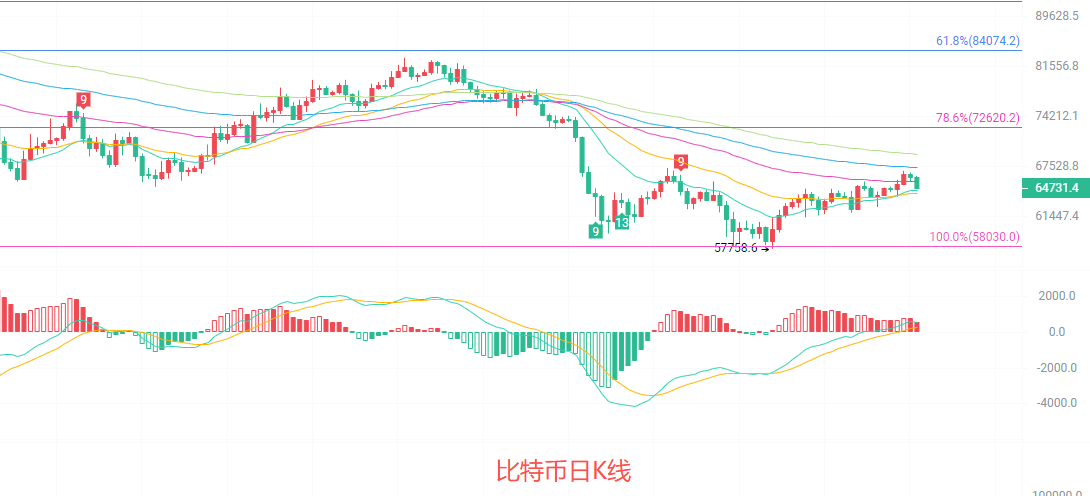
The daily candlestick chart is currently in a critical recovery stage. The price is above EMA15, but under pressure from EMA30 and EMA60, and the medium to long-term moving averages are still in a bearish arrangement, with obvious resistance above. In the MACD indicator, DIF and DEA maintain a golden cross, and the red histogram is expanding, indicating a short-term bullish momentum has somewhat warmed up, but has not yet formed a trend reversal. The middle line of the Bollinger Bands is flat, with the price oscillating near this middle line, generally still in a weak recovery channel after a decline, and it's hard to speak of a reversal before effectively breaking through the key resistance level.
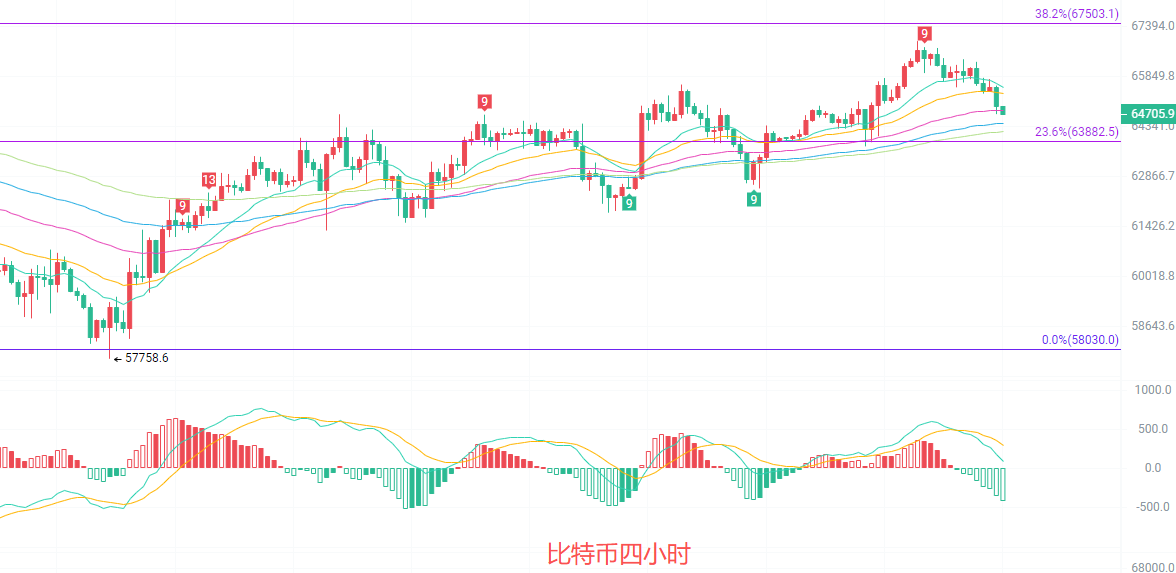
The four-hour candlestick chart is testing the combined support of EMA15 and EMA30, with the current price still above EMA15, but has already broken below the Bollinger Bands' middle line at 65,785, indicating a weak short-term trend. The MACD indicator shows that DIF has crossed below DEA, forming a death cross, with green bars starting to expand, indicating that short-term bearish momentum is being released. The opening of the Bollinger Bands has narrowed somewhat, with the price retesting the lower band near 64,747. If this support can hold, a secondary rebound is expected; if broken, it is likely to test the Fibonacci 23.6% support at 63,882, and the short-term weak oscillation pattern has not yet been broken.
Short-term reference:
If it does not break below 64,800 to 64,300, target north, stop loss at 63,900, aim at 65,500 to 66,500
If it does not break above 67,000 to 67,500, target south, stop loss at 68,000, aim at 65,500 to 64,500
Specific operations should primarily rely on real-time market data for more detailed information; you can consult the author. The release of the article is delayed, and suggestions are for reference only, with risks borne by yourself.

Kind reminder: The above content is exclusively created by the author on the public account; advertisements at the end of the article and in the comment area are not related to the author. Please identify carefully; thank you for reading.
免责声明:本文章仅代表作者个人观点,不代表本平台的立场和观点。本文章仅供信息分享,不构成对任何人的任何投资建议。用户与作者之间的任何争议,与本平台无关。如网页中刊载的文章或图片涉及侵权,请提供相关的权利证明和身份证明发送邮件到support@aicoin.com,本平台相关工作人员将会进行核查。


