Academician of the Coin Circle: 7.24 Ethereum (ETH) four-hour cycle signal warning, is a new round of market about to start? Latest market analysis reference
The current price of Ethereum is 1888, a typical oscillating washout market. Don't fantasize about 2000 when it rises, and don't fear 1700 when it falls. The emotions follow the K-line, and you will inevitably be harvested back and forth. In fact, in trading, what matters in the end is not how accurate the prediction is, but how disciplined you are. Don't hold too much position, always have a stop-loss; this is not being timid, but is the bottom line for protecting the principal. Opportunities are available every day, there's no need to rush for the moment, keep your hands steady and be patient, wait for clear signals from the market before taking action, moving slowly is actually more stable.
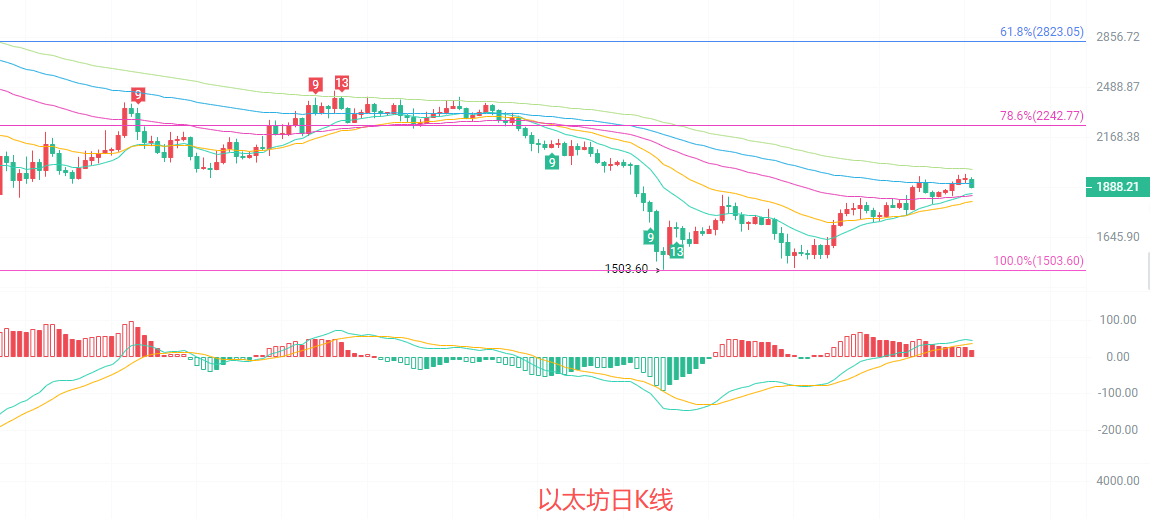
The daily K-line yesterday closed with a long upper shadow bearish candle, down 2.41%, closing below the EMA15 moving average of 1855, but still above the EMA30 and the middle track of the Bollinger Bands. The short-term moving averages have begun to flatten after a bullish arrangement, and the upward momentum has weakened. The MACD red bars continue to shorten, with DIF and DEA forming a death cross at a high level, indicating that there is a corrective pressure at the daily level. The key resistance above is in the 1940-1980 range, corresponding to the previous oscillation platform and the pressure of EMA90, while the support below is in the 1820-1780 range, which is the resonance point of the Bollinger Bands lower track and the previous oscillation lows. Once it breaks below, it is highly probable that it will retest the 1700 level.
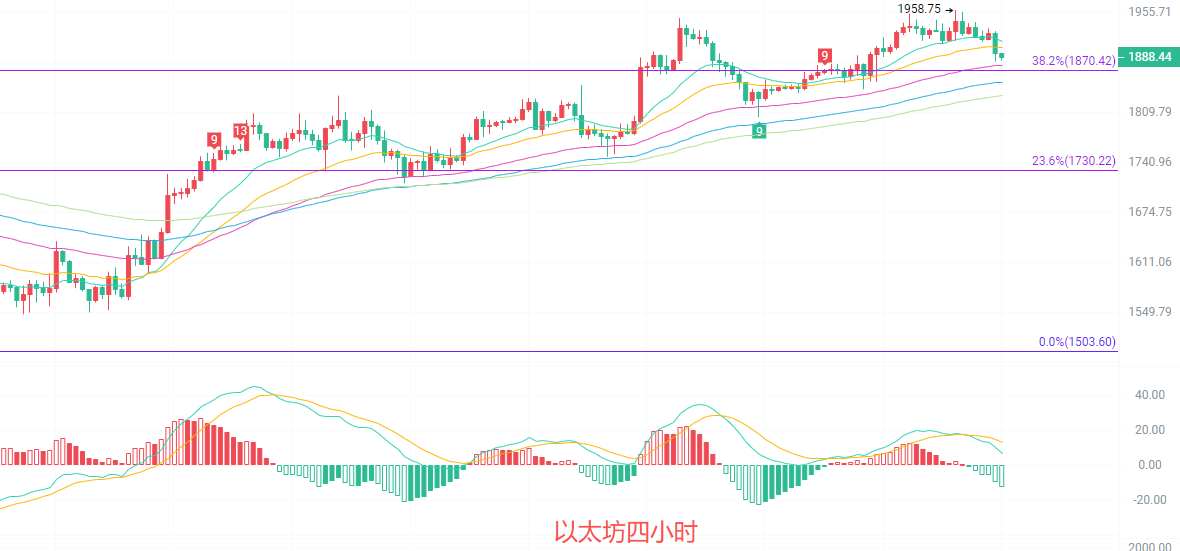
The four-hour K-line is currently in a rebound channel since the low point of 1510, with prices under pressure below the EMA15. The short-term moving averages are turning downwards, forming a weak oscillation pattern. The Bollinger Bands opening is starting to narrow, and the range between the upper track at 1948 and the lower track at 1889 is continuously compressing, indicating that a turning window is approaching. The MACD continues to weaken after forming a death cross above the zero axis, with green bars moderately expanding, indicating that short-term bearish strength is dominant. The key resistance above is in the 1900-1930 range, corresponding to Fibonacci 38.2% and 50% pressure levels, while the support below is in the 1870-1850 range. If it breaks below, it may retest the 1800 level.
Short-term reference:
If it does not break below 1850 to 1800, go long with a stop loss at 1760, targeting 1930 to 1970.
If it does not break above 1980 to 2020, go short with a stop loss at 2050, targeting 1930 to 1890.
The specific operations should be mainly based on real-time data from the market. For more detailed information, you can consult the author. The publication of the article has a delay, and it is suggested for reference only; risks are borne by oneself.

Kind reminder: The above content is created only by the author's public account. The advertisements at the end of the article and in the comment area are unrelated to the author. Please differentiate carefully, thank you for reading.
免责声明:本文章仅代表作者个人观点,不代表本平台的立场和观点。本文章仅供信息分享,不构成对任何人的任何投资建议。用户与作者之间的任何争议,与本平台无关。如网页中刊载的文章或图片涉及侵权,请提供相关的权利证明和身份证明发送邮件到support@aicoin.com,本平台相关工作人员将会进行核查。


