Original author: Bao Yilong
Original source: Wall Street Journal
Under the intertwining impacts of geopolitics, climate, and technological shocks, Citigroup believes that the "black swan" in the commodity market is evolving from a once-in-a-decade event to nearly a norm.
On July 23, Citi Research's Eric G Lee team released a report, outlining potential extreme risk scenarios for the second half of 2026 and beyond, the magnitude of their price impacts is enough to invalidate traditional supply and demand analysis frameworks.
The tail risk scenarios covered by Citi Research include: the US-Iran conflict evolving from a temporary shock to a multi-year persistent disruption, key mineral stockpiling competition, gold potentially dropping 15% to 20% before doubling, extreme El Niño weather impacting agricultural products, and AI bubbles bursting or continuing prosperity causing bi-directional volatility, among others.
Since 2020, the commodity market has endured the COVID-19 pandemic, the Russia-Ukraine conflict, trade wars, central banks buying gold, and recurrent conflicts in the Middle East, with an unprecedented density of extreme events occurring.
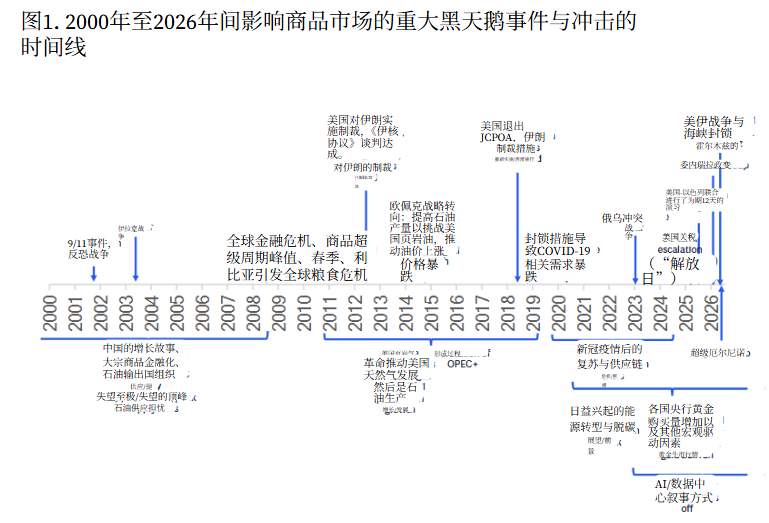
The report points out that these risk scenarios are not fundamental predictions but "are possible and would have a substantial impact if they occur" tail scenarios, aimed at supplementing Citi's existing benchmark scenario prediction framework.
Highest risk: US-Iran conflict evolving into a multi-year supply crisis
Citi ranks the escalation of the US-Iran conflict as the most impactful tail scenario, even though the probability of occurrence is assessed as "low."
The report indicates that since the "12-day war" of the US-Israel joint strike on Iran's nuclear facilities in June 2025, to the resumption of conflict in February 2026, the signing of a fragile ceasefire agreement in June, and the military escalation in July 2026, oil and refined oil prices have undergone multiple rounds of severe fluctuations.
If the conflict expands further, Iran may target the energy infrastructure of oil-producing countries in the Gulf region, compounded by the prolonged closure of the Strait of Hormuz and disruption in the Mandeb Strait, potentially leading to a continuous global supply gap of 5 to 10 million barrels per day.
Citi estimates that under the assumption of a demand elasticity of about -0.05, such a scale of supply loss could drive oil prices up by 100% to 200%, meaning full-price crude oil could exceed $200 per barrel and US retail gasoline prices could consistently maintain above $6 per gallon.
Historical data cited in the report shows that if global oil inventories outside of China fall below the level covering 70 days of consumption, the corresponding Brent actual oil price once exceeded $150 per barrel.
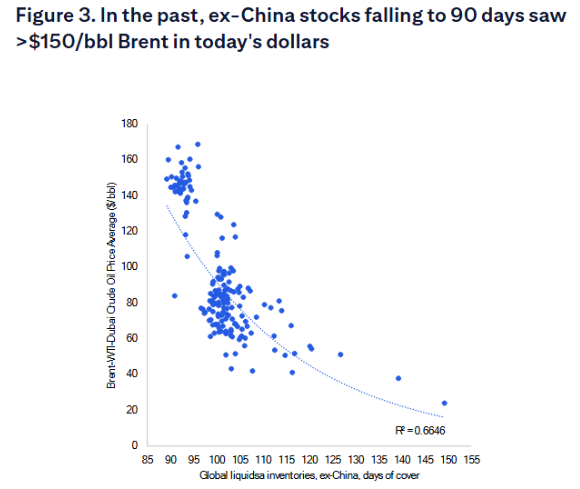 (Historically, when crude oil inventories outside of China dropped to a 90-day low, Brent oil also exceeded $150 per barrel)
If oil and gas expenditure as a percentage of GDP revisits the peak of 8% seen during the second oil crisis of the 1970s, the necessary oil price level would exceed $200 per barrel.
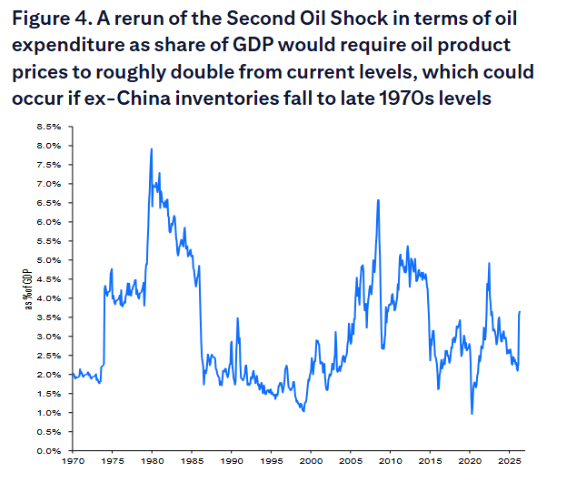 (If inventory levels outside of China drop to those seen in the late 1970s, oil product prices may roughly double from current levels)
As of July 2026, total global oil inventories outside of China remain around 94 days of consumption, but Citi predicts that if the global deficit of 7 to 8 million barrels per day continues, this indicator may fall below 70 days by early 2027.
Russia-Ukraine escalation: Gas market impact expected to exceed oil
Citi rates the possibility of stricter limitations on Russian energy exports as "moderate probability" and emphasizes that the impact on the gas market will be greater than that on oil.
In terms of liquefied natural gas, Russia is expected to export around 44 billion cubic meters in 2025, accounting for about 7% of global LNG supply, primarily from the Yamal LNG and Sakhalin-2 projects.
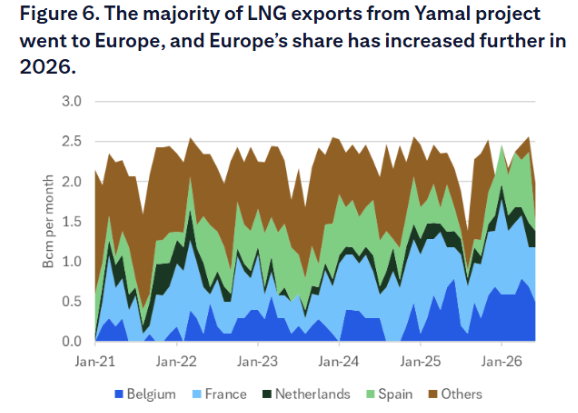 (Most of the LNG from the Yamal project is exported to Europe, with the European share further rising in 2026)
Over 70% of Sakhalin-2's exports go to Japan and South Korea; approximately 90% of Yamal's exports will head to Europe by mid-2026.
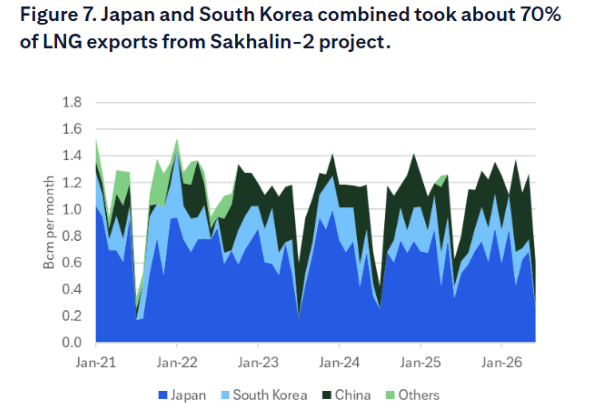 (Japan and South Korea collectively account for about 70% of Sakhalin-2's LNG export share)
If a global ban is imposed on Russian LNG, over 30 billion cubic meters of annual supply will need to be redirected, but due to shipping and contractual limitations, the global LNG market will face significant supply shortfalls.
In terms of pipeline natural gas, due to physical constraints on pipeline direction, banning purchases of Russian pipeline gas would have even more destructive impacts.
Russia exports more than 70 billion cubic meters of pipeline gas annually to markets outside China, with Europe and Turkey alone importing about 37 billion cubic meters.
Key mineral stockpiling: Copper prices may exceed $20,000 per ton
Citi assesses the probability of the key mineral stockpiling race as "high," with the impact varying by commodity and degree of stockpiling. If governments worldwide massively accumulate strategic mineral inventories, copper prices could be pushed above $20,000 per ton.
The report notes that major economies such as the US and the EU have signaled such policies.
The US "Project Vault" proposal aims to invest $12 billion in stockpiling key industrial commodities, while the EU has announced a €3 billion fund for critical mineral security.
Citi uses the copper market as an example: if global refined copper inventories rise from the current level of about 1.3 months of consumption to 3 months, approximately 4 million tons of copper would need to be accumulated within two years.
Based on historical copper supply elasticity, this would require copper prices to rise to about $23,000 per ton. Currently, copper prices in Citi's benchmark scenario are around $13,500 per ton.
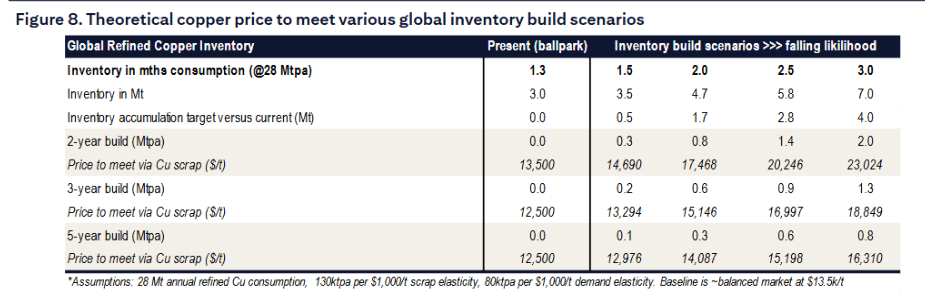 (Theoretical copper prices under various global inventory increase scenarios)
Gold: Short-term may drop another 15% to 20%, then double later
Citi assesses the tail risk for gold as low probability, low direct impact, but significant within the scenario analysis framework.
Gold prices soared from $2,500 per ounce in January 2025 to a peak of $5,500 per ounce in February 2026, and have since retreated to around $4,000 per ounce.
The report believes that the risk of exceeding expectations on the downside is most concentrated in the next 4 to 6 weeks, and if prices fall below $3,800 per ounce, ETF and leveraged position liquidation pressures could trigger en masse.
Potential trigger factors include: deteriorating Middle Eastern situations raising real interest rates and the dollar, as well as liquidity constraints from stock and bond market adjustments.
However, the report remains highly optimistic about gold's medium to long-term trajectory.
China's trade surplus exceeding $1.3 trillion, continuous accumulation by central banks, global concerns over fiscal sustainability, and de-dollarization trends form multiple supports for long-term gold demand.
Citi expects that under major inflation decline and new rounds of investor buying pressure, gold is likely to rise to $6,000 per ounce in the coming years, nearly doubling from current levels.
Extreme El Niño: Cocoa prices may return to $10,000 per ton
The US National Oceanic and Atmospheric Administration (NOAA) updated its forecast in July, raising the probability of a very strong El Niño event to 81%, with a 97% chance of persistence until spring 2027. Citi ranks this as a "moderate probability, high impact" tail scenario.
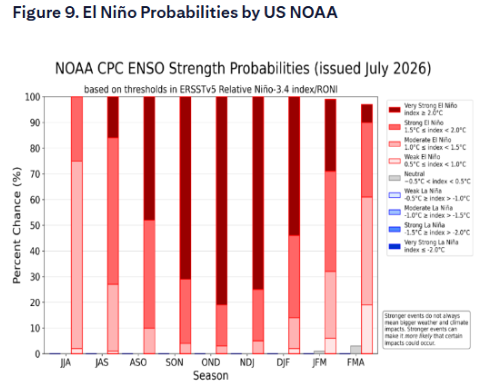 (NOAA's El Niño probability forecast)
The report points out that the impact of extreme El Niño on different agricultural products varies significantly. Cocoa, sugar, and robusta coffee are the most affected; soybeans come next; corn and wheat are relatively less affected.
If West Africa experiences Harmattan winds similar to that of the 2023 to 2024 season, cocoa supply will be severely impacted, with cocoa prices likely returning to $10,000 per ton or even higher, after previously reaching historical highs from 2024 to 2025.
Regarding sugar, India experienced below-average rainfall in June, combined with potential monsoon shortages and flooding risks in Thailand and Brazil, leading to global sugar prices likely rising above 20 cents per pound.
Corn and soybean prices may receive some support due to increased production typically favored by El Niño in US production areas, while heat waves in Europe and weakened monsoons in India remain the primary sources of downside risk.
AI boom and bust: Bi-directional impacts diversify commodity patterns
Citi qualitatively categorizes the impact of AI scenarios on commodities as "low to moderate probability, highly differentiated impact."
The expansion of AI infrastructure is becoming a significant driving force for demand in electricity, natural gas, uranium, and grid metals such as copper and aluminum, with the report predicting that electricity consumption in US data centers will approximately double by 2030.
If the AI bubble bursts, data center construction will sharply contract, and actual and expected demand for copper, natural gas, and uranium will concurrently suffer, further leading to a decline in commodity demand due to a decrease in global risk appetite.
However, at the same time, a weaker dollar may provide passive support for commodity prices, and significant interest rate cuts by the Federal Reserve may also help stabilize the market to some extent.
If the productivity dividend from AI is realized, leading to accelerated energy consumption and pre-emptive investments in the grid, the narrative around structural deficits in copper and aluminum will be further reinforced, Citi believes this is one of the pathways for copper prices to rise to $17,000 per ton in a bull market scenario.
Gold is viewed as the most asymmetrical hedge in the AI scenario, whether in boom or bust, gold has its logic of benefit.
Power of Siberia 2 and LNG surplus: Prices may drop below $6 per million BTU in the 2030s
Citi lists the signing of a final agreement between Russia and China on the Power of Siberia 2 pipeline as a "moderate probability, high impact" scenario.
This pipeline could have an annual gas transport capacity of 50 billion cubic meters, and if it becomes operational around 2030, it will significantly reduce China's LNG import demand, exacerbating an already expected loose global LNG market from 2028.
The report predicts that in this scenario, JKM Asian LNG benchmark prices could fall to $5 to $6 per million BTU, far below the current futures prices of over $8 for 2029 to 2030, and well below the breakeven range of $7 to $10 for most new LNG supply terminals.
Citi notes that the potential new supply of 50 billion cubic meters/year between China and Russia is almost equivalent to the approximately 53 billion cubic meters/year that Russia currently exports to Europe via existing pipelines, and its impact on the global LNG surplus will far exceed the debate over whether Russian pipeline gas returns to Europe.
Extreme Monroe Doctrine: Locking down oil from the Americas may trigger a 1973 replay
If the US pushes the "Monroe Doctrine" to extremes, blocking oil exports from Latin America and the entire Americas, there will be a severe distortion in global oil prices.
The Monroe Doctrine is a core foreign policy proposed by the US in 1823, which fundamentally asserts that "the Americas belong to the Americas," aiming to oppose European powers' interference in American affairs while declaring that the US will not interfere in European internal affairs.
Citi rates the scenario of "the US blocking all oil exports from the Americas" as low probability, high impact.
Under this assumption, Latin America (including Mexico), producing approximately 9.8 million barrels per day, accounting for about 10% of global production, would be cut off from exports to global markets, with an impact comparable to or even exceeding the Arab oil embargo of 1973.
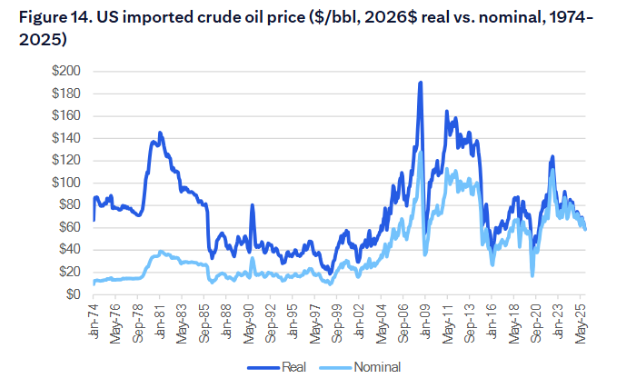 (US imported oil prices, actual and nominal value in 2026, 1974-2025)
At that time, seven OPEC member countries reduced production by about 3.6 million barrels per day (around 6% of global production), causing oil prices to soar from about $3 per barrel to around $12 per barrel by January 1974, an increase of about 300%.
In this scenario, global benchmark crude prices (such as Brent and Dubai) could soar above $100 per barrel, while intra-Americas crude benchmarks (such as WTI and WCS) may see steep discounts exceeding $30 per barrel due to a lack of outlets, forming a severe regional price divergence pattern.
免责声明:本文章仅代表作者个人观点,不代表本平台的立场和观点。本文章仅供信息分享,不构成对任何人的任何投资建议。用户与作者之间的任何争议,与本平台无关。如网页中刊载的文章或图片涉及侵权,请提供相关的权利证明和身份证明发送邮件到support@aicoin.com,本平台相关工作人员将会进行核查。


