Cryptocurrency Scholar: 7.25 Bitcoin (BTC) daily momentum is weakening, is there a hidden reversal opportunity in the four-hour chart? Latest market analysis and operational advice explained
Currently, Bitcoin is at 64000. Before writing this article, a friend in the crypto community told me that it is difficult to trade in a volatile market. In fact, it's not that the market is bad; it's that you want to catch every fluctuation too much. Instead of being led by short-term volatility, it is better to patiently wait for a clear signal, and only take action after breaking through or falling below key levels, which can prevent many unnecessary losses. The essence of trading cryptocurrency is not about who opens more positions, but about who lasts longer. Setting good stop-losses is more important than anything else. After we laid out our positions north of 60000, we have almost taken no extra actions, trading time for space.
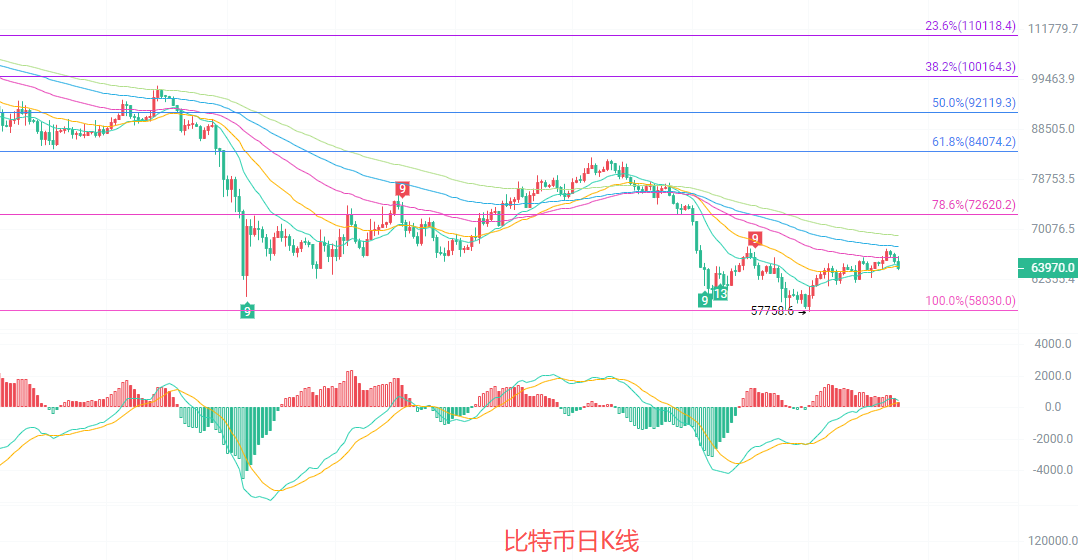
The daily candlestick is currently weakly rebounding above the Fibonacci 100% level, with key resistance above at around 72620. The EMA moving averages are in a bearish arrangement, and the price is still constrained by EMA15 and EMA30, with no effective breakout formed yet. The MACD indicator's red bars are continuously shortening. Although the DIF and DEA are still above the zero axis, the momentum is significantly weakening, indicating insufficient bullish strength. The middle line of the Bollinger Bands is tilted downwards, and the price is operating below the middle line, with support at the lower line around 62100. A rebound is likely to face resistance in the short term, and overall it is still in a phase of corrective consolidation after a decline, with no clear reversal signal yet.
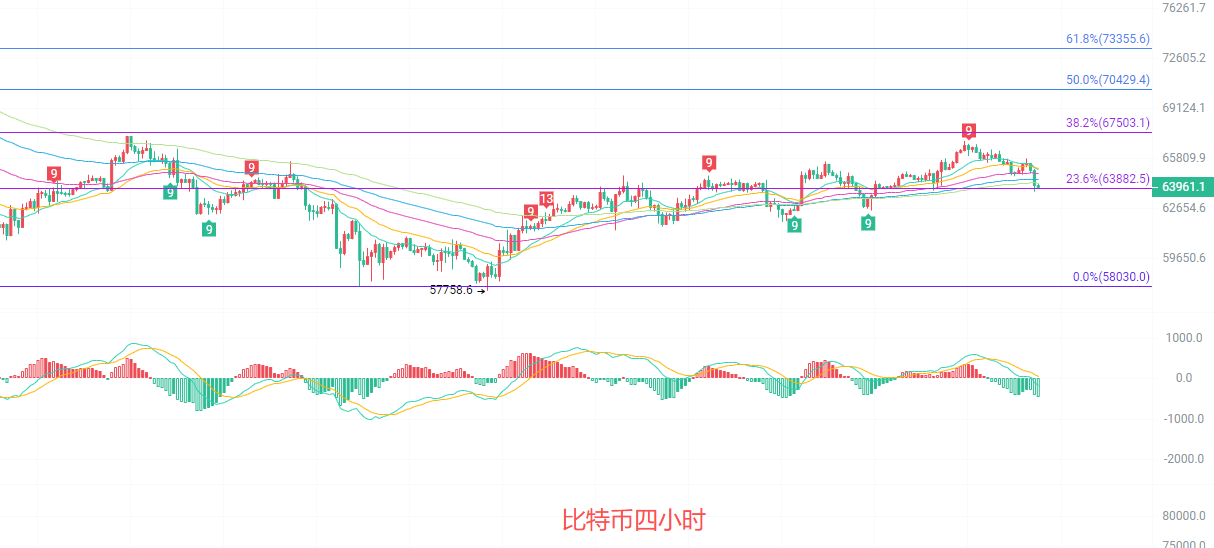
The four-hour candlestick is in a narrow range of oscillation at the Fibonacci 23.6% level, which coincides with EMA15, EMA30, EMA60, forming strong short-term support. The Bollinger Bands are continuously narrowing, with prices repeatedly testing near the middle line, indicating intense competition between bulls and bears. The MACD green bars are beginning to shorten slightly, and there are signs of the DIF turning upwards close to the DEA, indicating a slowdown in short-term bearish momentum. The pressure at the upper Bollinger Band line is around 66950, with support at the lower line around 64150. Currently, it is still in a converging triangle consolidation range, waiting for direction to be chosen, with short-term oscillation favoring bulls but with limited momentum.
Short-term references:
If it does not break below 64000 to 63500, aim north, set stop-loss at 63000, target 65500 to 66500.
If it does not break above 67000 to 67500, aim south, set stop-loss at 68000, target 65500 to 64500.
Specific operations should be based on real-time market data. For more details, please consult the author. The release of this article may be delayed, so it is recommended for reference only, and risk is to be borne by yourself.

Friendly reminder: The above content is solely created by the author of the public account. The advertisements at the end of the article and in the comment section are unrelated to the author; please be careful in distinguishing them. Thank you for reading.
免责声明:本文章仅代表作者个人观点,不代表本平台的立场和观点。本文章仅供信息分享,不构成对任何人的任何投资建议。用户与作者之间的任何争议,与本平台无关。如网页中刊载的文章或图片涉及侵权,请提供相关的权利证明和身份证明发送邮件到support@aicoin.com,本平台相关工作人员将会进行核查。


