Crypto Circle Academician: Is the horizontal trend of 7.25 Ethereum (ETH) not trendless, but the calm before the storm? Latest market analysis reference
The current price of Ethereum is 1863. Is this market making everyone lose their temper? The price is moving horizontally around 1860, sometimes inducing bullish and sometimes inducing bearish. Many friends are getting slapped in the face by chasing highs and cutting lows, and the mentality is directly blown up. The rhythm of the current volatile market itself is quite grinding. Today, we will thoroughly explain support and resistance, long and short signals, and entry points with stop losses all at once, helping you to avoid invalid trades, seize certain opportunities accurately, and not be led like leeks by the market!
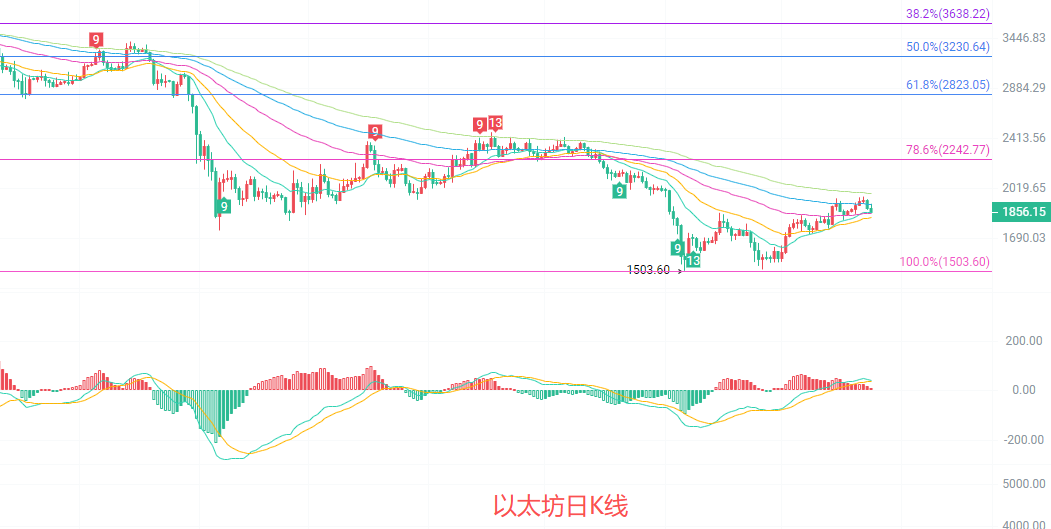
The daily candlestick is in a clear horizontal phase at the end of a downward trend. The price is still running below the EMA15/30/60/90 moving averages, and the overall bearish trend has not been broken. However, the red bars of the MACD indicator continue to shorten, and the bullish momentum is beginning to weaken. The middle track of the Bollinger Bands around 1837 forms short-term support, while the upper track at 1957 is a key resistance level. The Fibonacci 78.6% retracement level at 2242 remains strong resistance, while the previous low at 1503 is the bullish defense bottom line. Currently, it is in a weak repair phase after a decline, and the rebound strength is limited, with no clear reversal signal yet.
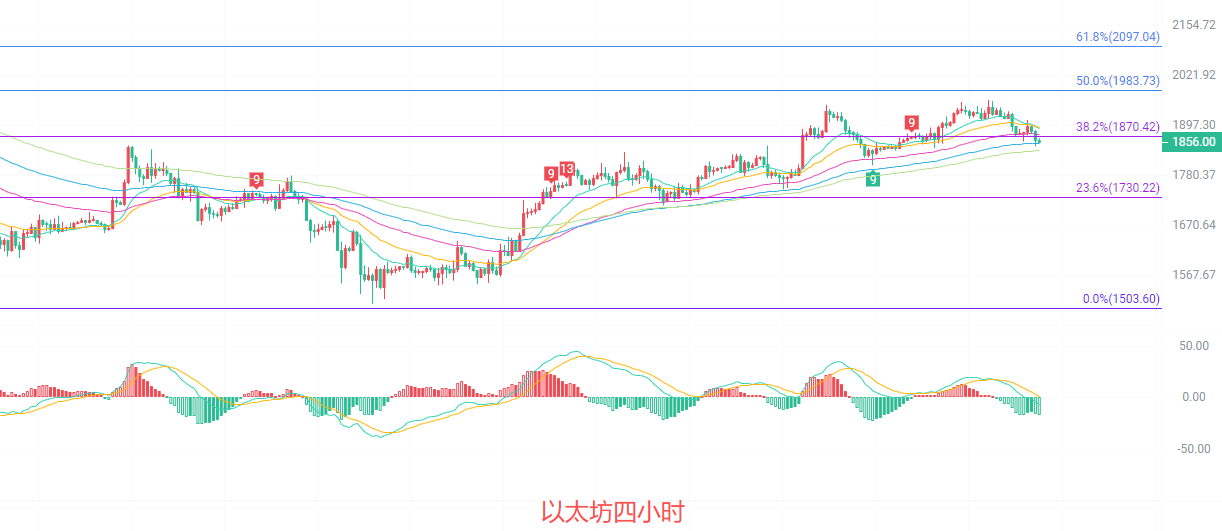
The four-hour candlestick is near the middle track of the channel. The price is supported by the EMA15/30 moving averages, the Bollinger Bands show a closing state, and the fluctuation range has narrowed to 1856-1957, intensifying the long and short game. The MACD indicator DIF has crossed below DEA, and the green bars are beginning to grow, showing short-term pullback signals. The Fibonacci 38.2% position around 1870 forms short-term pressure, and the 23.6% position at 1730 is strong support. Currently, the rebound momentum is insufficient, indicating a need for a pullback to test the moving average support.
Short-term reference:
If the lower range of 1850 to 1800 does not break and goes up, stop loss at 1760, target looking at 1930 to 1970.
If the upper range of 1980 to 2020 does not break and goes down, stop loss at 2050, target looking at 1930 to 1890.
The specific operation should mainly rely on real-time market data. For more informational details, please consult the author. The article has a delay in publication, so it is suggested for reference only, with risks borne by the reader.

Kind reminder: The above content is solely created by the author of the public account. The advertisements at the end of the article and in the comment section are not related to the author. Please distinguish carefully. Thank you for reading.
免责声明:本文章仅代表作者个人观点,不代表本平台的立场和观点。本文章仅供信息分享,不构成对任何人的任何投资建议。用户与作者之间的任何争议,与本平台无关。如网页中刊载的文章或图片涉及侵权,请提供相关的权利证明和身份证明发送邮件到support@aicoin.com,本平台相关工作人员将会进行核查。


