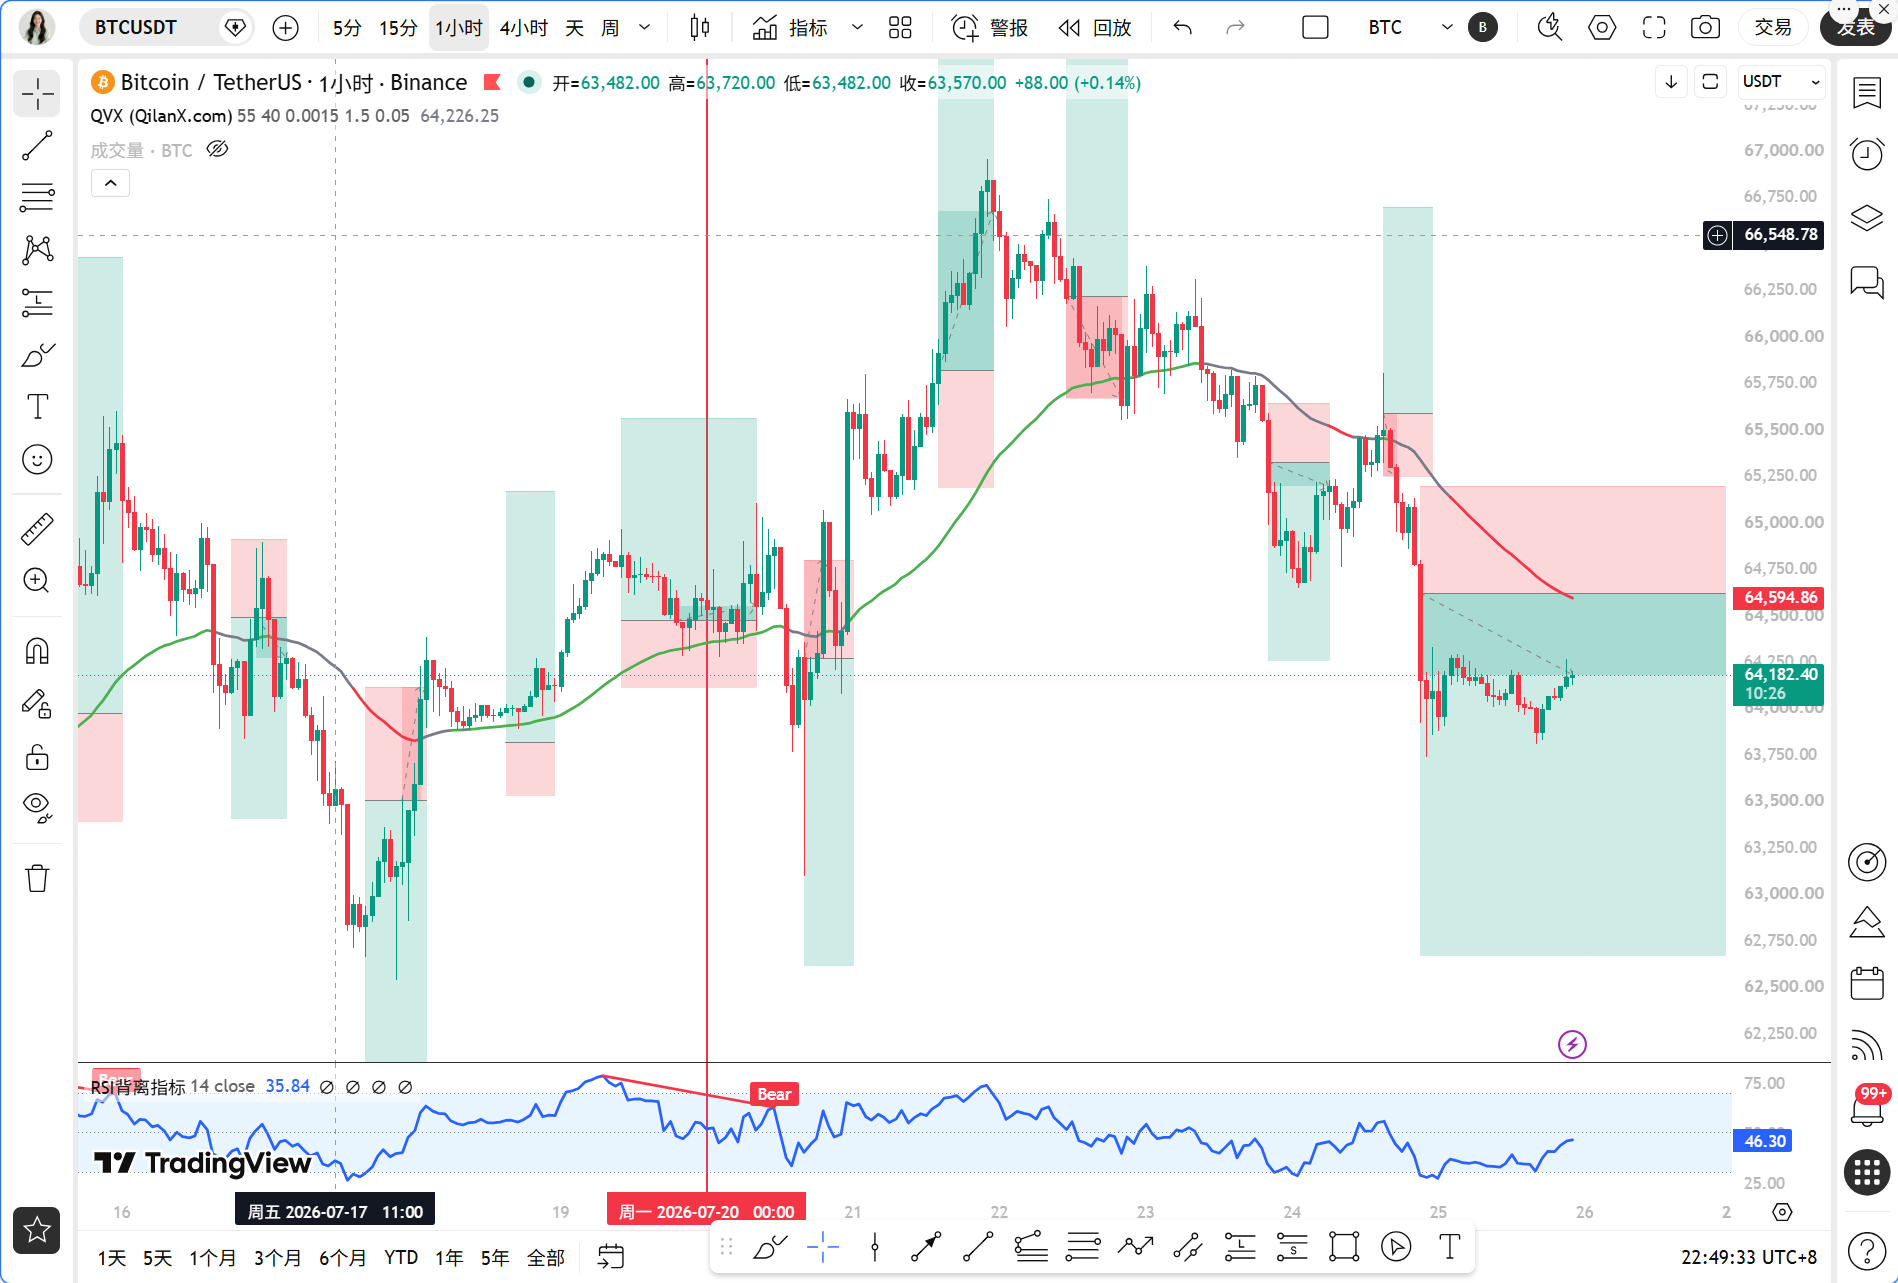
Dear teammates, tonight's market information is quite substantial. On one side, the conflict between the U.S. and Iran is escalating, oil prices are approaching $100, technology stocks lost $800 billion in market value overnight, and risk assets are under extensive pressure; on the other side, institutional funds are withdrawing at an accelerated pace, with a daily net outflow of up to $240 million from the U.S. spot Bitcoin ETF, and Ethereum ETF also lost $70.7 million. Furthermore, BitMart's platform token BMX has plummeted 60%, causing panic in the market, and the Fear and Greed Index has dropped to 27, indicating extreme fear. Under this confluence of multiple bearish sentiments, can BTC hold above 64,000? Sister Qinglan will guide us through the data to clarify the current situation.
Current Price and Time
The current time is July 25th, 22:50, and the latest Bitcoin price is 64,178 USDT, with a 24-hour increase of only 0.35%, basically in a sideways and volatile state. This position is very sensitive, with both bulls and bears testing the waters, and the direction may be chosen tonight.
Multi-Cycle State Overview
First, looking at the daily chart, MA5 is at 65,217, MA10 is at 64,866, and MA30 is at 63,167. The price is currently operating below MA5 and MA10, but still above MA30. The MACD bar is at 71.64; although bullish momentum is still present, DIF and DEA are very close, posing a risk of a death cross formation. The RSI is at 51.66, in a neutral to weak area. Overall, the daily chart shows a high-level oscillation biasing bearish, but the medium-term upward trend has not been completely damaged.
The 4-hour scale looks quite grim. MA5 is at 64,094, MA10 is at 64,482, and MA30 is at 65,357, with the price struggling near MA5 but clearly suppressed by MA10 and MA30. The MACD bar is at -151.99, with bearish momentum continuously escalating. The RSI is at 31.46, entering the oversold area, indicating strong short-term downward momentum, but overselling also suggests a potential technical rebound at any time.
The 1-hour level is the current main battlefield of the bulls and bears. MA5 is at 64,121, MA10 is at 64,052, and MA30 is at 64,216, with the price oscillating between MA5 and MA10. The MACD bar is at 56.57; while still positive, the bar is narrowing, indicating that bullish rebound strength is weakening. The RSI is at 56.78, neutral but leaning strong, but with insufficient upward momentum. The key point is that EMA55 is at 64,600, and the current price is 64,178, leaving a margin of 0.65% to EMA55, indicating clear pressure below EMA55.
At the 15-minute scale, MA5 is at 64,176, MA10 is at 64,156, and MA30 is at 64,057, with the price operating above MA5 and MA10, showing signs of stabilization in the short term. The MACD bar is at 10.28, and DIF is above DEA, with the RSI at 64.91, indicating a short-term strong bias. However, the 15-minute scale is too small and can only serve as a reference for ultra-short positions, not as a basis for trend judgment.
TPV Signal Verification
According to the Qinglan TPV system, the current 1-hour EMA55 is at 64,600, and the price of 64,178 is clearly below EMA55, hence the trend is designated as a bearish trend area.
Short Selling Conditions Verification: First, the price is under pressure below the 1-hour EMA55, with all of the last 8 1-hour closing prices below EMA55 and crossing times at 0, fully meeting the conditions. Second, in terms of resistance, there have been consecutive upper shadows on the 4-hour level, and the 1-hour level has repeatedly faced resistance near 64,500 and has fallen back, indicating obvious pressure above. Third, in terms of rebound strength, although the 1-hour MACD bar is positive, it has retreated from a high point, and the RSI has fallen from around 65, indicating obviously insufficient rebound momentum. Overall, all conditions for short selling are satisfied.
Long Conditions Verification: First, the price has not stabilized above the 1-hour EMA55, thus currently not satisfied. Second, regarding support stabilization, there are signs of bottoming on the 15-minute level, but the scale is too small to confirm. Third, regarding the exhaustion of downward momentum, the 4-hour RSI has entered the oversold zone, but the 1-hour MACD bar is still in positive territory, showing no obvious exhaustion signals. Therefore, long conditions are not satisfied.
Oscillation Trend Judgment: Among the last 8 closing prices of the 1-hour candles, the count greater than EMA55 is 0, with crossing times at 0, and the price margin to EMA55 is 0.65%, not meeting the oscillation threshold. Currently, there is a clear bearish unilateral trend.
On-Chain/Fundamentals
In terms of on-chain data, the Fear and Greed Index is 27, in the extreme fear zone, where historically this position often corresponds to a stage bottom, but the possibility of continued downward pressure cannot be ruled out. BTC's market share stands at 56.53%, indicating that funds are still consolidating towards BTC, while altcoins perform weaker.
The funding situation presents the biggest bearish signal tonight. The U.S. spot Bitcoin ETF has a daily net outflow of $240 million, with the Ethereum ETF also seeing a $70.7 million outflow, indicating ongoing withdrawal of institutional funds. Additionally, the whales who took 40x long positions on BTC faced a stop loss at $368,000, with high leverage liquidation showing the weakness of the bulls. These signals all indicate that the short-term funding landscape is bearish, and the market lacks incremental capital.
Key Defense and Attack Levels
The first resistance level above is the 1-hour EMA55 at 64,600, which is the current dividing line between bulls and bears. If the price can stabilize above 64,600, the bearish trend may temporarily ease. The second resistance level is the 4-hour MA10 at 64,482, close to EMA55, forming a resonating pressure. The third resistance level is the 4-hour MA30 at 65,357, which is the mid-term demarcation line between bulls and bears.
The first support level below is the 15-minute MA30 at 64,057, which has been tested multiple times today and has some support. The second support level is the 4-hour MA5 at 64,094, forming a support band with 64,057. The third support level is the daily MA30 at 63,167, the last line of defense for the bulls in the medium term; if it breaks down, the daily trend may turn bearish.
Trading Thoughts
The current bearish trend is clear, but the 4-hour RSI is already oversold, making short chasing risky. Sister Qinglan suggests focusing on shorting during rebounds, avoiding chasing shorts or bottom fishing.
Direction: Short
Entry Condition: Wait for the price to rebound to the range of 64,500-64,600, looking for a 1-hour level long upper shadow or top formation signal, concurrently with the MACD bar falling from a high point, confirming weakness in the rebound before entering. If the price directly breaks below 64,000, then abandon the short and wait for stabilization signals at lower positions.
Stop Loss: 64,850, placed 30 points above the 1-hour EMA55 to avoid being stopped out by false breaks.
Target Level: First target 63,400, second target 63,100. If the price breaks below 63,100, you can continue to hold for 62,500.
Risk Warning
The current market is under dual pressure from geopolitical factors and funding conditions, and volatility may increase; please strictly control positions, with single transaction risks not exceeding 2% of total capital.
Follow Qinglan Crypto Classroom to grasp more trading opportunities! Welcome to visit the official website www.qinglan.org
📊 Qinglan TPV Trading Strategy Backtest Reference
🕒 Last Backtesting Time 07-25 07:00:01
Total Analysis: 3190 Backtests: 2407 Accuracy: 77.1% (1857/2407)
免责声明:本文章仅代表作者个人观点,不代表本平台的立场和观点。本文章仅供信息分享,不构成对任何人的任何投资建议。用户与作者之间的任何争议,与本平台无关。如网页中刊载的文章或图片涉及侵权,请提供相关的权利证明和身份证明发送邮件到support@aicoin.com,本平台相关工作人员将会进行核查。


