Academician of the Cryptocurrency Circle: 7.27 Bitcoin (BTC) Dual Cycle Resonance Disassembly: Is the rebound a trap or the starting point of a reversal? Latest market analysis and operation suggestion analysis
Currently, Bitcoin is at 64650, still being repeatedly slapped in the face by the market? Others feast while you sip soup, others take profits while you hold positions? Stop blindly following trends and placing orders based on feelings! Today, I will directly use daily and 4-hour dual cycle analysis to clear up the true trend of BTC at the current price of 64680, providing reference for entry and stop-loss points. No nonsense; after reading this, you will understand the main force's rhythm and never again be a chasing high and killing low retail investor!
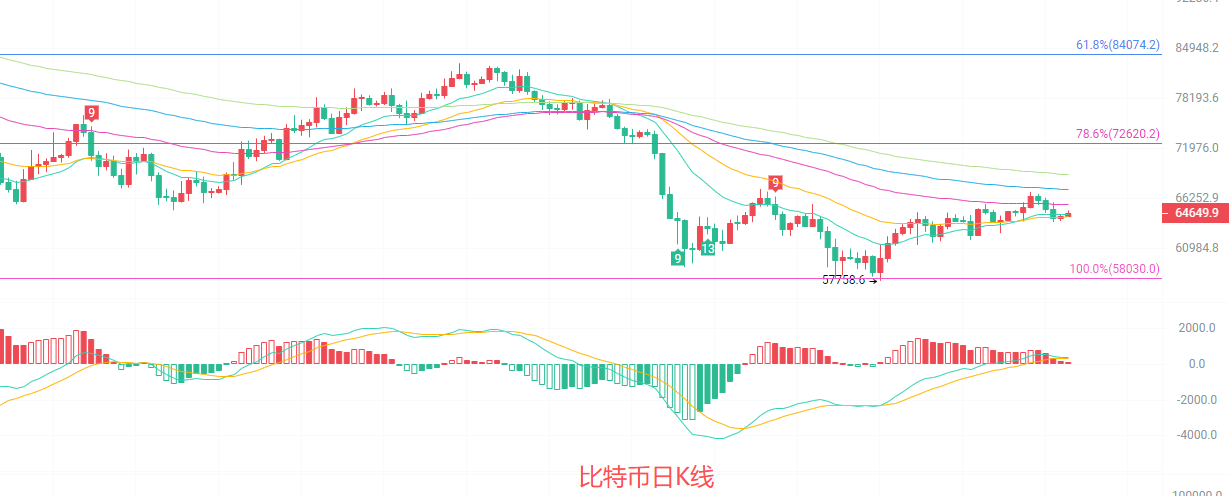
The daily candlestick is running above the EMA15, but is still suppressed by EMA30/60/90, and the bearish trend has not completely reversed. The MACD red columns are continuously expanding, with the DIF and DEA golden cross moving upward, indicating a slight recovery in short-term bullish momentum; the middle track of the Bollinger Bands is flattening, and the price has returned above the middle track, with the volatility range gradually narrowing. Strong support below is at the Fibonacci 100% retracement level of 58030, and the first resistance above is near 72620, currently in a weak rebounding phase after a decline.
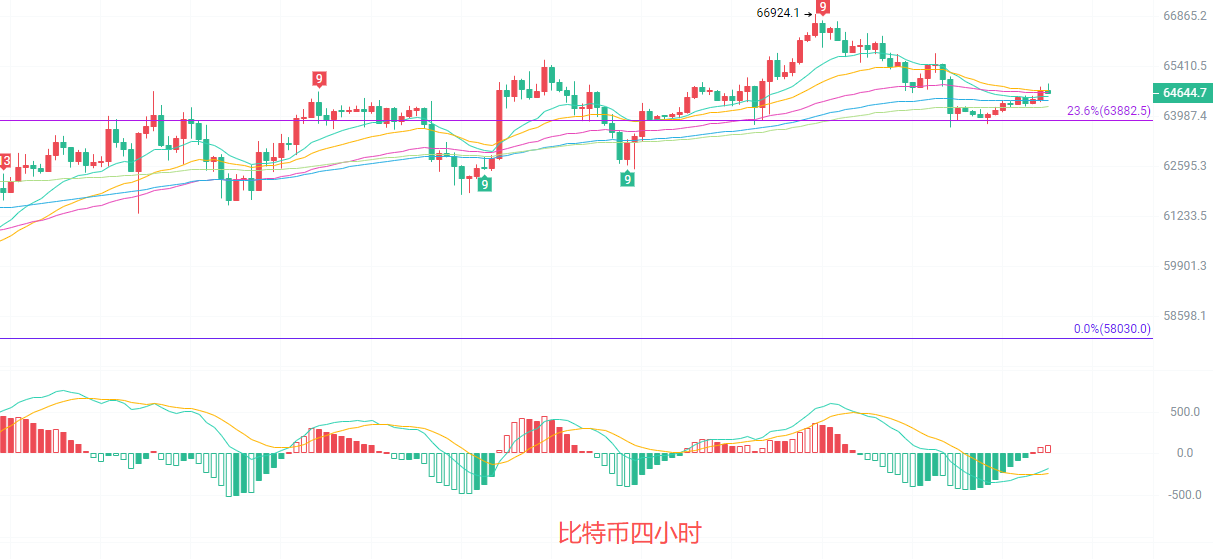
The four-hour candlestick rebounded after retesting the support of the EMA15/30 moving averages, with EMA15 and EMA30 consolidating and flattening, intensifying the short-term bull-bear tug of war. The MACD red column has slightly shortened, and the DIF and DEA have flattened at a high level, indicating a decrease in bullish momentum; the middle track of the Bollinger Bands is continuously rising, and the price is operating between the middle and upper tracks, with a volatility range of 63636-65445. The Fibonacci 23.6% resistance level of 63882 has been broken; currently, the key resistance above is around 67500, and there is still a possibility of a short-term upward fluctuation.
Short-term reference:
If it does not break below 64000 to 63500, go long, with a stop loss at 63000, and target at 65500 to 66500.
If it does not break above 67000 to 67500, go short, with a stop loss at 68000, and target at 65500 to 64500.
Specific operations should be based on real-time market data. For more information, you can consult me. The article release has a delay; it is recommended for reference only, and risks are borne by yourself.

Kind reminder: The above content is solely created by the author of the public account. The advertisements at the end of the article and in the comment section have nothing to do with the author, so please discern carefully. Thank you for reading.
免责声明:本文章仅代表作者个人观点,不代表本平台的立场和观点。本文章仅供信息分享,不构成对任何人的任何投资建议。用户与作者之间的任何争议,与本平台无关。如网页中刊载的文章或图片涉及侵权,请提供相关的权利证明和身份证明发送邮件到support@aicoin.com,本平台相关工作人员将会进行核查。


