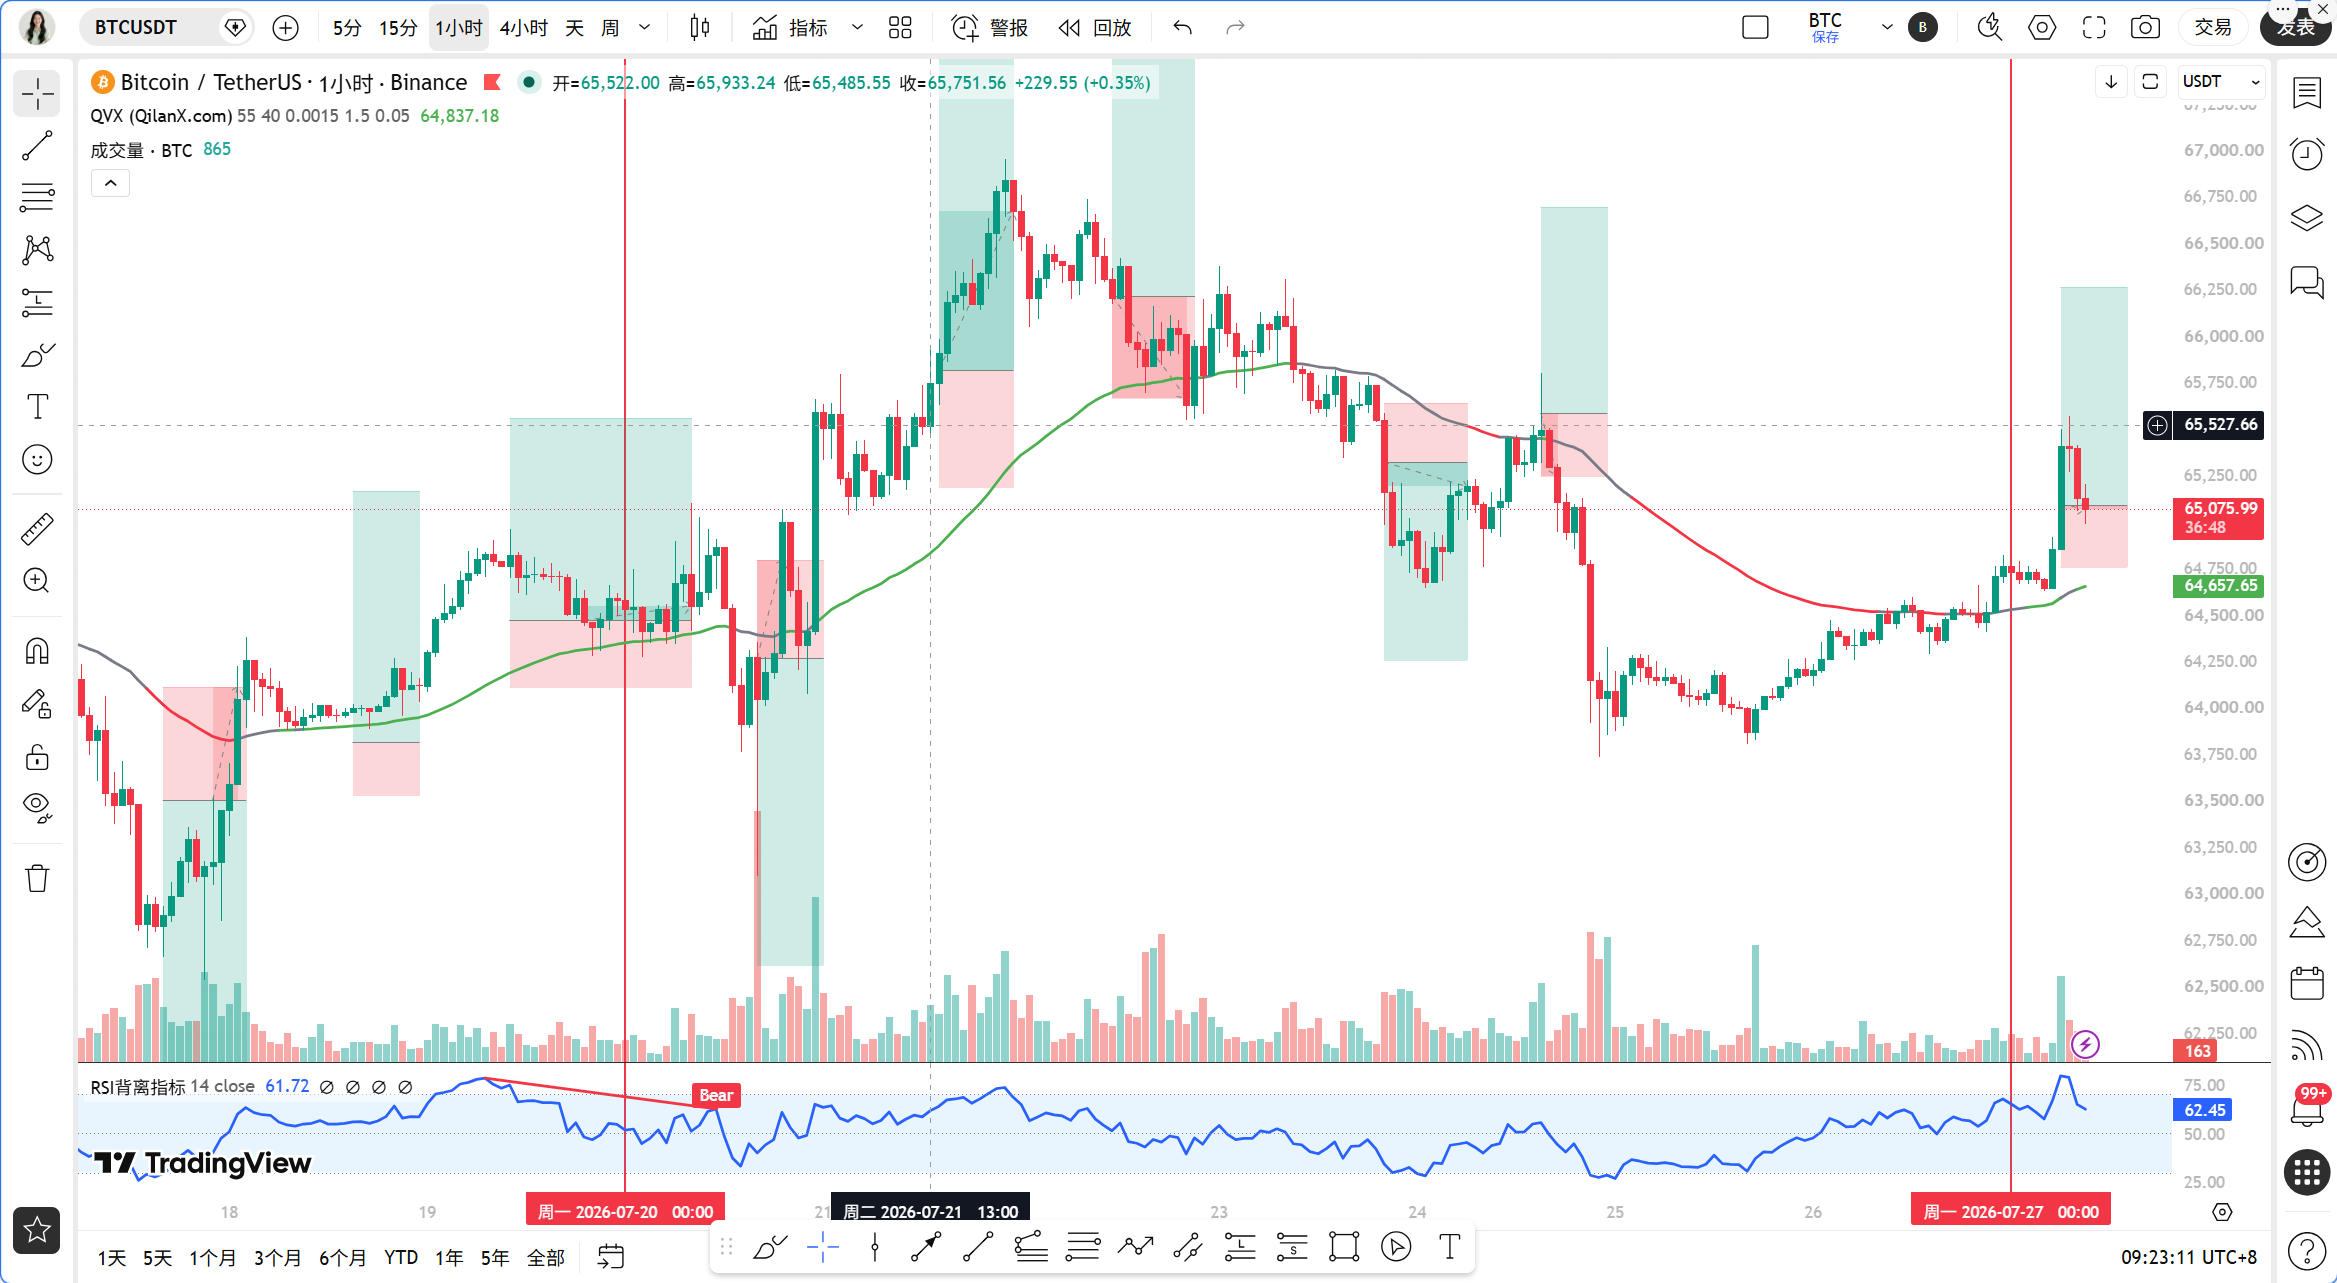
Good morning, teammates, I am Sister Qinglan. There are two significant news items worth paying attention to before the market opens today. First, there are signs of easing in the US-Iran situation, which directly drives the rebound of risky assets, with Bitcoin rising nearly 1% in 24 hours, regaining the $65,000 mark. Second, BitMart exchange has seen a halt in large withdrawals, raising concerns about a trust crisis in the exchange, which casts a shadow over the rebound. Positive and negative factors are intertwined, and market sentiment oscillates between fear and greed, with the fear and greed index at only 30, indicating that retail investors are generally pessimistic. In this context, we need to let data speak rather than be swayed by emotions.
Current Price and Time
The current time is July 27, 09:24, and the Bitcoin price is 65,076 USDT. The 24-hour increase is 0.97%, and the market share remains stable at 56.46%, indicating that Bitcoin is still the main battlefield for funds. The price is just stuck at the round number of 65,000, which is a psychological barrier as well as a key technical battleground.
Overview of Multi-Cycle Status
First, let's look at the daily level. The daily MA5 is at 64,818, and MA10 is at 65,157. The price is currently between these two moving averages, indicating a short-term moving average convergence state. The MACD's DIF is 427.65, DEA is 360.93, and the histogram value is 66.73. Although it is in the positive area, the histogram value has narrowed compared to previous days, indicating that the upward momentum is waning. The RSI is at 62.61, in a neutral to strong area, neither overbought nor oversold, and the direction is unclear.
Now let's look at the 4-hour level. The 4-hour MA5 is at 64,889, MA10 is at 64,632, and MA30 is at 64,949, with the price oscillating near MA30. The MACD's DIF is -56.62, DEA is -171.78, and histogram value is 115.17. Although the histogram value is above the zero axis, the DIF and DEA remain in the negative area, indicating this is a rebound in a bearish trend, not a reversal. The RSI is at 67.09, close to the overbought threshold but has not yet touched it, indicating there is still some room for the rebound.
The 1-hour level is today's focus. The 1-hour MA5 is at 65,176, MA10 is at 64,939, and MA30 is at 64,639, with the price stabilizing above MA30. The MACD's DIF is 197.49, DEA is 148.21, and histogram value is 49.28, in the positive area and expanding, indicating that short-term bullish momentum is still increasing. The RSI is at 67.38, similar to the 4-hour, neutral to strong. EMA55 is at 64,617, which is the boundary between bullish and bearish according to the Qinglan TPV system.
15-minute level. The 15-minute MA5 is at 65,125, MA10 is at 65,240, MA30 is at 64,971, with the price oscillating near MA10. The MACD's DIF is 99.53, DEA is 135.62, histogram value is -36.10, showing signs of a dead cross, indicating pressure for a pullback in the ultra-short term. The RSI is at 59.16, retreating from a high position but still above 50, indicating a normal adjustment.
TPV Signal Validation
According to the core rules of the Qinglan TPV system, we use the 1-hour EMA55 as the boundary between bullish and bearish. The current price is 65,076, far above the EMA55 at 64,617, with an absolute margin of 0.71%, not meeting the oscillation threshold. In the past 8 1-hour candlesticks, the closing price has been greater than EMA55 8 times, with 0 crossings, indicating that the price has been operating above EMA55, belonging to the bullish trend area.
Long Condition Verification. First, the price is stabilizing above the 1-hour EMA55 with two consecutive candlesticks closing above EMA55, this condition has been met. Second, support stabilization, we need to look for long lower shadows or bottom formations. From the 1-hour candlestick chart, the most recent candlestick is a bullish one, but the lower shadow is not obvious, and there is no typical bottom reversal pattern. Third, the downward momentum exhaustion, MACD histogram has shortened for two consecutive cycles, but the current MACD histogram is expanding instead of shortening, so this condition is not met. Overall, the long conditions are not fully established.
Short Condition Verification. First, the price is under pressure below EMA55, the current price is above EMA55, so this condition is not met. Second, resistance meeting pressure, we need to look for long upper shadows or top formations. The recent few candlesticks have upper shadows, but the extent is not large, and no clear top patterns have formed. Third, the rebound lacks strength, MACD histogram has shortened for two consecutive cycles, but the current histogram value is expanding, so this does not satisfy the condition. The short conditions are also not established.
The current signal provided by the TPV system is: the bullish trend is established, but the long conditions are incomplete, and the short conditions are even less established. This means the market is in a consolidation phase within a bullish trend, and it is not suitable to chase highs or blindly short.
On-Chain and Fund Situation
In terms of on-chain data, the fear and greed index is at 30, in the fear zone, indicating that retail investor sentiment is pessimistic, which is often one of the characteristics of market bottoms. However, the withdrawal halt incident at BitMart may exacerbate panic, and we need to guard against short-term selling pressure. Bitcoin's market share is 56.46%, indicating that funds are still concentrated in Bitcoin, with altcoins relatively weak. Additionally, the $60,000 to $61,500 area has formed a liquidity accumulation zone, with a large number of stop-loss orders concentrated there. If the price pulls back, it may trigger a chain liquidation, intensifying downside risks.
Key Attack and Defense Levels
Upper resistance levels: The first resistance level is at 65,500, near the previous high; the second resistance level is at 66,000, which is the resistance zone at the 4-hour level. Lower support levels: The first support level is at 64,600, which is the position of the 1-hour EMA55; the second support level is at 64,000, which overlaps the 4-hour MA30 and previous low area. If the price breaks below 64,600, the bullish trend will be challenged.
Trading Ideas
Based on the signals from the TPV system and the current multi-cycle status, Sister Qinglan provides the following trading ideas.
Direction: Slightly bullish in the short term, but do not chase highs, wait for low buying opportunities after a pullback.
Entry Conditions: If the price retraces to the $64,600 to $64,800 area and a bottom formation or long lower shadow appears at the 1-hour level, while the MACD histogram starts to shorten, a light long position can be taken. If the price directly breaks 65,500 and stabilizes, it can be chased, but the position should be lighter.
Stop-Loss Level: The stop-loss for long positions is set below 64,000. If it breaks this level, it indicates that the bullish trend has been broken.
Target Levels: The first target is 65,500, and the second target is 66,000. If the price touches 66,000 and then shows a top formation or long upper shadow, consider taking profits or reversing to short.
Risk Warning
The BitMart incident may trigger a chain reaction. If panic spreads, Bitcoin may swiftly breach the 64,600 support, and long positions need to be decisively stopped out.
Follow Qinglan Crypto Classroom to seize more trading opportunities! Welcome to visit the official website www.qinglan.org
📊 Qinglan TPV Trading Strategy Backtest Reference
🕒 Last Backtest Time July 27, 07:00:01
Total Analysis: 3,235 Backtest: 2,444 Accuracy: 77.5% (1,893/2,444)
免责声明:本文章仅代表作者个人观点,不代表本平台的立场和观点。本文章仅供信息分享,不构成对任何人的任何投资建议。用户与作者之间的任何争议,与本平台无关。如网页中刊载的文章或图片涉及侵权,请提供相关的权利证明和身份证明发送邮件到support@aicoin.com,本平台相关工作人员将会进行核查。


