BTC 4-hour cycle market objective interpretation
1. Bollinger Bands and K-line patterns
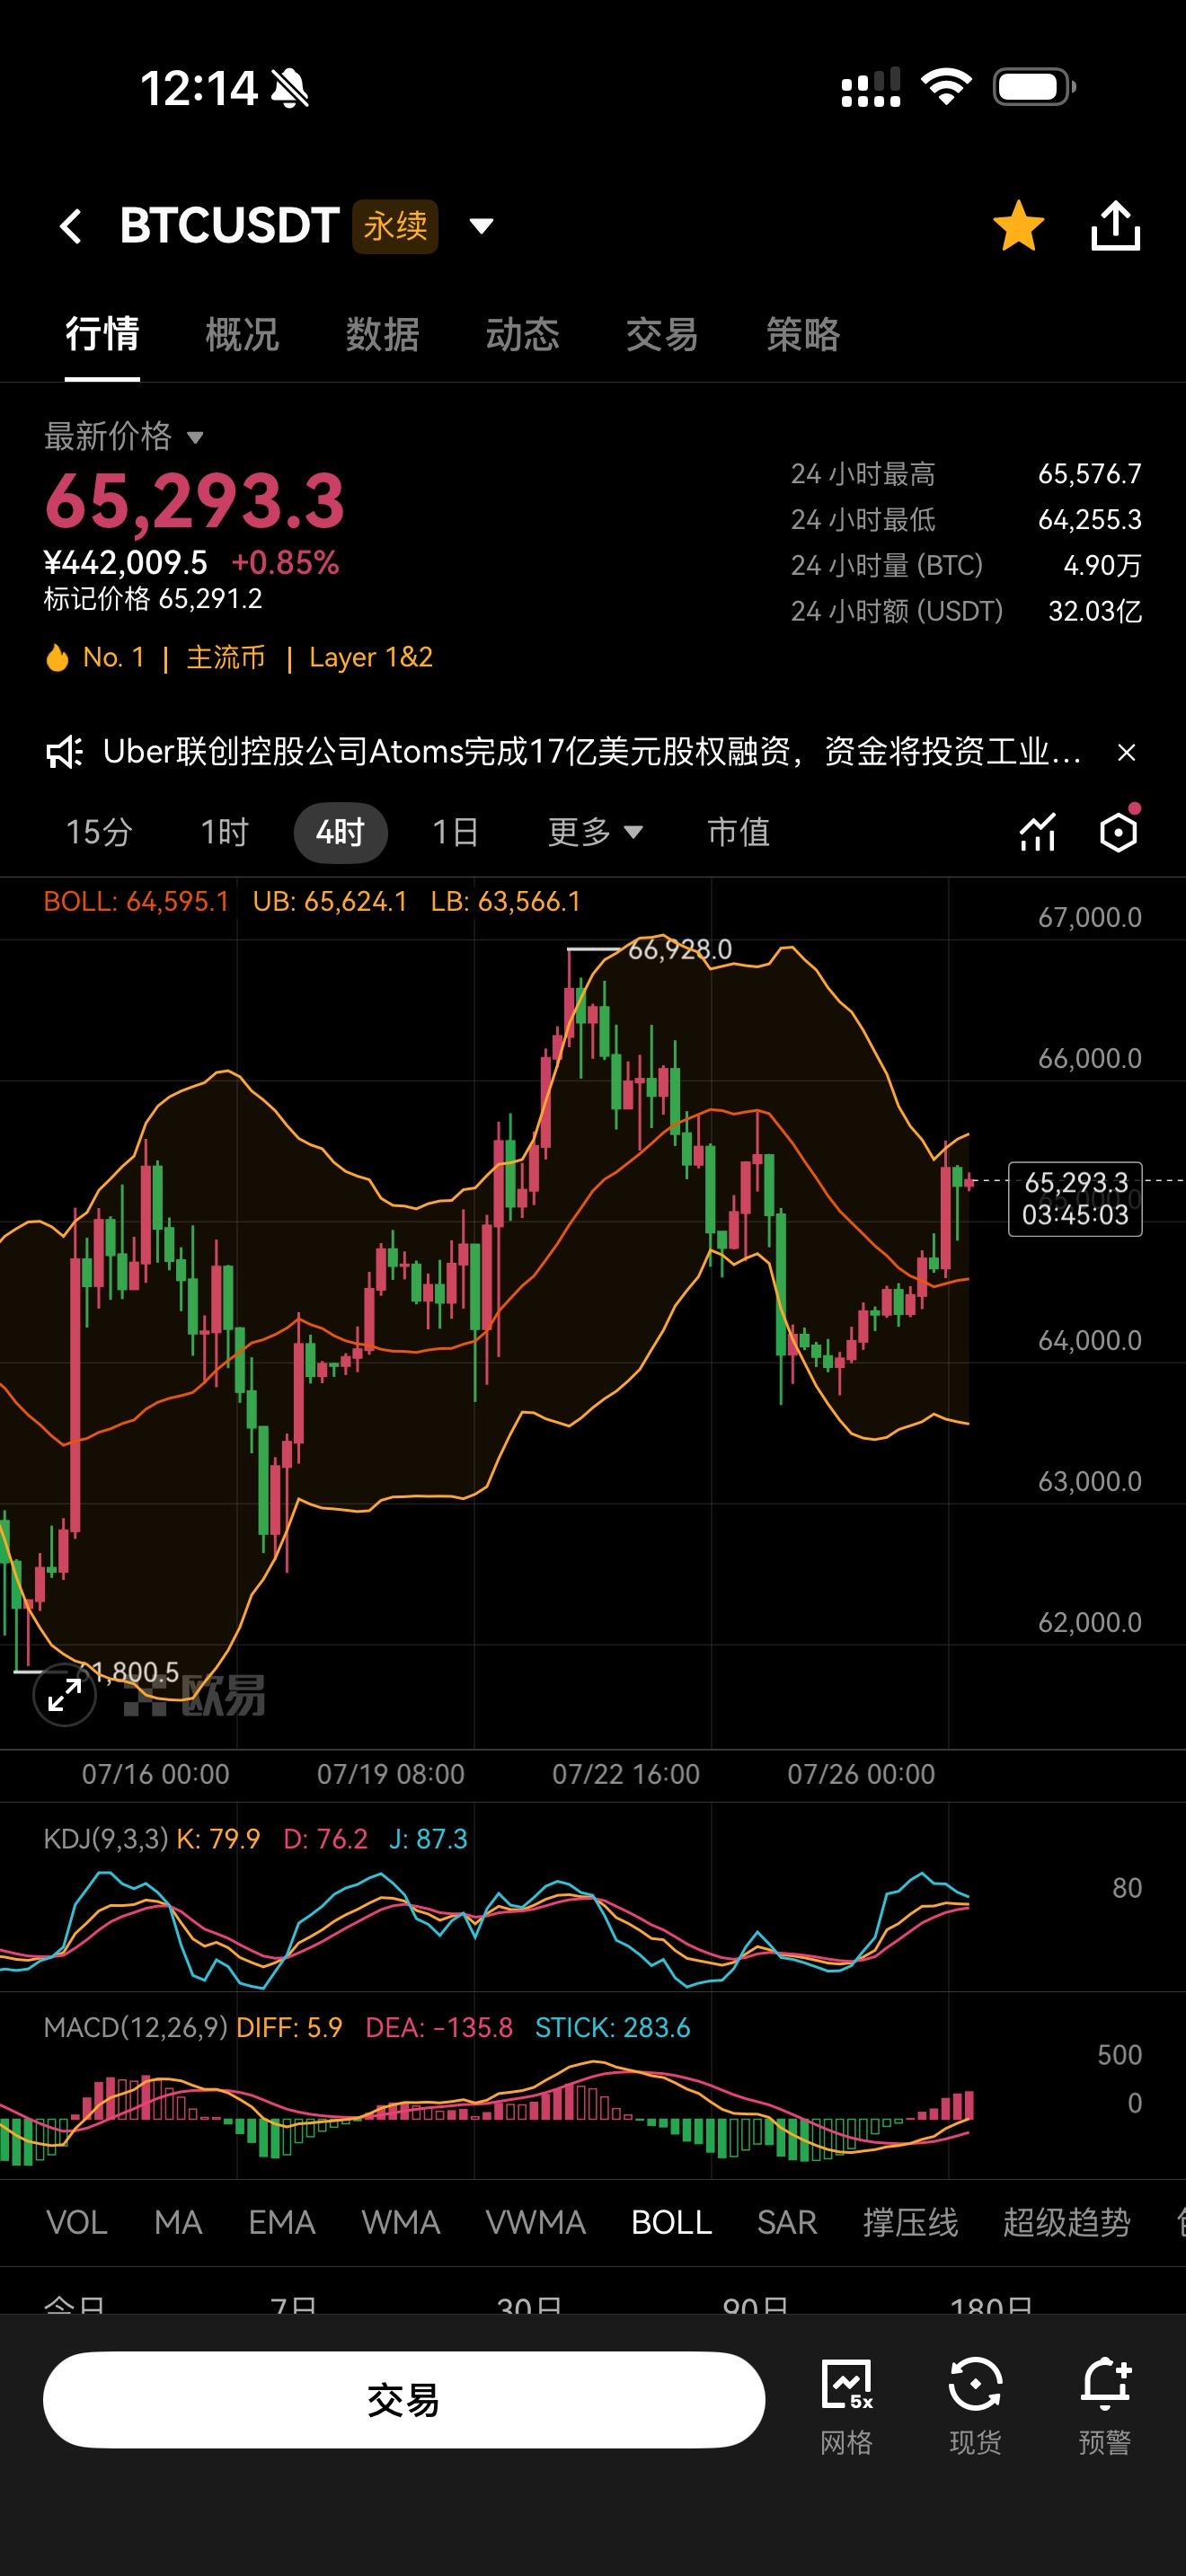
1. Bollinger band parameters: middle line 64500, upper band 65600, lower band 63600, current price 65293. The price is running within the range between the middle line and the upper band.
2. K-line trend: Previously, it fell from the high point of 67000 to a low near 63500, completing a stop decline, then continued with a series of bullish candles to rebound and repair. Currently, continuous bullish candles are approaching the upper Bollinger band, indicating a repair rebound structure after a big drop.
3. Pattern characteristics: During the decline, short-selling momentum was fully released, and funds entered at low levels to drive continuous recovery. The short-term trend is slightly strong, but it has not yet broken through the strong pressure at the upper Bollinger band, and there is still pressure above.
2. Technical indicator signals
1. KDJ indicator: K79.9, D76.2, J87.3, all three lines above 80, entering a short-term overbought range. Short-term bullish sentiment is rising, and there is a demand for a technical pullback to digest.
2. MACD indicator: DIFF line crosses above DEA line to form a golden cross, red bars continue to expand. The medium-term rebound repair trend is established, short-selling momentum below is basically exhausted, and bullish positions dominate for the time being.
3. Key price levels
Pressure zone
1. Short-term first resistance: Upper Bollinger band 65600 is the primary pressure point for the current rebound.
2. Medium-term strong resistance: Previous high of 67000 marks the starting position of this round of decline, an important boundary between bulls and bears.
Support zone
1. Short-term nearby support: Middle Bollinger band 64500 is the core support line for this rebound.
2. Strong support at low levels: Lower Bollinger band 63600 is the recent lowest point of the decline, the bottom of this round of consolidation.
4. Comprehensive summary of the market
After completing a deep correction on the 4-hour level, Bitcoin has entered a phase of continuous repair and rebound. The MACD golden cross confirms the medium-term rebound rhythm; however, the KDJ has entered the overbought range, and the price is close to the upper Bollinger band, indicating signs of exhausted short-term upward momentum.
Future market scenarios:
1. Price encounters pressure at 65600 upper band, fallback to 64500 middle band to repair overbought indicators before choosing a direction;
2. Bullish funds continue to exert force, breaking through the upper band pressure, further testing the previous high of 67000.
Overall pattern: Medium-term rebound trend established, short-term in an overbought pressure phase, with the battle between bulls and bears concentrated at the upper Bollinger band.
(All indicator data will fluctuate with time; please refer to real-time data.)
ETH 4-hour market complete interpretation
1. K-line and Bollinger band pattern analysis
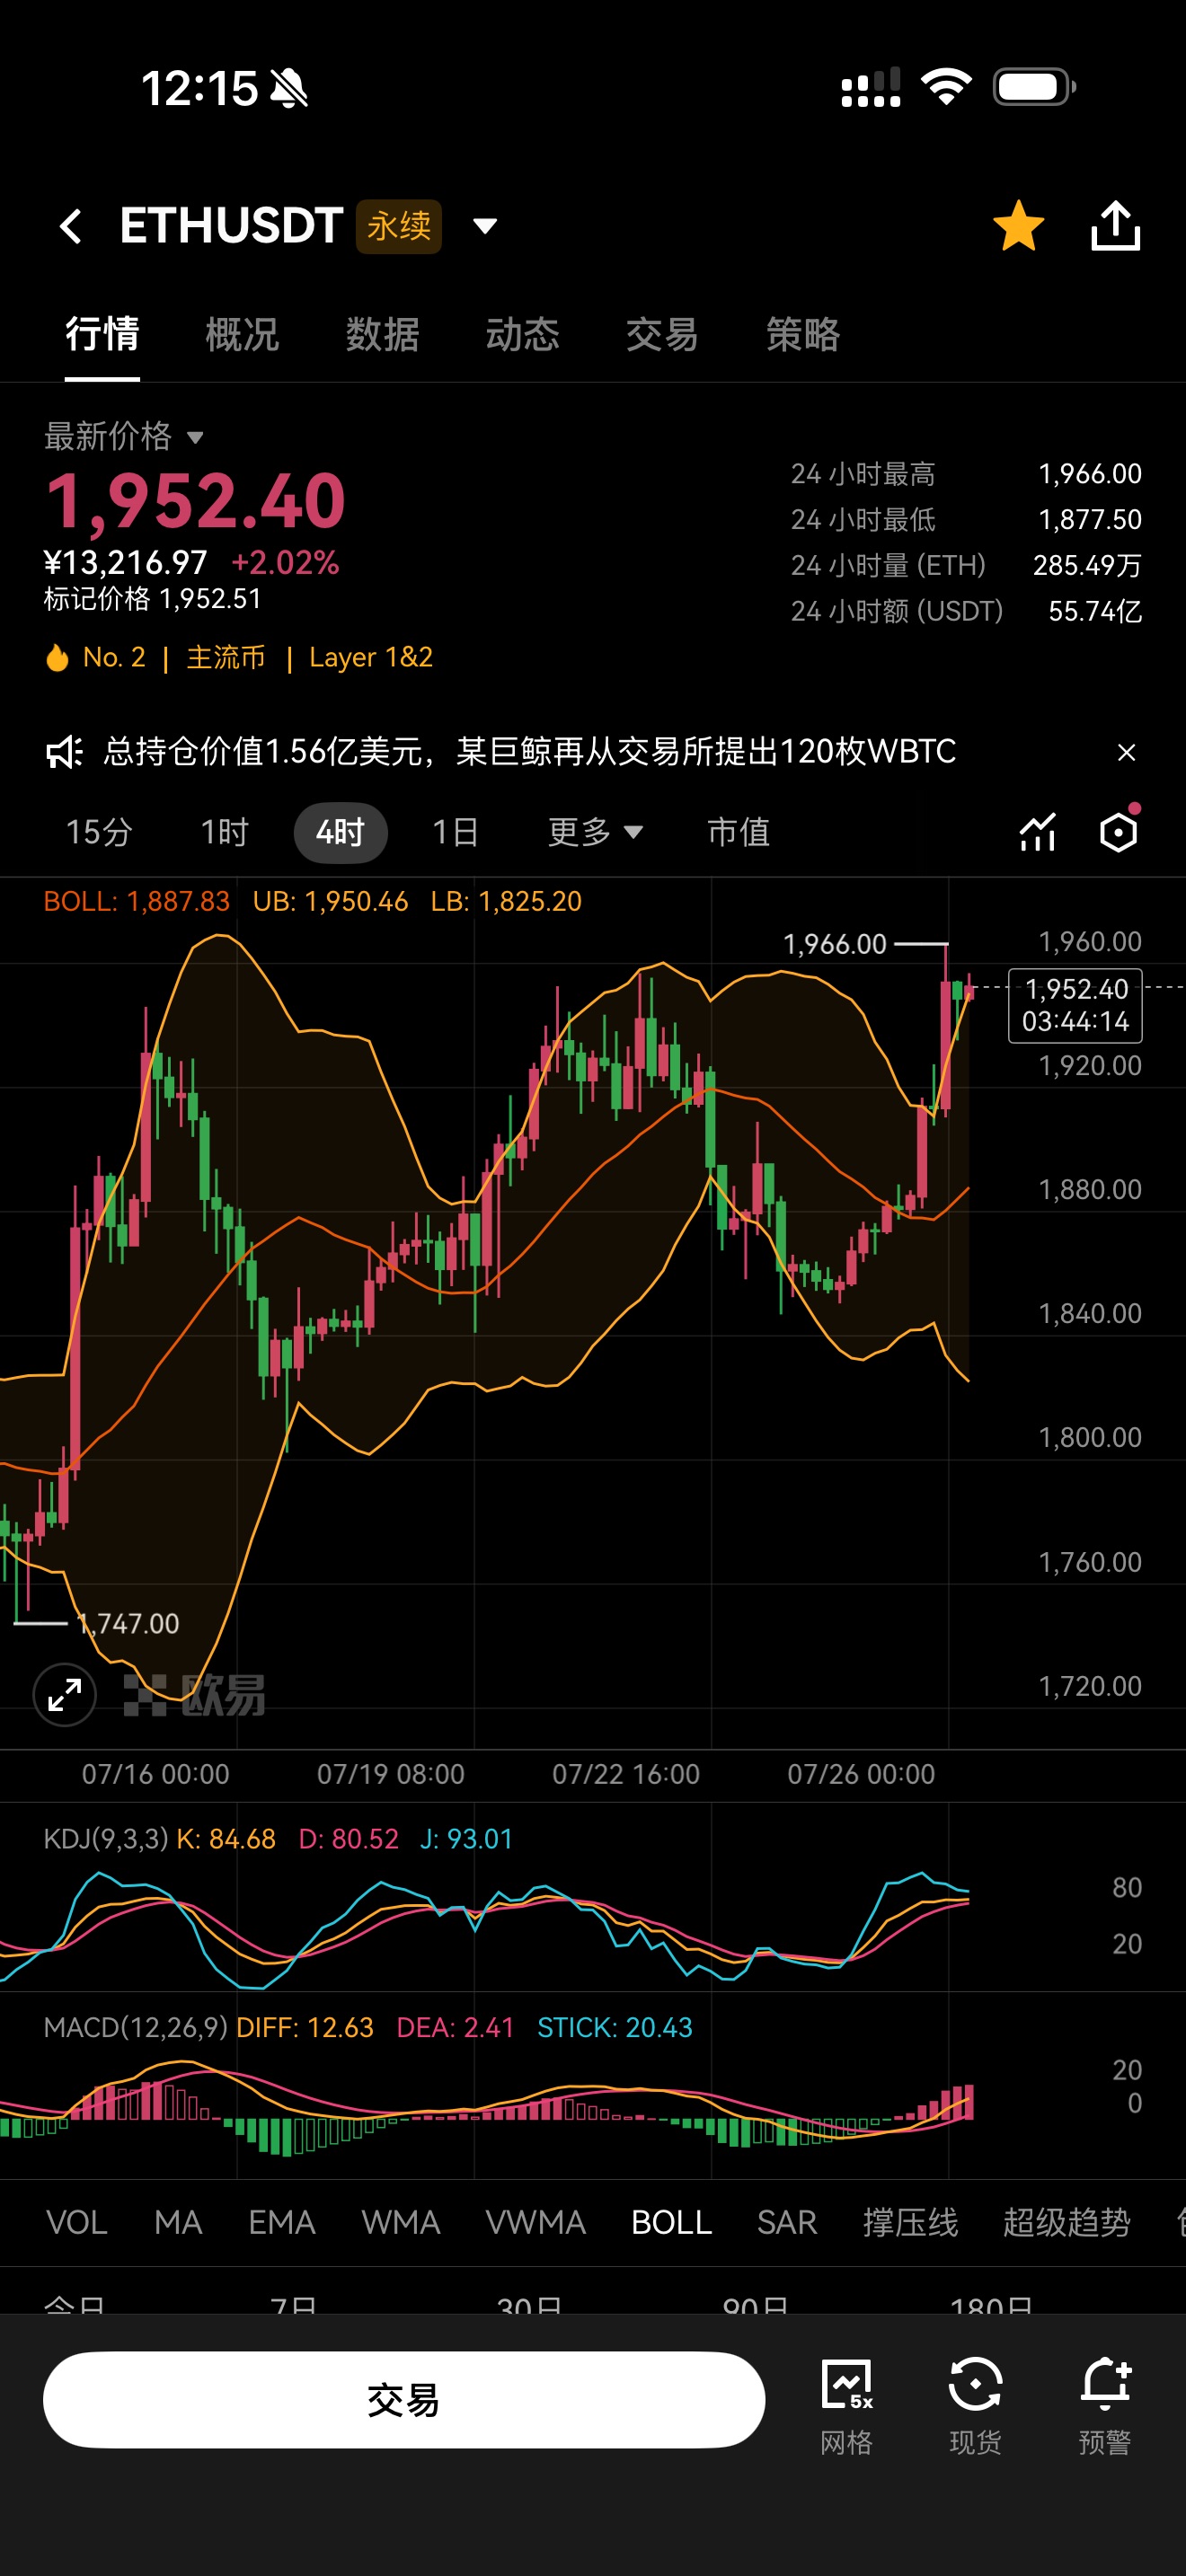
1. Overall range: 4-hour Bollinger channel middle line 1887, upper band 1950, lower band 1825, current price 1952. It has slightly broken through the upper band position.
2. K-line trend: Previously, it experienced a deep pullback to around 1840, followed by a series of bullish candles rebounding, peaking at 1966, with a rapid rise producing a large bullish candle. The price stands above all the Bollinger band tracks, indicating a short-term strong upward structure.
3. Pattern characteristics: The rebound after the decline is very strong, with sufficient bull accumulation at low levels. Short-term bullish momentum is released intensively, but after the price breaks through the upper band, there is a technical demand for short-term overbought corrections.
2. Supporting indicator signal interpretation
1. KDJ indicator: K-value 84.68, D-value 80.52, J-value 93.01, all three lines have entered the overbought range above 80, with the J line approaching a hundred-point high, indicating that short-term bullish sentiment is overspent, with obvious overbought signals and a need for technical correction.
2. MACD indicator: DIFF 12.63, DEA 2.41, red and green bars continue to extend, both lines are diverging upwards. The medium-term rebound trend structure is intact, and the long-term bullish repair logic is not damaged; only short-term overheating is present.
3. Key support and resistance division
Pressure zone
1. Short-term strong resistance: 1966, the daily high point of this round of rebound, also the pressure point for this rise.
2. Medium-term resistance: The key dividing line between bulls and bears at 2000.
Support zone
1. Short-term first support: Upper Bollinger band 1930 became short-term support after breaking through.
2. Core support: Middle Bollinger band 1880 is the core dividing line for this rebound, as well as the bulls and bears dividing line for this rebound. 3. Strong support: Lower Bollinger band 1840 is the low point range of this round of correction.
4. Comprehensive market summary
After the medium-term level decline, the repair rebound trend is complete, with bullish funds continuously entering to drive prices significantly higher; however, all short-term indicators on the 4-hour cycle have entered a seriously overbought state, and prices have moved away from the reasonable range of the Bollinger band.
There are two scenarios for the future market:
1. Short-term bears first retreat to digest overbought sentiment at support levels of 1930/1880, then choose a secondary upward direction;
2. Bullish sentiment continues to erupt, directly breaking through the high point of 1966, impacting the pressure at upper levels.
Overall, the market shows a complete medium-term rebound, with short-term overheating awaiting repair. As time passes, all indicator data will fluctuate; please use real-time data as a reference!
Official WeChat Account - Bitcoin Big Bear X
(Note: 📣 Due to the limitations of public platform information timeliness and depth, the market changes rapidly. Key turning points, precise operation strategies, sudden risk notifications, and other content need to be synchronized promptly on the official account. Here you can obtain: real-time strategy push, in-depth analysis support, interactive Q&A, risk warnings and optimization suggestions for personal holdings. 🚨 Remember: The market always rewards those who act faster and have more accurate information! Be a winner among the minority.)

免责声明:本文章仅代表作者个人观点,不代表本平台的立场和观点。本文章仅供信息分享,不构成对任何人的任何投资建议。用户与作者之间的任何争议,与本平台无关。如网页中刊载的文章或图片涉及侵权,请提供相关的权利证明和身份证明发送邮件到support@aicoin.com,本平台相关工作人员将会进行核查。


