Cryptocurrency Academy: Can Ethereum (ETH) Break Through Pressure on July 28, Determining the Upper Limit of the Mid-Term Market? Latest Market Analysis Reference
The current price of Ethereum is 1940. Some friends mentioned that the stop-loss point given yesterday was too far. Different trading systems naturally have different methods of trading, but the essence of trading does not change. Especially in the cryptocurrency world, the essence of trading is trial and error. Start with small capital testing, and use a verified trading system to wait for market entry signals. Operate if conditions are met. After entering, set the stop-loss according to the system's requirements, bear losses when needed, move the stop-loss, exit when wrong, and hold when right. Through deliberate repeated training, probabilities and outcomes will emerge.
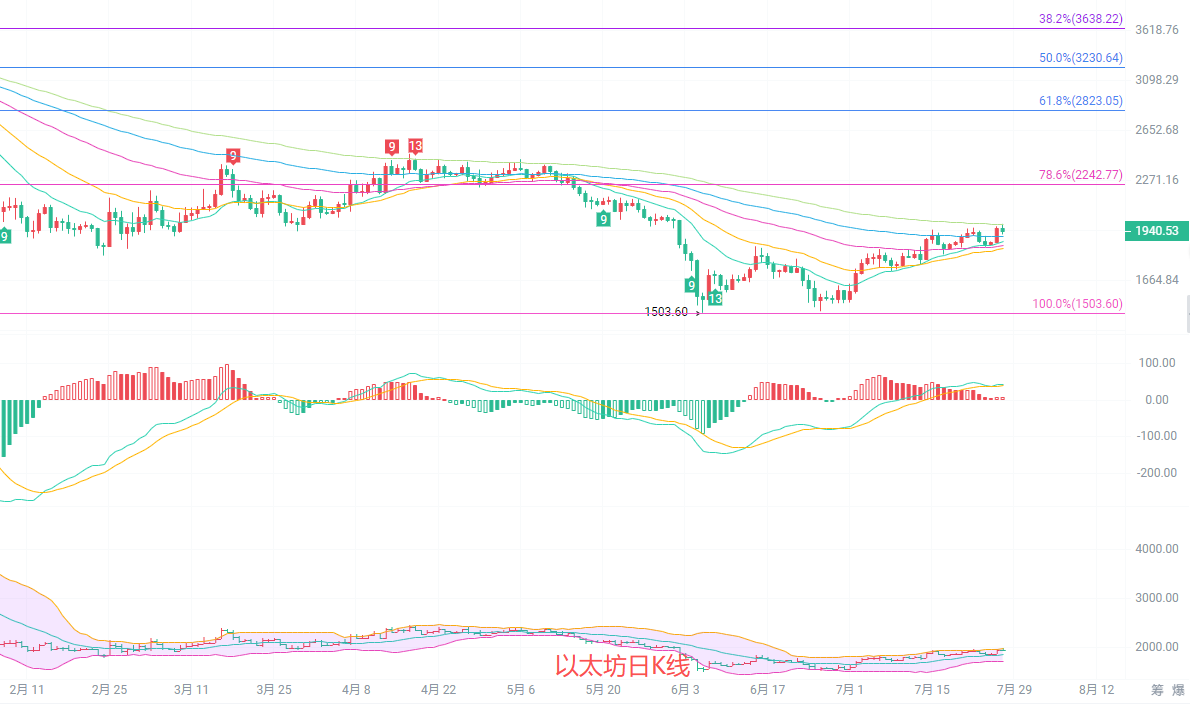
Old followers know that we have been positioning for a long time below 1600. What we are doing now is just short-term scattered orders, quickly entering and exiting to take advantage of small profits. The main focus is still on positioning for the upward trend. The daily Bollinger Band is running upwards, but the price is under pressure after touching the upper band, and the upward momentum is slowing down. The short-term moving averages continue to provide support, but the long-term moving averages above have strong resistance. The daily MACD red bars are continuously contracting, with a rising demand for short-term adjustments. Structurally, it still belongs to a bear market rebound. To reverse the longer-term downtrend, it must effectively hold above the 1982 pressure; the support to defend below is at 1853. Once it breaks, the short-term rebound trend will end.
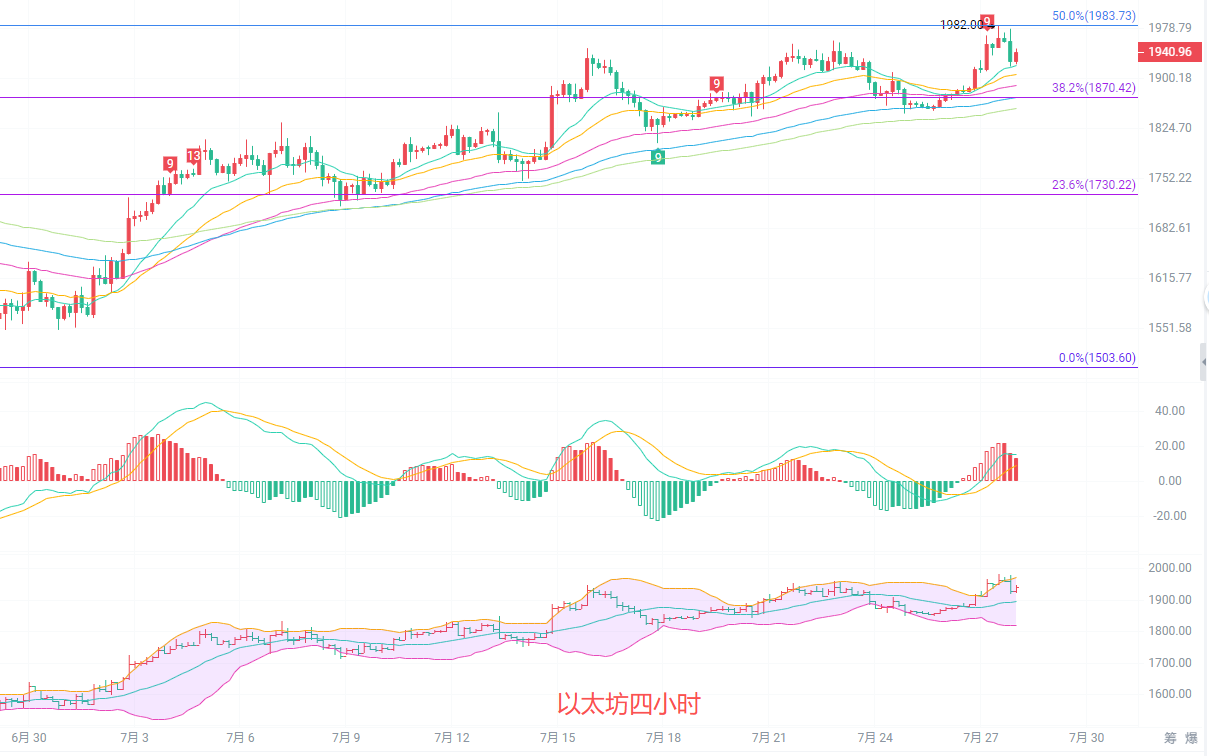
The four-hour K-line tested the Fibonacci resistance level of 1983 but was blocked and fell back. The price is still above the medium to long-term moving averages, and the mid-term bullish structure is temporarily intact. The Bollinger Band is narrowing, and market volatility is gradually diminishing, with a market change window approaching. The 4-hour MACD shows signs of a death cross, suggesting a higher probability of continued adjustments in the short term. Pay close attention to the effectiveness of the Fibonacci 38.2% support at 1870. If the support holds, the adjustment may end, and it is likely to test higher again; if the support is broken by bears, the market will further retrace towards the 1730 line.
Short-term reference:
If the lower range of 1880 to 1840 does not break, it will go up, stop-loss at 1800, target looking at 1950 to 1980.
If the upper range of 1980 to 2020 does not break, it will go down, stop-loss at 2050, target looking at 1930 to 1890.
The specific operations are based on real-time market data. For more detailed information, please consult the author. The article may be published with a delay, so it is advised for reference only and risks are to be borne by the reader.

Warm Reminder: The above content is solely created by the author of the public account. The advertisements at the end of the article and in the comment section are unrelated to the author. Please discern carefully. Thank you for reading.
免责声明:本文章仅代表作者个人观点,不代表本平台的立场和观点。本文章仅供信息分享,不构成对任何人的任何投资建议。用户与作者之间的任何争议,与本平台无关。如网页中刊载的文章或图片涉及侵权,请提供相关的权利证明和身份证明发送邮件到support@aicoin.com,本平台相关工作人员将会进行核查。


