Cryptocurrency Expert: On July 28, Bitcoin (BTC) rebound momentum fades, and the risk of a decline in Bitcoin cannot be ignored? Analysis of the latest market conditions and operational suggestions.
Currently, Bitcoin is at 64800, and the market has returned to yesterday's position after some fluctuations. Yesterday, a fellow trader commented in the section that they missed the long-term layout opportunities at 59000 and 60000, asking how long until the next chance. Most losses come from impatient traders promoting the market. It is not necessary to participate in every market move, just seize opportunities with high cost-effectiveness. Always prioritize risk over profit; market opportunities are endless, and there is no need to rush into making moves. Stay calm and wait for the market to show a clear structure, and at that time, do not hesitate.
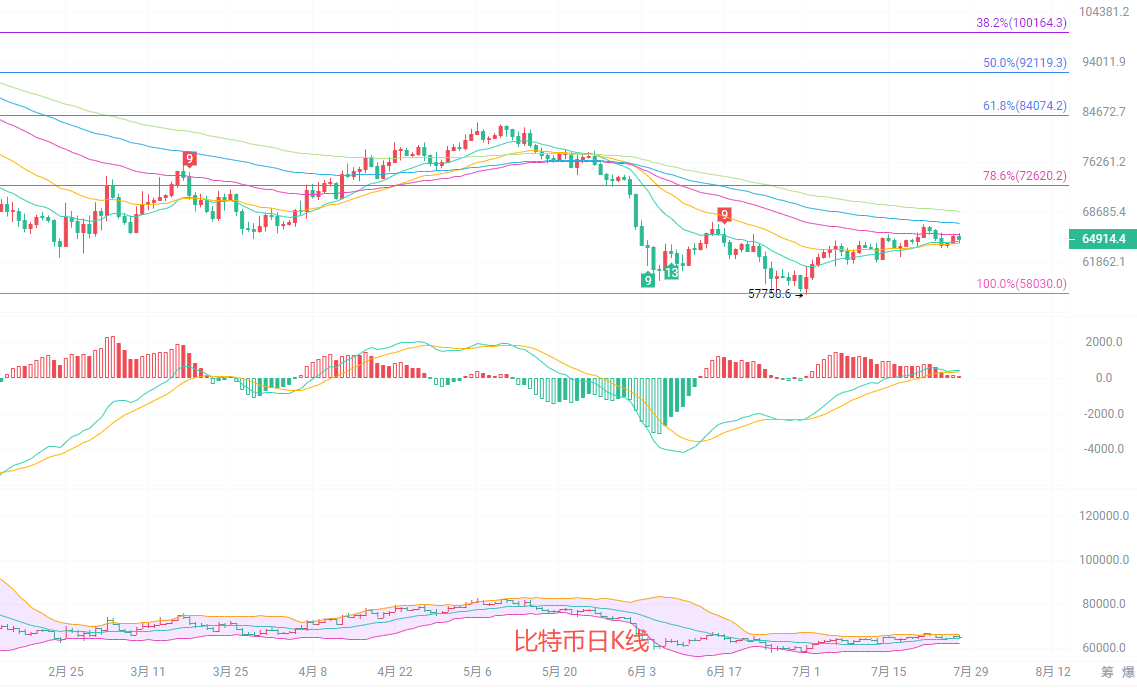
The daily K-line is oscillating near the EMA15 and EMA30 moving averages, with short-term moving averages providing support, while the EMA60 moving average at 65541 is a pressure point above. The middle track of the Bollinger Band is at 64382, and the current price is running close to this middle track, indicating fierce competition between bulls and bears. The MACD indicator shows a continuous contraction of red bars, with bullish momentum gradually weakening. The previous low of 57758 constitutes an important bottom in this round, with a key pressure point above at 67262. The daily chart remains in a range consolidation after a low rebound, and without a significant breakthrough of pressure, it is difficult to unlock a new round of upward space. If the moving average support is lost, it will retest the support range below.
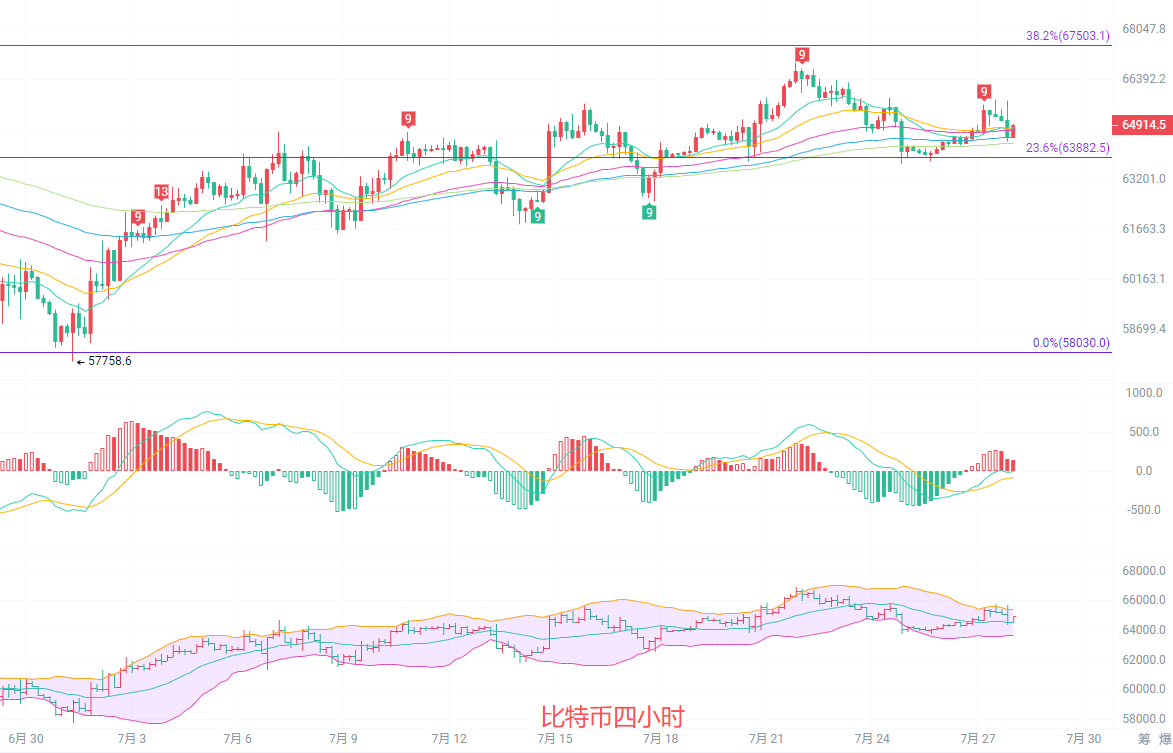
The four-hour K-line has entered a narrow horizontal consolidation range. The short-term EMA moving averages are intertwined, indicating that short-term fluctuations will gradually narrow, and a change window is approaching. The Bollinger channel is starting to close, with the upper track at 65343 and the lower track at 63655. The market is likely to fluctuate back and forth within this range in the short term. The 4-hour MACD fast line is slowly turning downward, with red bars continuously shortening, indicating that short-term bullish strength has weakened. The primary pressure above is at 65388, and the core support below is at 63882. There is no clear trend in the short term, and it is preferable to treat it according to range oscillation thoughts and wait for direction selection.
Short-term reference:
If it does not break below 64000 to 63500, aim for upward movement, with stop-loss at 63000, targeting 65500 to 66500.
If it does not break above 67000 to 67500, aim for downward movement, with stop-loss at 68000, targeting 65500 to 64500.
Specific operations should primarily rely on real-time market data. For more information, please contact the author. There may be delays in article publication; suggestions are for reference only, and risks are borne by the reader.

Friendly reminder: The above content is solely created by the author of the official account. Advertisements at the end of the article and in the comment section are not related to the author. Please discern carefully. Thank you for reading.
免责声明:本文章仅代表作者个人观点,不代表本平台的立场和观点。本文章仅供信息分享,不构成对任何人的任何投资建议。用户与作者之间的任何争议,与本平台无关。如网页中刊载的文章或图片涉及侵权,请提供相关的权利证明和身份证明发送邮件到support@aicoin.com,本平台相关工作人员将会进行核查。


