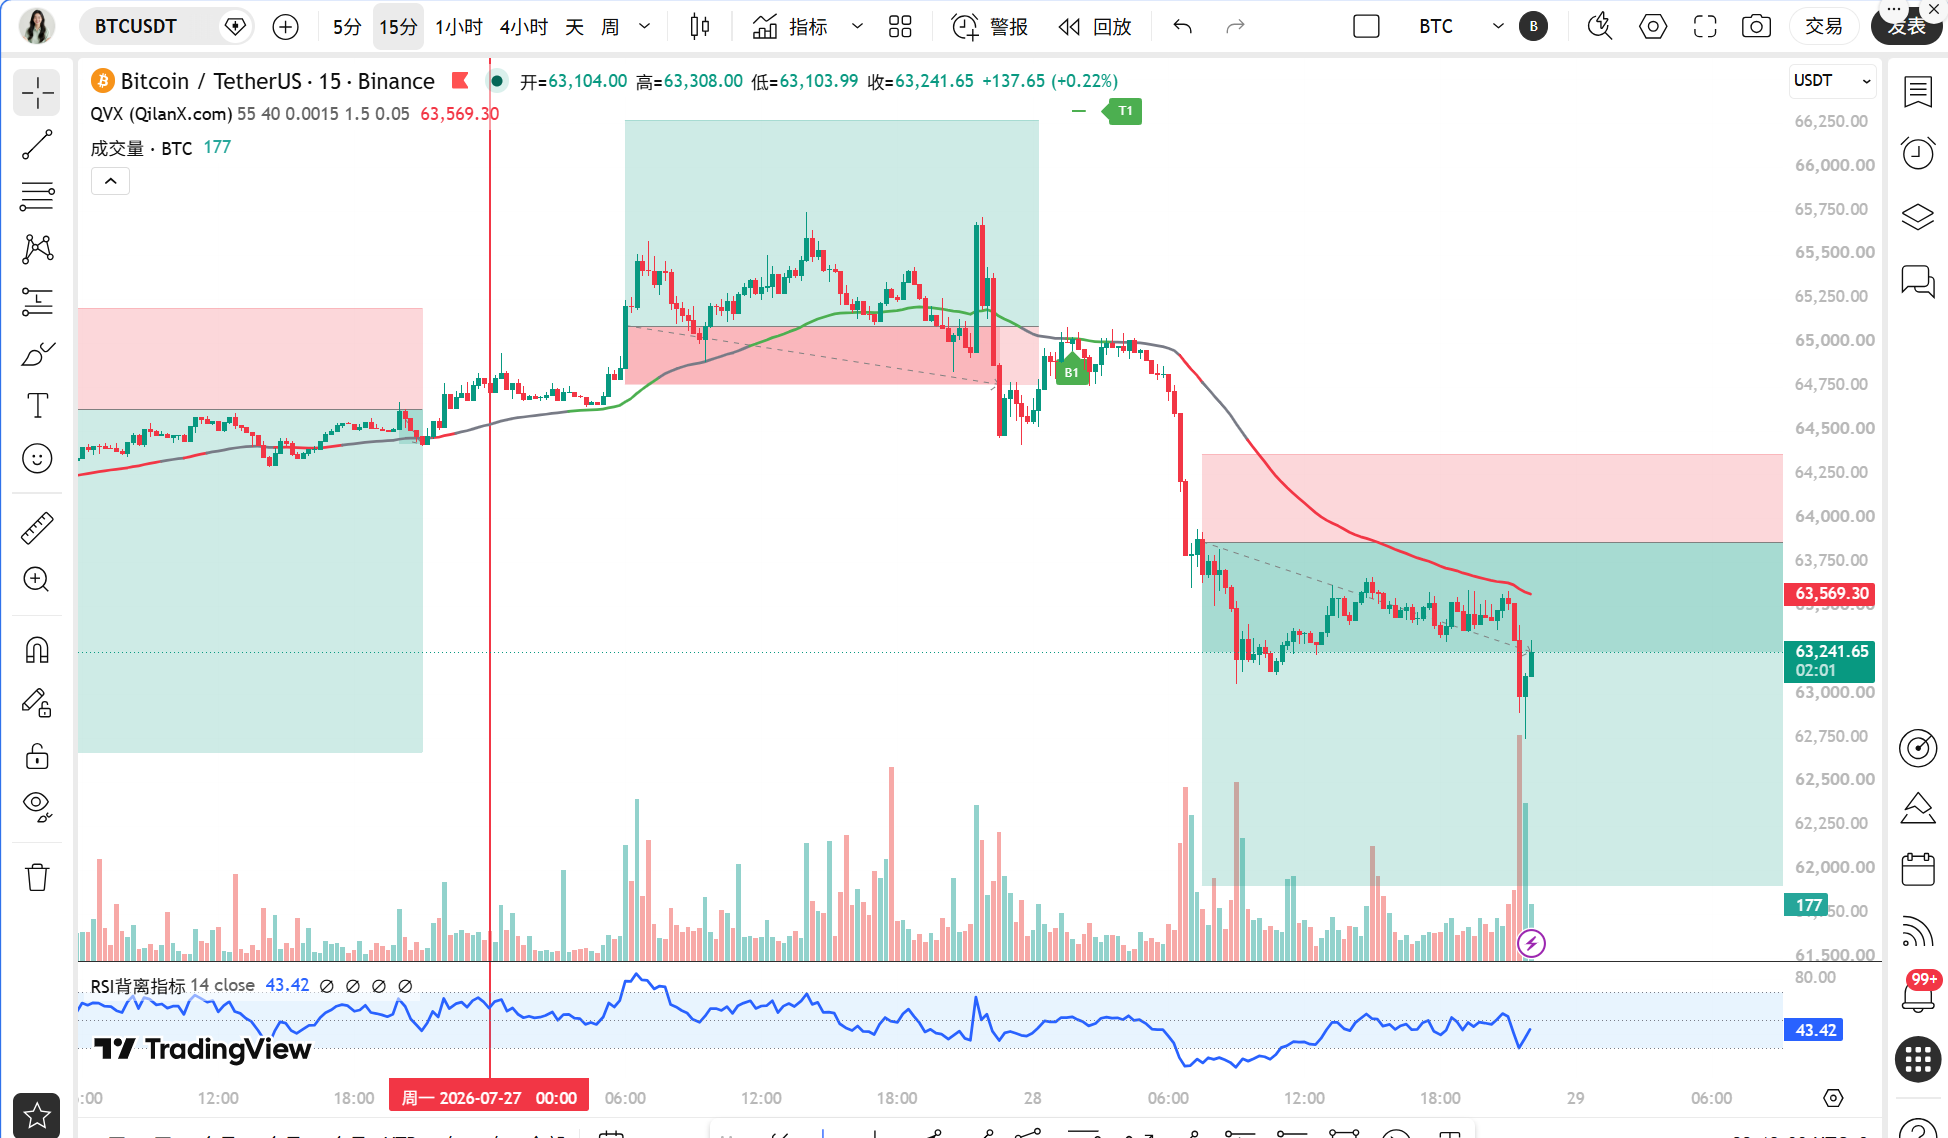
Dear teammates, I am Qinglan. The market conditions tonight really make one sweat. The news of the breakthrough in China's lithography technology has triggered a global surge in chip stocks, leading to a melt-down in the South Korean stock market. The panic spread like a virus to the cryptocurrency market. At 22:13, the price of BTC was quoted at 63228 USDT, with a drop of 3.19% over the last 24 hours, and the fear and greed index has fallen to 29, bringing numerous laments in the market. But Qinglan wants to remind everyone that opportunities are often hidden in panic, the key is whether you can understand the signals.
Current Price and Time
It is now July 28th, 22:13, with BTC priced at 63228 USDT. This position is quite delicate, neither an absolute bottom nor the edge of a cliff, but rather the focal point of the long-short battle.
Multi-Period Status Overview
First, looking at the daily line, MA5 is at 64179, MA10 is at 64864, MA30 is at 63597, and the price of 63228 has already fallen below all short-term moving averages, with the MACD bar at -120.10 and RSI at 40.93, indicating a bearish trend. The 4-hour chart is even clearer, with MA5 at 63456, MA10 at 64242, and MA30 at 64475, where the price is being suppressed by the moving averages; MACD bar at -154.85 shows that bearish momentum is still being released. The 1-hour EMA55 is at 64157, with the price at 63228 far below, RSI at 42.66, and although the MACD bar is only at 5.68, both DIF and DEA are negative, indicating weak rebound strength. On the 15-minute level, MA5 is at 63229, MA10 is at 63348, MA30 is at 63430, with the MACD bar at -29.89 and RSI at 38.50, still in the process of exploring the bottom in the short term.
TPV Signal Verification
According to the Qinglan TPV system, the current 1-hour EMA55 at 64157 has a price of 63228, and the closing price of the last 8 K-lines is below EMA55 with zero crossovers, fully conforming to the bearish trend area. In the short-selling conditions, the pressure on the price below EMA55 has been met, but a confirmation of encountering resistance and weakness in rebound is necessary. From the pattern perspective, the 1-hour K-line has been continually closing lower, without long lower shadows or bottom formations. Although the MACD bar has risen from -361.92 to -356.24, the amplitude is too small, and RSI at 42.66 remains below 50, indicating insufficient rebound momentum. The 4-hour MACD bar at -154.85, while shorter than the previous -203.16, still shows strong bearish momentum. Overall, the bearish trend is clear, but the shortening of the 4-hour MACD bar is a stabilization signal needing caution for a potential short-term rebound.
On-Chain/Funding Situation
The on-chain data is not optimistic. Long-term holders are flooding onto trading platforms, with the holding ratio approaching historical peaks, which usually indicates selling pressure. BlackRock transferred 158 BTC to Coinbase Prime; although the amount is not large, the direction is unclear and may be preparing for liquidity. The good news is that Morgan Stanley has launched Ethereum and Solana spot ETPs, with traditional financial institutions beginning to position themselves, which is beneficial for ETH and SOL, but offers limited direct support for BTC. The fear and greed index at 29 indicates extreme fear; historically, this position is often close to a phase bottom, but time is needed for verification.
Key Defense Positions
The first resistance level above is at the 1-hour EMA55 at 64157, which is the dividing line between long and short; stable breakthrough is needed to turn bullish. The second resistance level is at the 4-hour MA10 at 64242, with the third resistance level at the daily MA5 at 64179. The first support level below is at the round number 63000, with the second support level at 62000 and the third support level at 60000. If 63000 is lost, the bearish trend will accelerate, with 60000 being the psychological defense line.
Trading Idea
Direction: Bearish trend, but with the 4-hour MACD bar shortening, there may be short-term fluctuations or rebounds, so it is not recommended to chase shorts. If you want to short, wait for a rebound to the resistance level before entering.
Entry Conditions: If the price rebounds to the area of 64000-64157, showing a long upper shadow or top formation, and the MACD bar starts to shorten, a light short position can be taken.
Stop-Loss Level: 64500, if this position is broken, it indicates that the bearish trend may reverse.
Target Levels: First target 63000, second target 62000, third target 60000.
If the price directly breaks below 63000, do not chase the shorts; wait for stabilization signals before acting. If there is a long lower shadow or bottom formation near 63000, and the MACD bar starts to shorten, a light long position can be tried, with a stop-loss set at 62500 and target 64000.
Risk Warning
The current market is dominated by external panic emotions, and volatility may intensify; any trading should strictly control position sizes and avoid holding positions unnecessarily.
Follow Qinglan Crypto Classroom for more trading opportunities! Visit the official website at www.qinglan.org
📊 Qinglan TPV Trading Strategy Backtest Reference
🕒 Last Backtest Time 07-28 07:00:01
Total Analysis: 3258 Backtests: 2468 Accuracy Rate: 77.7% (1917/2468)
免责声明:本文章仅代表作者个人观点,不代表本平台的立场和观点。本文章仅供信息分享,不构成对任何人的任何投资建议。用户与作者之间的任何争议,与本平台无关。如网页中刊载的文章或图片涉及侵权,请提供相关的权利证明和身份证明发送邮件到support@aicoin.com,本平台相关工作人员将会进行核查。


