Cryptocurrency Expert: 7.29 Bitcoin (BTC) Cycle Conceals Downward Risks, Break of Support Will Initiate a New Cycle? Latest Market Analysis and Trading Suggestions Explained
The current price of Bitcoin is 63800, and it has been grinding within a range for a long time. Some traders can't help but trade frequently, only to find that they have not made a profit, while transaction fees and losses keep accumulating. Before the market establishes a clear direction, blindly chasing orders is a major trading taboo. Currently, the forces of bulls and bears are in a temporary balance, and we should not fantasize about a one-sided market coming immediately. After heading north, we need to patiently wait for signs of breaking key support and resistance. Trading is not about the frequency of orders but the precise control of timing. If you do not understand the market, it is better to stay on the sidelines, preserve your capital, and seize the real trend opportunities that have room for growth later.
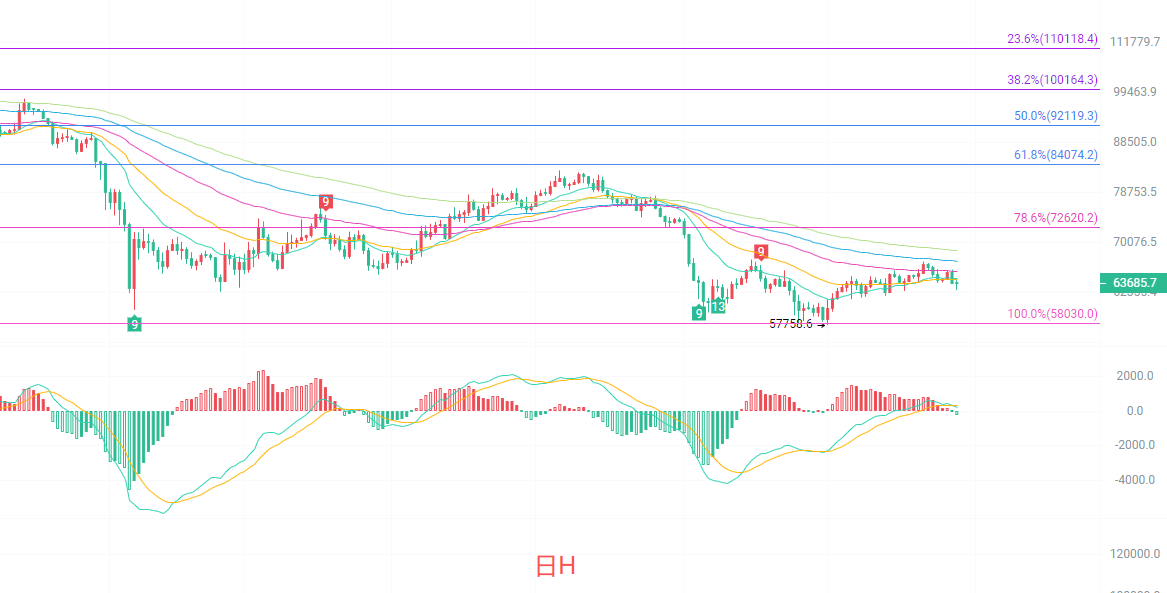
The daily candlestick chart maintains an overall low-level repair trend, currently under pressure below the EMA15 and EMA30 moving averages. The mid-term moving averages continue to align downward, and the larger bearish pattern has yet to be reversed. The Bollinger Bands are continuously narrowing, compressing the market volatility range, and the MACD indicator shows the DIF below the DEA, with limited bullish momentum. The core resistance is around 64500; if it cannot effectively hold, the rebound space will be difficult to open. The primary support is at 63000, with a key defensive position at 62495, the lower Bollinger Band. Until the daily chart completes a moving average reversal, it is still defined as a consolidation repair after a decline, and it is not advisable to be overly bullish.
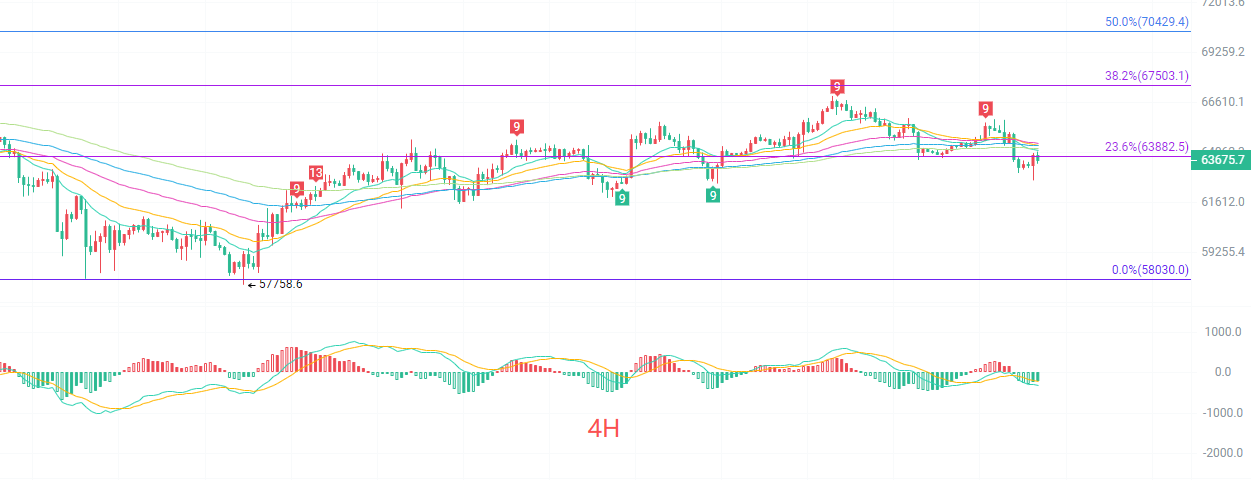
The four-hour candlestick chart is below the Fibonacci 23.6% level. There have been multiple previous attempts to break through 63882 but faced pressure and retreated, resulting in a short-term decrease in bullish attack momentum. Multiple EMA moving averages are starting to turn downward from a confluence, and prices are gradually moving away from the moving average support. The 4-hour MACD red bars are continuously shrinking, and there is a sign of a death cross forming between the fast and slow lines, with the mid-Bollinger Band at 64377 constituting strong resistance. Recently, the market's high points are gradually lowering, and the center of oscillation is slowly sinking, indicating a short-term weak consolidation. Only by reclaiming the 63882 resistance level can we alleviate the short-term downward risk; if it falls below the 63400 support, further testing of the lower range will occur, and short-term operations need to be more cautious.
Short-term Reference:
Buy if the price holds between 63500 and 63000, stop loss at 62500, target at 64500 to 65500.
Sell if the price fails to hold between 65500 and 66000, stop loss at 67000, target at 64500 to 63500.
Specific operations are based on real-time data from the market. For more detailed information, you can consult the author. There may be delays in the publication of articles; suggestions are for reference only, and risks are borne by yourself.

Reminder: The above content is solely created by the author of the public account. Advertisements at the end of the article and in the comments section are unrelated to the author; please identify them carefully. Thank you for reading.
免责声明:本文章仅代表作者个人观点,不代表本平台的立场和观点。本文章仅供信息分享,不构成对任何人的任何投资建议。用户与作者之间的任何争议,与本平台无关。如网页中刊载的文章或图片涉及侵权,请提供相关的权利证明和身份证明发送邮件到support@aicoin.com,本平台相关工作人员将会进行核查。


