Cryptocurrency Scholar: On July 31, Ethereum (ETH) fluctuates and grinds, hiding a potential shift. Distinguishing between bullish and bearish critical points is crucial? Latest market analysis reference
Ethereum's current price is 1920. After a significant drop, it continues to grind and rebound from the bottom. Every small rise causes panic to take profits, while any slight pullback raises fears of a new round of decline. The current market lacks a unilateral big trend, and the back-and-forth fluctuations easily result in losses; chasing gains and cutting losses has become the norm for most people. Many only focus on short-term ups and downs, neglecting the support and resistance of the larger cycle structure, blindly opening positions, continuously depleting their capital. The market does not conform to everyone's expectations. To survive in a fluctuating market, one must wait for certain opportunities, strictly plan profit and loss ratios, and not let short-term fluctuations disrupt their trading rhythm.
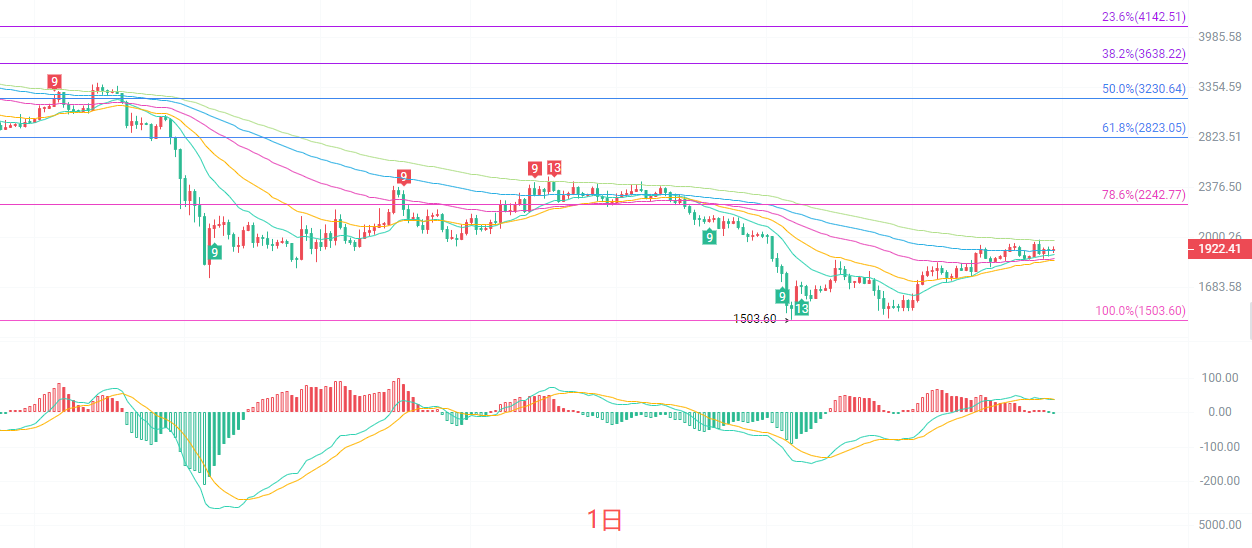
The daily K-line Fibonacci 78.6% resistance level near 2242 remains a key resistance above. The price is currently stabilizing around the Bollinger middle band at 1879, with multiple EMA moving averages gradually turning upward, forming bottom support. The MACD remains slightly oscillating above the zero line, with bullish momentum gently released, and there is currently no strong upward momentum. The daily level is in the repair rebound phase after a large drop, with primary resistance around 1980 and core support at 1870; the range fluctuation pattern is difficult to break quickly in the short term.
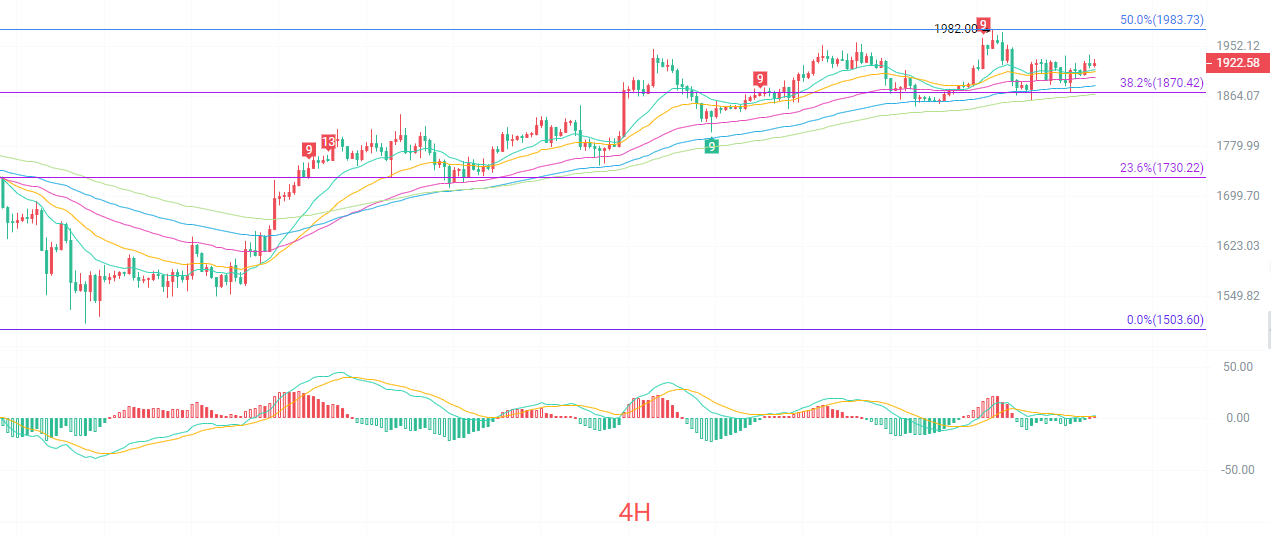
The four-hour K-line is in the middle of the Bollinger channel, with the upper band at 1945 and the lower band at 1870 forming a short-term oscillation range. The Fibonacci 38.2% position at 1870 is an important support level, while the 50% resistance is at 1983. The short-cycle EMA moving averages are entangled and flattening, indicating a seesawing market. The MACD indicator shows DIF and DEA are sticking together, with balanced bullish and bearish momentum, lacking direction in the short term. The price has tested the 1982 high point multiple times and pulled back under pressure. For bulls to open upward space, they must effectively hold the 1983 resistance level; otherwise, they will continue to oscillate within the range.
Short-term reference:
If the price does not break below 1880 to 1840, it may rise, with a stop-loss at 1800 and a target of 1950 to 1980.
If the price does not break above 1980 to 2020, it may drop, with a stop-loss at 2050 and a target of 1930 to 1890.
Specific operations should be based on real-time market data. For more details, please consult the author. The publication of this article may be delayed; it is recommended for reference only and the risk is to be borne by yourself.

Warm reminder: The above content is solely created by the author on Weibo. Advertising at the end of the article and in the comments section is unrelated to the author. Please be cautious in distinguishing them. Thank you for reading.
免责声明:本文章仅代表作者个人观点,不代表本平台的立场和观点。本文章仅供信息分享,不构成对任何人的任何投资建议。用户与作者之间的任何争议,与本平台无关。如网页中刊载的文章或图片涉及侵权,请提供相关的权利证明和身份证明发送邮件到support@aicoin.com,本平台相关工作人员将会进行核查。