The Asian stock market went completely crazy today. The Nikkei 225 surged 3.57% to break through 64000 points, Softbank skyrocketed by 14%, and the Korean stock market violently climbed 13%, with SK Hynix and Samsung both seeing increases of over 20%. On the surface, risk sentiment has fully recovered, and the cryptocurrency market seems set to benefit as well. However, on the other hand, Strategy reported a loss of 8.2 billion dollars in the second quarter, with Bitcoin holdings becoming the biggest drag; institutions not only stopped buying but also fell into unrealized losses. Coinbase's performance was below expectations, dropping 5% after hours, and the probability of a Fed rate hike in September rose to 61.4%. On one side, the stock market is in a frenzy; on the other, the crypto market is quiet. What is Bitcoin waiting for?
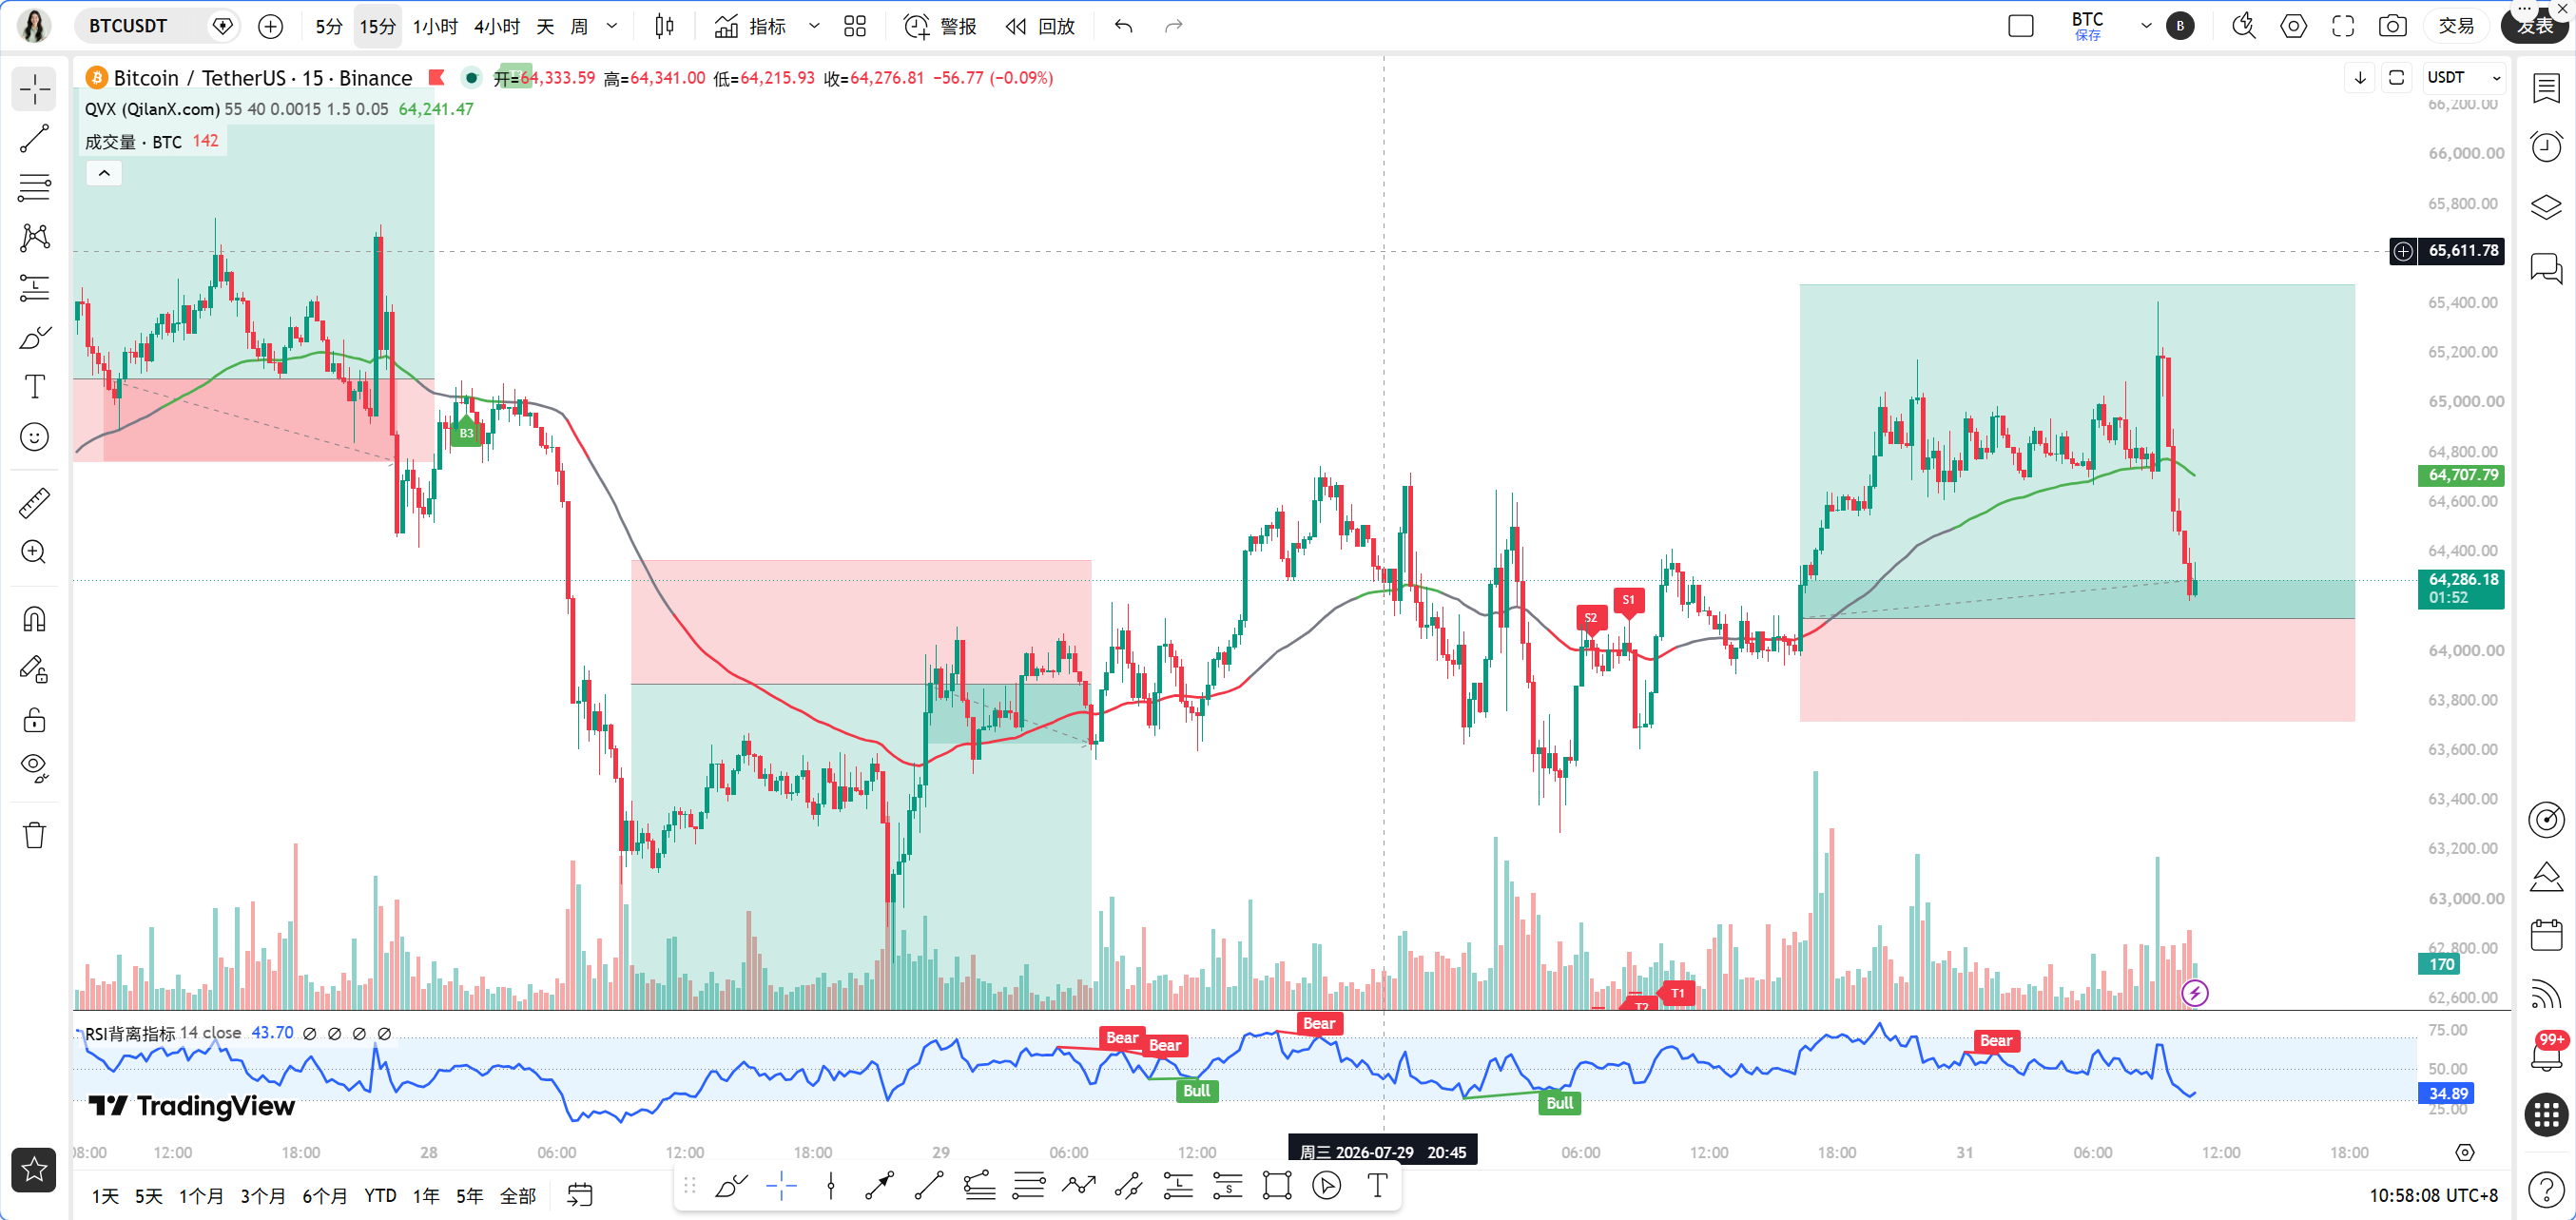
Currently, the BTC price is at 64294 USDT, with a 24-hour decline of only 0.12%, essentially hovering sideways. This position is quite delicate; it neither followed the Asian stock market rise nor fell sharply due to institutional bearishness, indicating that the market is waiting for a directional catalyst.
First, let's look at the daily level. The MACD histogram is at -86.18, with the DIF at 171.24, and the DEA at 257.42; the fast line is below the slow line, and bearish momentum is still being released. The RSI is at 51.87, neutral but leaning weak. MA5 is at 64145, MA30 at 64091, and the price is barely above the short-term moving averages, but MA10 at 64585 poses direct pressure. The daily chart overall shows a fluctuating pattern without a clear trend.
The 4-hour level is somewhat more optimistic. The MACD histogram is at 91.91, with the DIF crossing above the DEA, forming a golden cross; the RSI is at 54.80, indicating bullish momentum remains. MA5 is at 64678, MA10 at 64311, MA30 at 64354, and the moving averages are starting to converge, indicating that the 4-hour level is brewing for a change. If the price can stabilize above 64600, the 4-hour level is expected to rally further.
The 1-hour level is a bit tangled. The MACD histogram is at -59.32, with the DIF at 91.61 and the DEA at 150.93; the fast line has crossed below the slow line, indicating short-term bearish momentum. The RSI is at 30.60, close to the oversold area. EMA55 is at 64408, and the current price of 64294 is just below EMA55. MA5 is at 64642, MA10 at 64710, and MA30 at 64456, with short-term moving averages in a bearish arrangement, but the distances are not large.
The 15-minute level is weaker. The MACD histogram is at -75.58, with the DIF at -111.94 and the DEA at -36.36, showing sustained bearish momentum. The RSI is at 32.36, also close to oversold. MA5 is at 64385, MA10 at 64664, MA30 at 64775, with all short-term moving averages pressing down.
Let's verify using the Qinglan TPV system. The 1-hour EMA55 is at 64408, with the current price at 64294, below EMA55. In the past 8 1-hour candles, the closing price exceeded EMA55 7 times, and the crossover occurred once. According to system rules, this data does not meet the fluctuating threshold, and theoretically, it may be in a unilateral trend. However, note that the current price is only 0.18% away from EMA55, which indicates tight line fluctuations, thus increasing the probability of oscillation. There is a conflicting signal here that needs to be handled with caution.
In terms of short-selling conditions, although the price is below EMA55, the condition for two consecutive 1-hour candle closing prices below EMA55 has not yet been fully satisfied. In terms of patterns, both the 15-minute and 1-hour levels of RSI are close to 30, and the downward momentum has weakened, without any clear signals of rebound weakness. For long conditions, the price has not stabilized above EMA55, so the first condition is not met. Therefore, the TPV system currently gives a wait-and-see signal and does not actively open positions.
On-chain data shows a fear and greed index of 25, falling in the extreme fear range. Historically, this position often corresponds to stage-bottom areas, but extreme fear can also last for a long time. BTC market dominance is at 56.49%, indicating that funds are still rotating within Bitcoin, with no large-scale outflows to altcoins. Grayscale has deposited 9,453 ETH into Coinbase Prime, worth 18.14 million dollars, which is a potential selling pressure signal to watch out for.
Looking at key attack and defense positions, the first resistance is in the range of 64600 to 64700, which is the convergence area of 1-hour MA5 and MA10, as well as the position of 4-hour MA5. The second resistance is at the round number of 65000, which is also a psychological barrier and near the daily MA10. The first support below is at the round number of 64000, and the second support is around 63500, which is the support area for daily MA5 and MA30. If it breaks below 63500, the daily bearish trend will open up completely.
In terms of trading ideas, the Qinglan TPV system currently gives a wait-and-see signal, but we can formulate two plans. The first plan is a breakout long strategy; if two consecutive 1-hour candles close above EMA55, that is, above 64408, while the MACD histogram shortens for two consecutive periods, a light long position can be tried. Entry reference is in the range of 64550 to 64600, with a stop loss set at 64150 and target levels at 65000 and 65500. The second plan is a breakdown short strategy; if the price breaks below 64000 and two consecutive 1-hour candles close below EMA55, while RSI rebounds from the oversold area and then turns down again, a short position can be taken accordingly. Entry reference is near 63950, with a stop loss at 64400 and target levels at 63500 and 63000. If the price fluctuates repeatedly in the 64000 to 64600 range, it is advisable to stay out and wait, without participating in this disorderly fluctuation.
In terms of risk warnings, the current macro news is intertwined with bullish and bearish signals, with the Asian stock market soaring alongside the Fed's rate hike expectations. Any sudden news could trigger violent fluctuations, and position sizes must be strictly controlled.
Follow the Qinglan crypto class to grasp more trading opportunities! Visit the official website at www.qinglan.org
📊 Qinglan TPV trading strategy backtesting reference
🕒 Last backtesting time 07-31 07:00:01
Total analysis: 3324 Backtests: 2538 Accuracy: 78.3% (1987/2538)
免责声明:本文章仅代表作者个人观点,不代表本平台的立场和观点。本文章仅供信息分享,不构成对任何人的任何投资建议。用户与作者之间的任何争议,与本平台无关。如网页中刊载的文章或图片涉及侵权,请提供相关的权利证明和身份证明发送邮件到support@aicoin.com,本平台相关工作人员将会进行核查。