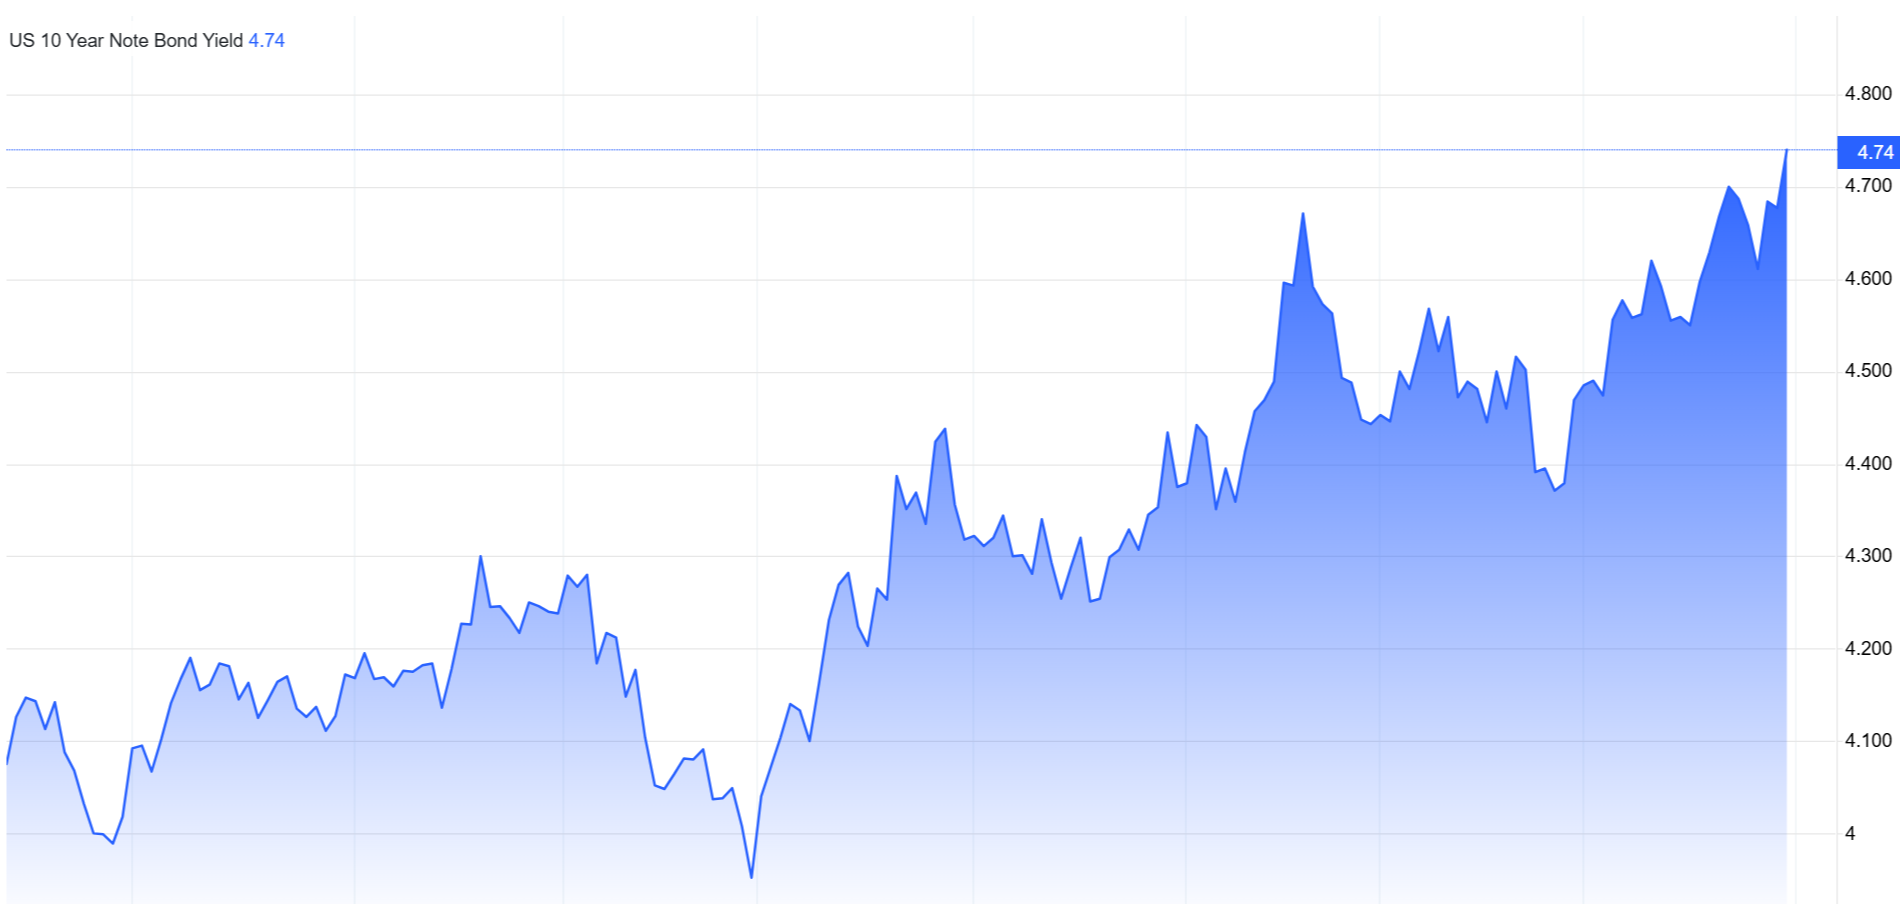
Good morning, teammates. This morning, when I opened the market, Bitcoin directly fell below $63,000, with a 24-hour decline of nearly 3%. Meanwhile, the probability of the Federal Reserve raising interest rates by 25 basis points in September soared to 67%, US Treasury yields reached a new high for the year, Coinbase's stock price plummeted by 12%, and cryptocurrency concept stocks collectively suffered heavy losses. This series of bearish news has caused market sentiment to plummet instantly, with the Fear and Greed Index at only 27, firmly in the territory of extreme fear. Interestingly, even in this atmosphere of panic, Zhibao Technology secured 2,380 Bitcoins through private financing, and BitMine significantly increased its holdings of Ethereum. One side faces macroeconomic headwinds, while on the other, institutional funds are moving quietly; this sense of rupture is a typical characteristic of market bottoms. Today, Sister Qinglan will use the TPV system to clarify the current bullish and bearish landscape.
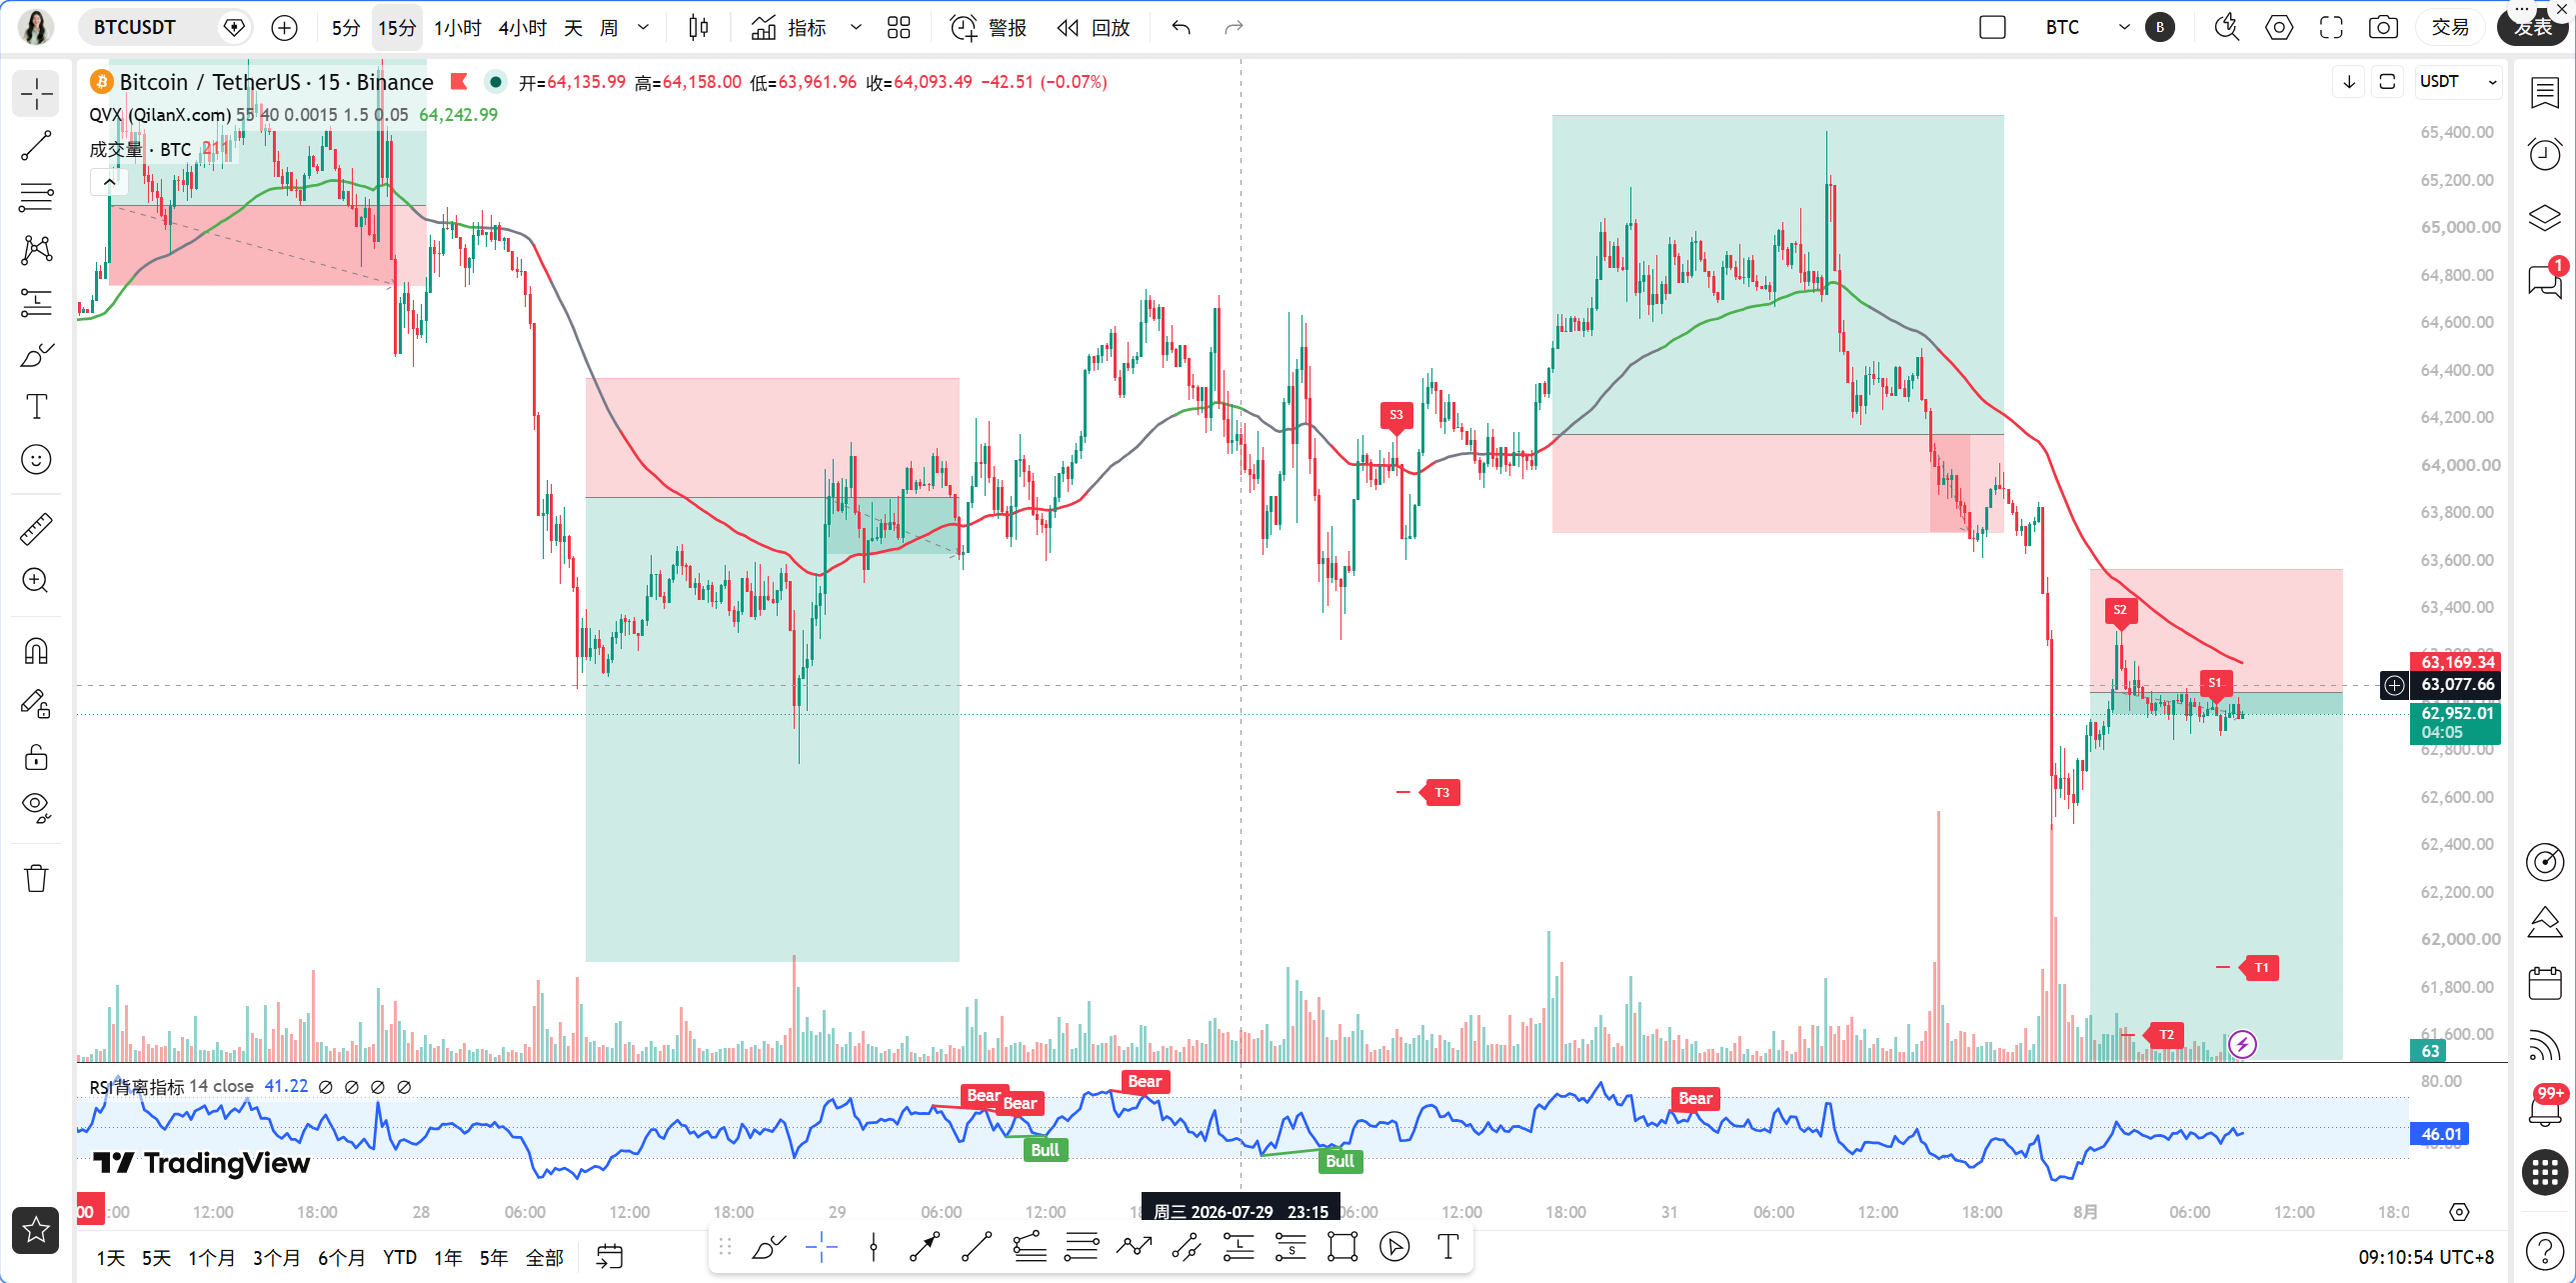
The current Bitcoin price is 62,971 USDT, timestamped at 9:17 AM on August 1. This position is very subtle, just below the psychological level of 63,000, with both bulls and bears repeatedly battling at this level. From a 24-hour perspective, Bitcoin has declined by 3.51%, and bearish momentum still dominates. However, it is worth noting that after the rapid decline, there was no continuous panic selling, indicating that there is buying support gradually entering the market.
First, look at the daily chart. The EMA55 is still at a high level, but the price has clearly deviated from it. The MACD histogram continues to expand to -223, and the RSI has retraced to 40.92, with the overall bearish trend remaining unchanged. The MA5 on the daily level stands at 63,707, MA10 at 64,130, and MA30 at 64,091, with all three moving averages exerting pressure above the price, forming a bearish arrangement. This suggests that from a medium to long-term perspective, any rebounds are merely corrections rather than reversals. Now looking at the 4-hour level, the MACD histogram's negative value has expanded to -149, with both DIF and DEA weakening, and the RSI at 42.46 remains bearish. However, the 4-hour MA5 has flattened, suggesting that short-term bearish momentum is weakening, requiring vigilance against oversold rebounds.
Turning to the 1-hour chart, there are notable changes. The MACD has just formed a golden cross on the 1-hour chart, with DIF -348 crossing above DEA -355, and the histogram turning from negative to positive. While the value is only 6.88, this is the first signal of short-term momentum recovery. The RSI is at 30.41, having entered the oversold area, indicating a potential technical rebound at any time. However, I must pour cold water on this; the 1-hour EMA55 is at 63,758, and the current price is still 1.24% away from EMA55. Furthermore, in the past 8 one-hour candles, the closing price has never been above EMA55, nor has it crossed above it. What does this indicate? It indicates that the price is completely suppressed below EMA55, and bears dominate the 1-hour level. On the 15-minute level, the MACD histogram has turned positive, and the RSI has returned to 52.54, showing signs of stabilization in the short term, but this is just a breather during the downtrend, not a reversal signal.
Let’s verify the current signals with the Qinglan TPV system. First, looking at trend positioning, the current price is 62,971, and the 1-hour EMA55 is at 63,758; the price is clearly below EMA55, indicating a bearish trend area. According to the system rules, in a bearish trend, we only consider shorting and do not think about longing. The first condition for shorting is that the price is under pressure below the 1-hour EMA55, and the closing prices of two consecutive 1-hour candles are less than EMA55, which is fully met. The second condition is resistance, with the current price repeatedly being blocked near the psychological level of 63,000, as the 4-hour MA5 at 63,070 also forms short-term resistance. Long upper shadow patterns have frequently appeared in the 1-hour candles, and this condition is also valid. The third condition is that the rebound has no strength; although the 1-hour MACD has formed a golden cross, the histogram value is very small, and while the RSI has risen from the oversold area, the strength is weak, without forming an effective bullish engulfing pattern, indicating that rebound momentum is clearly insufficient. Overall, the TPV system signals a continuation of the bearish trend, but there may be a demand for an oversold rebound in the short term, and the operation should focus on shorting on the rebound rather than chasing down.
On-chain data shows a Fear and Greed Index of 27, with market sentiment being extremely pessimistic, which is often characteristic of a short-term bottom. Tether reported a net profit of 1.5 billion USD in the second quarter, with reserves reaching a record high of 4.11 billion USD, indicating that the health of the stablecoin market is improving, showing an intention for outside funds to enter. Zhibao Technology acquiring 2,380 Bitcoins through private financing is a landmark event for listed companies in China accepting Bitcoin financing, illustrating a genuine demand for institutional allocation. BitMine increased its holdings of Ethereum by over 4.8% of the supply, indicating that long-term funds remain confident about the future. However, Fidelity-associated wallets transferred 260,000 Ethereum; although it is most likely a custody adjustment, it will trigger short-term market concerns about selling. Overall, the on-chain funds remain neutral, with institutions accumulating at low levels, but retail investor sentiment remains fragile.
Key attack and defense levels: the first resistance level above looks at the psychological level of 63,000, which has already been tested multiple times today; a breakout and stabilization will allow for a look at the second resistance level at 63,758, which is the 1-hour EMA55. If the price can regain EMA55, the bearish trend will be broken, marking a real opportunity to consider going long. The first support level below is at 62,000, the lower edge of a previous area of dense trading, and the second support level is at 61,000; if this level is broken, the downward space on the daily chart will open further. The current price is at 62,971, close to both the resistance above and the support below, fitting the typical pattern of a range-bound bearish market.
Regarding trading thoughts, Sister Qinglan provides a clear framework. The direction is clear: bearish trend, short on rebounds. Entry conditions: wait for the price to rebound to the range of 63,000 to 63,200, while observing whether a long upper shadow or a top formation occurs on the 1-hour candles. If the MACD histogram shows a contraction for two consecutive periods, entry can be confirmed. Set a stop loss at 63,850, which is above the 1-hour EMA55; if this level is breached, it indicates that the bearish trend is being violated, and it's necessary to exit. The first target looks at 62,000, the second target at 61,000. If the price directly falls below 62,000, do not chase down; wait for confirmation of a pullback before entering. In terms of position control, given the current market volatility, it is recommended to control single-trade risks within 2% of account funds, and avoid heavy positioning due to panic or greed.
Risk warning: Expectations for further rate hikes by the Federal Reserve might intensify, with continued macroeconomic headwinds; any rebound could be interrupted by sudden news events. Strict stop losses are the first rule for survival.
Follow Qinglan Crypto Classroom to seize more trading opportunities! Welcome to visit the official website www.qinglan.org
📊 Qinglan TPV Trading Strategy Backtest Reference
🕒 Last Backtest Time: 08-01 07:00:02
Total Analysis: 3340 Backtests: 3336 Accuracy Rate: 82.1% (2740/3336)
免责声明:本文章仅代表作者个人观点,不代表本平台的立场和观点。本文章仅供信息分享,不构成对任何人的任何投资建议。用户与作者之间的任何争议,与本平台无关。如网页中刊载的文章或图片涉及侵权,请提供相关的权利证明和身份证明发送邮件到support@aicoin.com,本平台相关工作人员将会进行核查。