Ripple's "North Star" token, XRP, is ending July at $1.06. After a prolonged decline, the main question heading into the new month is whether the asset can break its four-year streak of negative August closes and finally use its accumulated potential for a bullish breakout from the descending channel.
CryptoRank statistics are clear and stubborn: the last time XRP pleased investors at the end of the summer was in 2021. Since then, August has closed in the red for four consecutive years, with the final month of summer consistently bringing losses.
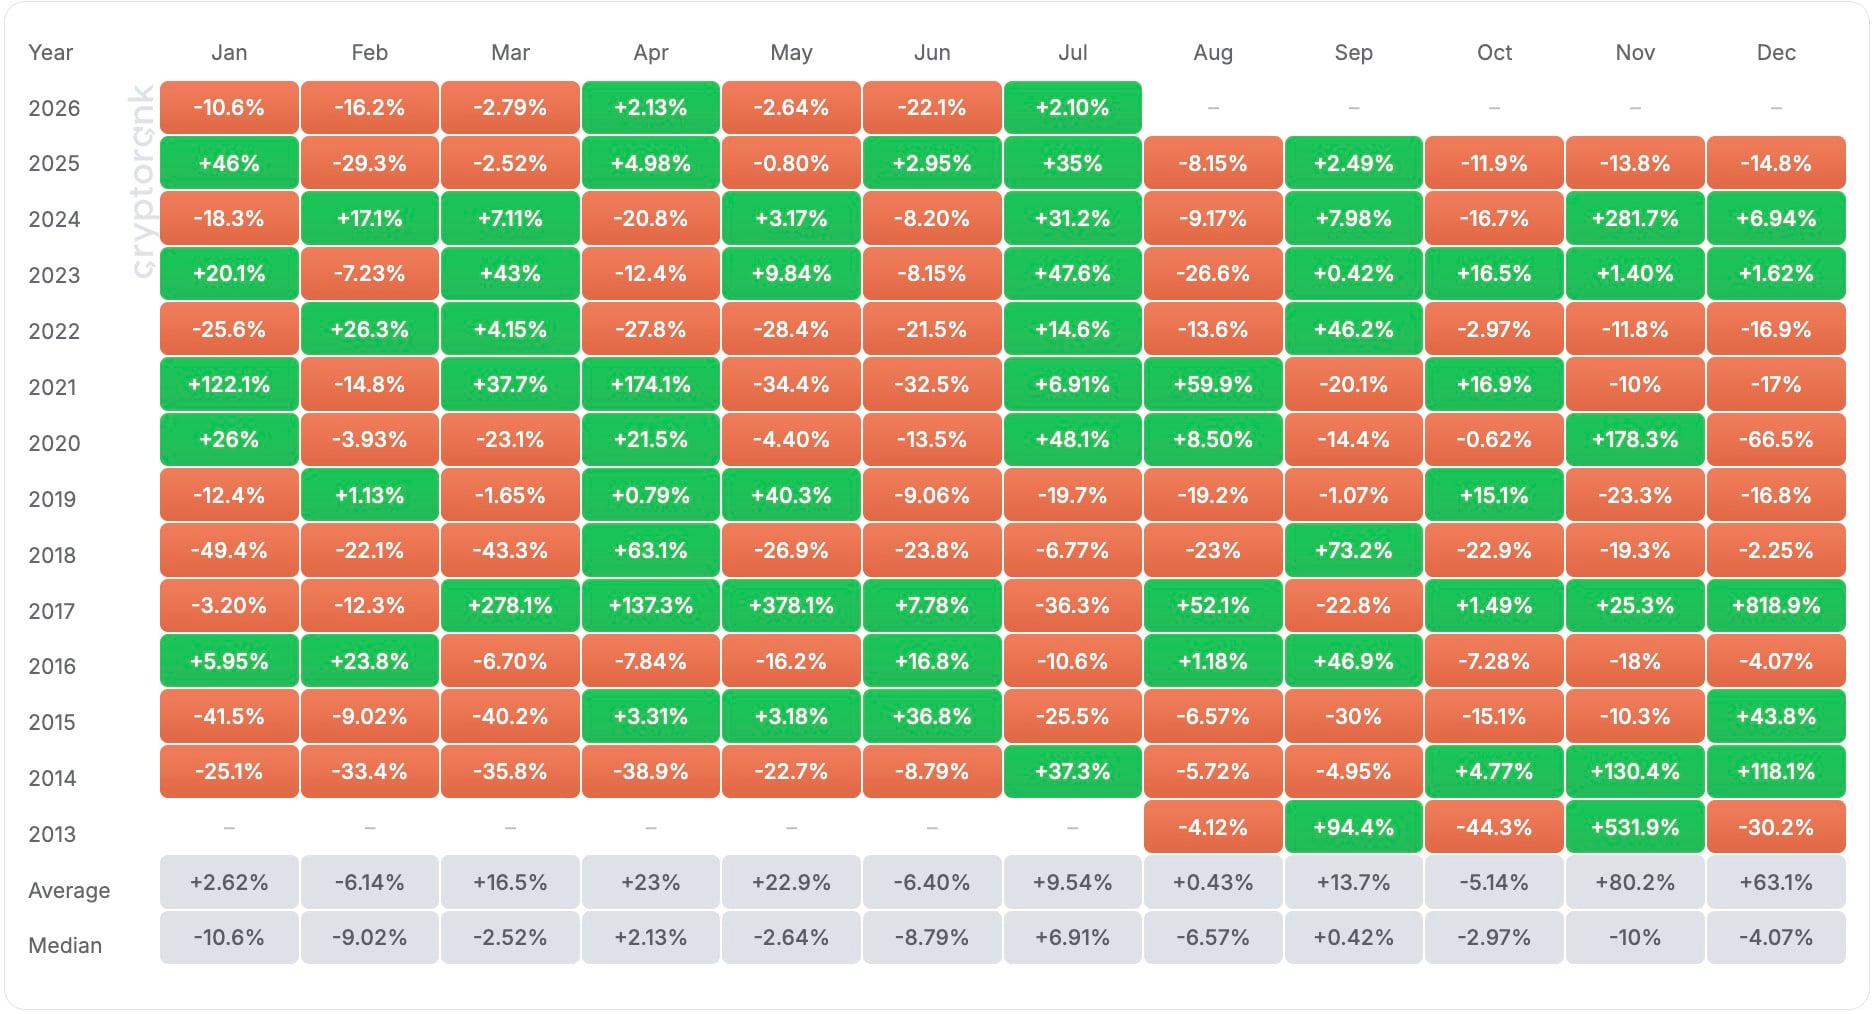
XRP price history since 2013 (USD), Source: CryptoRank
At the same time, contrary to common assumptions, August is not the worst month in the coin's history. Its historical average return stands at +0.43%, which is significantly stronger than the disastrous performances recorded in June (-6.40%) and February (-6.14%). The main problem with August is precisely this four-year losing streak, which bulls are determined to break.
HOT Stories Dogecoin (DOGE), Zcash (ZEC), Cardano (ADA) and Solana (SOL) Price Analysis For August 1: Outsiders Enter the Stage Democrats Hate Crypto More Than Oil Companies and Data Centers, Poll Shows
Why Q3 2026 can be a launchpad for XRP's price recovery
Despite the gloomy August seasonality, quarterly statistics provide a genuine bullish reason for optimism.
Yes, the first half of 2026 was disastrous for XRP. The first quarter closed with a 27.1% decline, while the second fell by 22.4%, with June alone dragging the coin down by 22.1%. However, the third quarter has started to show a reversal in the trend. Q3 returns have now moved into positive territory at +2.10%, largely because July remained in the green with a gain of 1.91%.
Historically, the third quarter is the best period for XRP's recovery. Its average return stands at +17%, while the median rises to +25.8%. Moreover, the overall Q3 performance has remained positive for the past four years, despite local declines during August.
You Might Also Like

Fri, 07/31/2026 - 16:42 How Ripple Plans to Re-Engineer XRP: Top Exec Breaks Down 5 Key Incoming AmendmentsByGamza Khanzadaev
The current daily TradingView chart clearly explains why XRP finally has a bullish opportunity. The coin has been moving inside a broad descending wedge for more than a year. The upper boundary of this global trend currently lies around $1.20–$1.25. This level represents the main resistance, and a breakout above it would open the way for a full-scale rally.
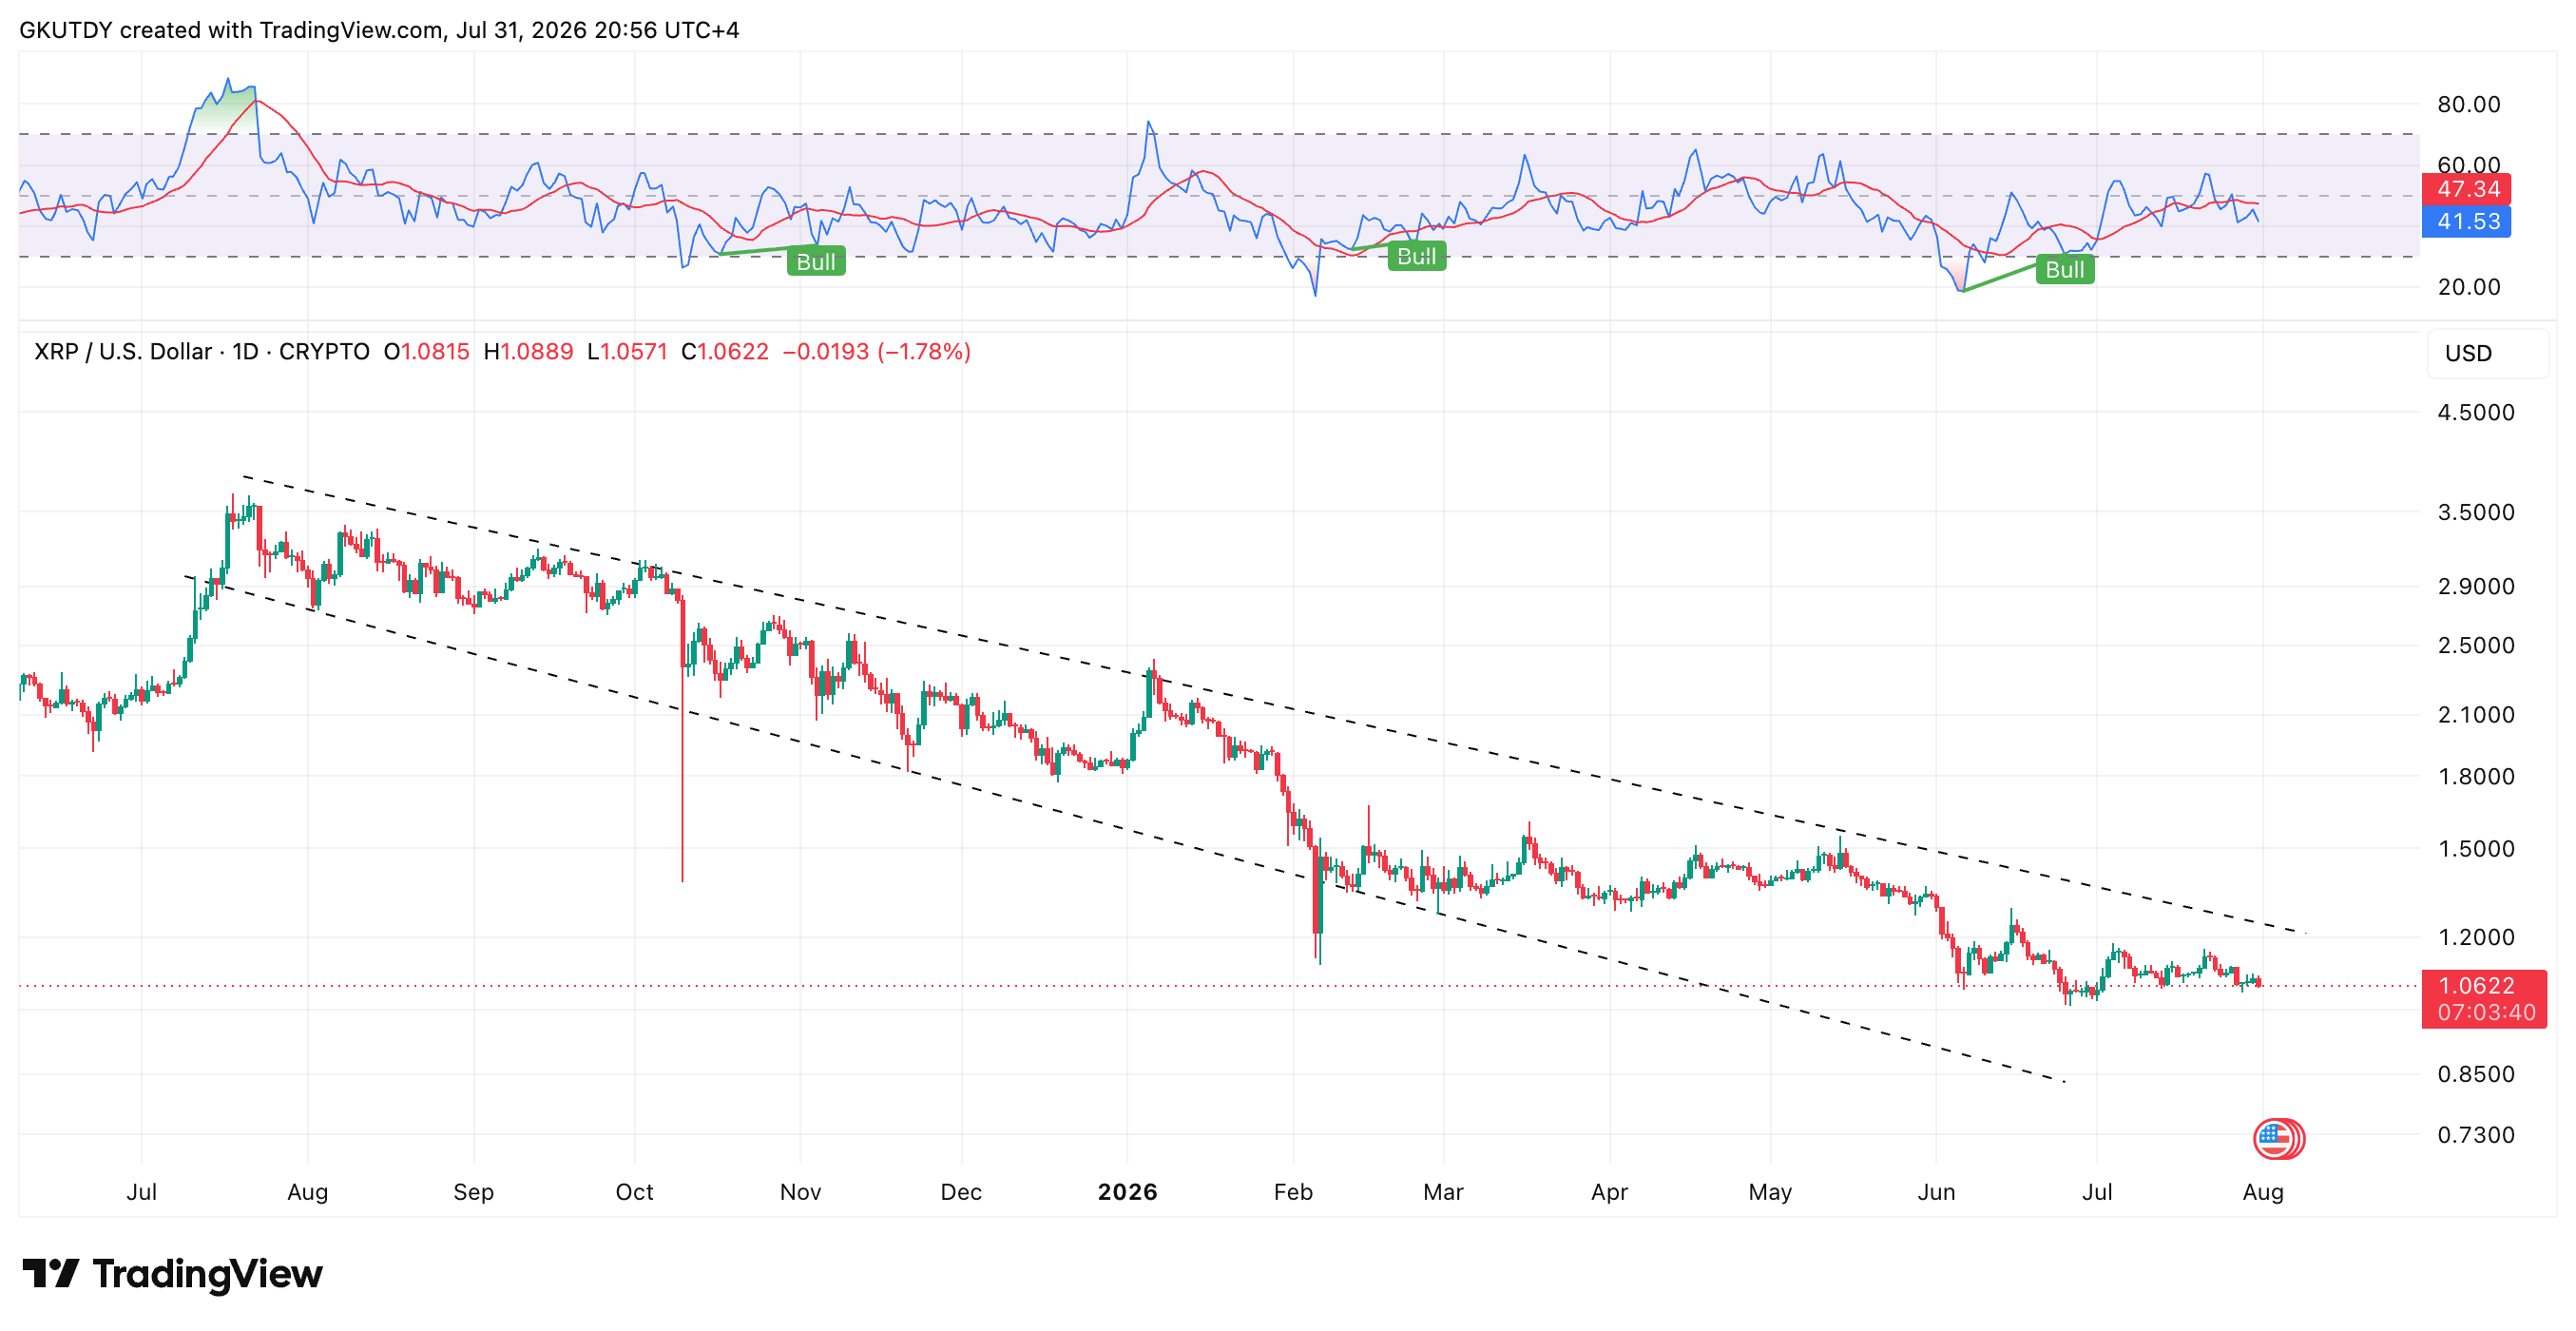
XRP price action year-to-year on a daily time frame, Source: TradingView
However, the price is currently compressed near the lower boundary of the local support range at approximately $1.05–$1.06.
August will become the decisive battle. It will either confirm its status as a weak period or submit to the broader bullish trend of the third quarter. XRP does not need to set any records to break its four-year losing streak. It only needs to close August above its opening price.
The positive start to the third quarter and the proximity of a strong support zone give the asset its best bullish opportunity to reverse the descending trend in five years.
免责声明:本文章仅代表作者个人观点,不代表本平台的立场和观点。本文章仅供信息分享,不构成对任何人的任何投资建议。用户与作者之间的任何争议,与本平台无关。如网页中刊载的文章或图片涉及侵权,请提供相关的权利证明和身份证明发送邮件到support@aicoin.com,本平台相关工作人员将会进行核查。


