Team members, this morning's market is quite intense. The probability of a 25 basis point rate hike by the Federal Reserve in September has surged to 67%. With this news, risk assets are inevitably jittery. On the other hand, Galaxy has confirmed the third wave of COLDCARD attacks, with estimated losses exceeding 88 million dollars, tearing a hole in the security myth of hardware wallets and inevitably undermining market confidence in holding Bitcoin. With dual negative pressures, BTC is still hovering around 63,000, and there hasn’t been any panic selling, indicating that there is still support below, but the courage to push higher is limited. Today's market is destined to be a tug-of-war.
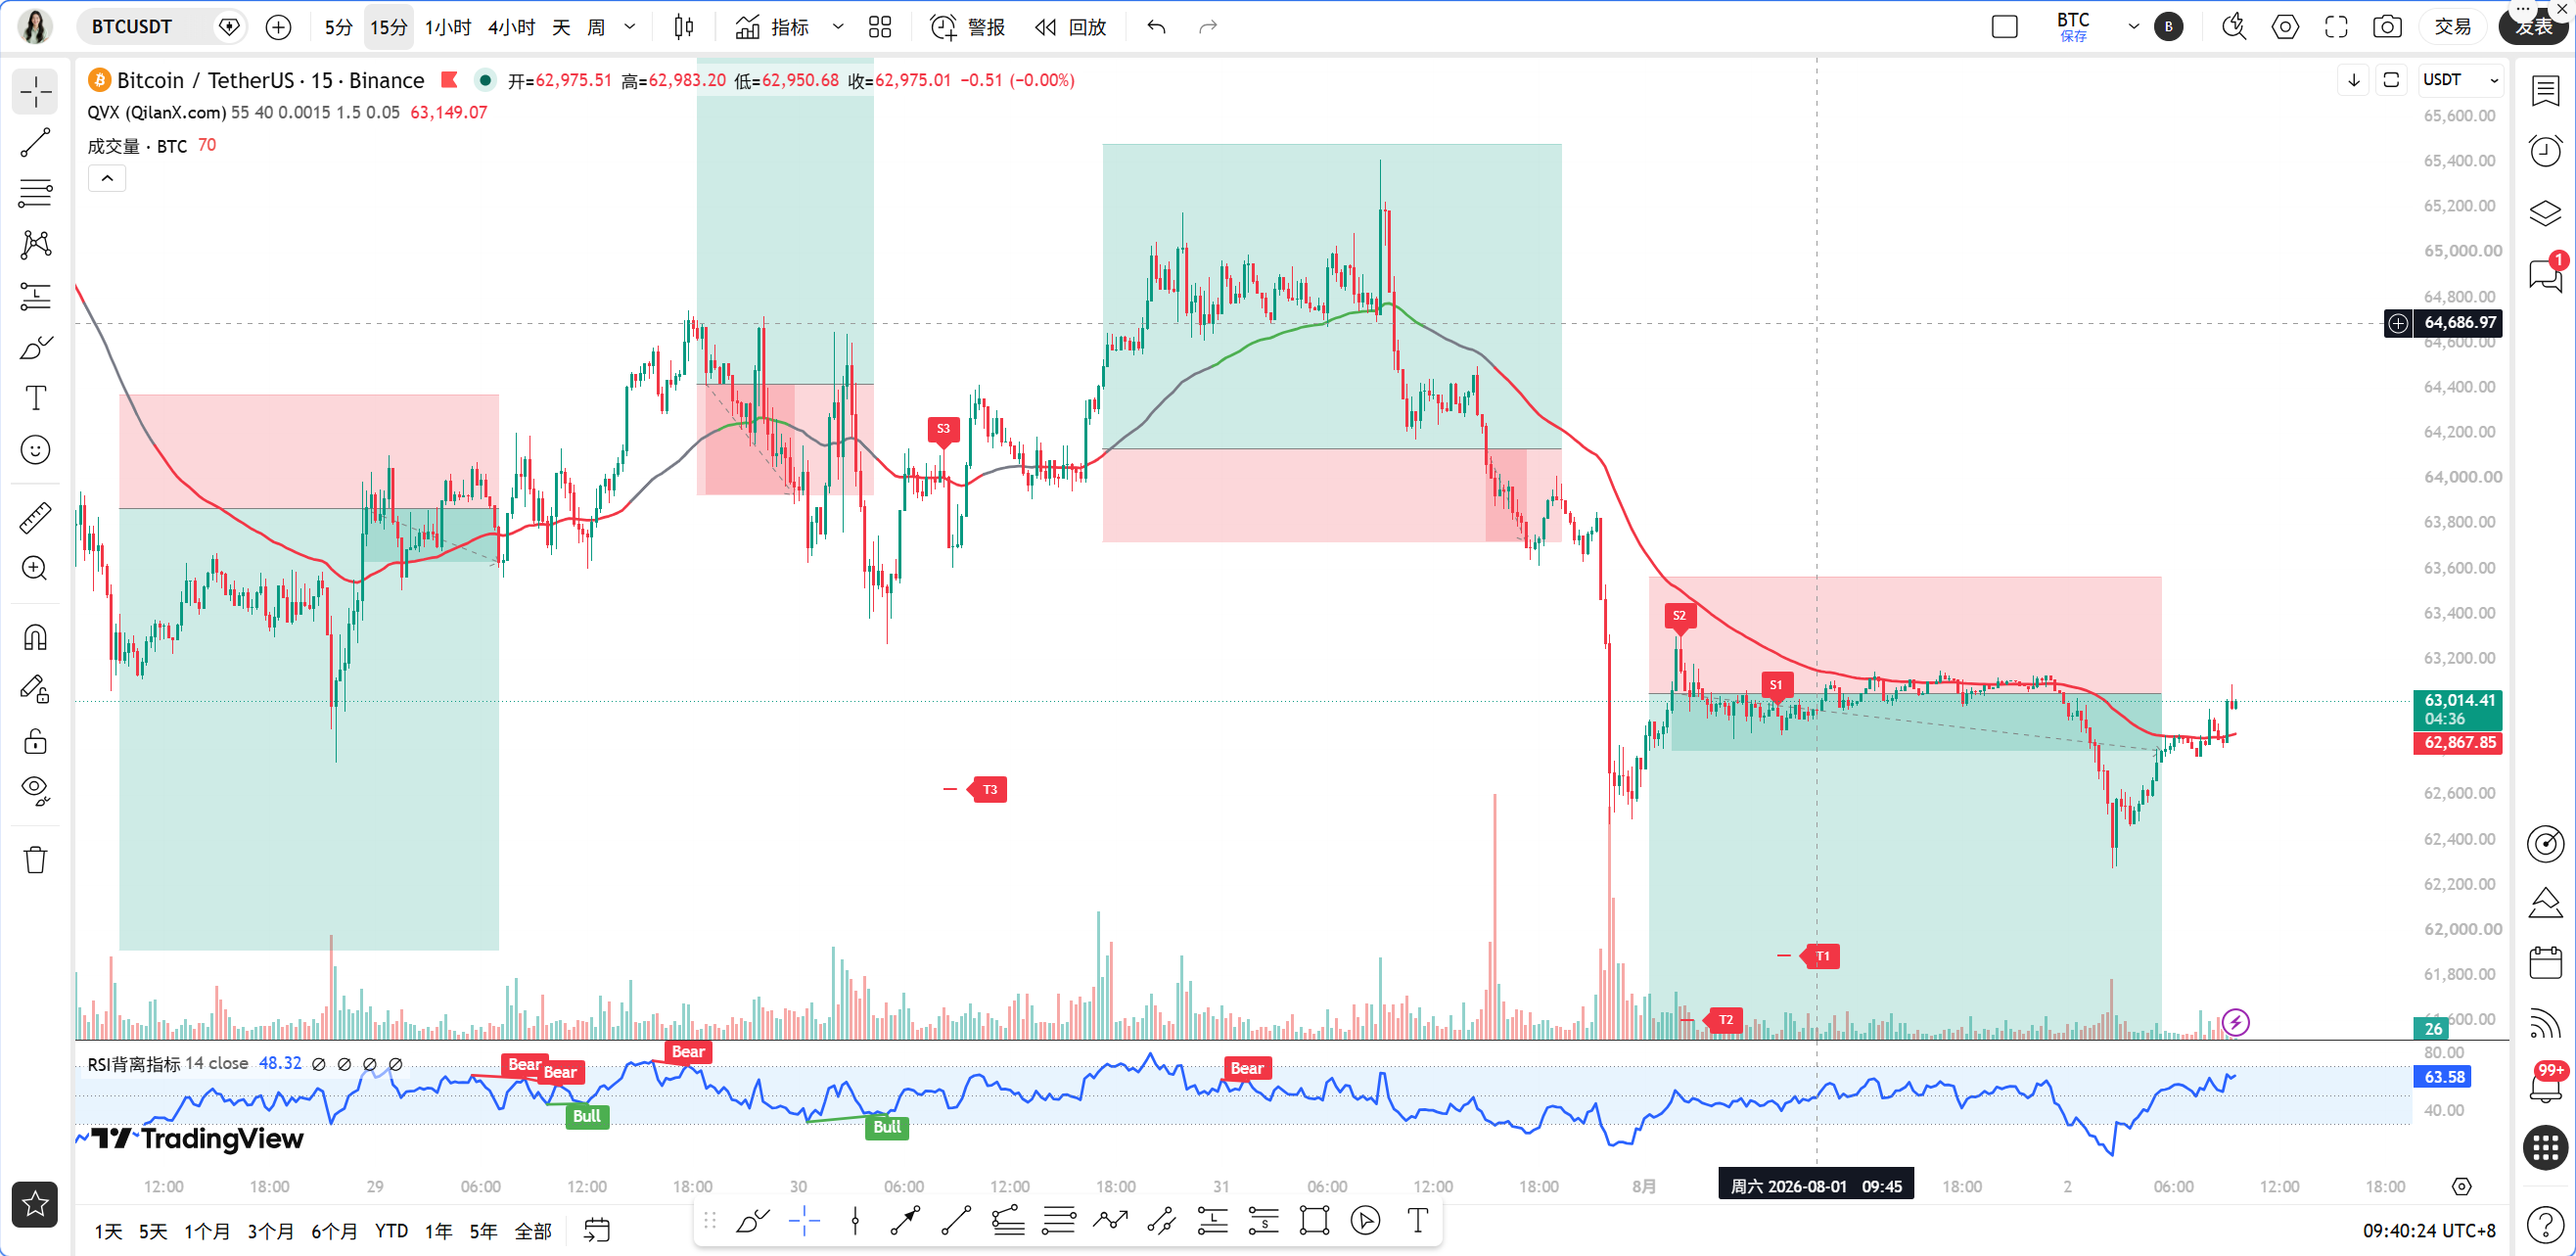
The current time is 09:49 AM on August 02, with BTC priced at 62,990 USDT, showing a 24-hour fluctuation of only 0.07%, essentially remaining stagnant. This position is delicate, with pressure above and support below, both bulls and bears are waiting for a clear directional signal.
First, let’s look at the larger timeframe. On the daily chart, the MACD histogram is negative, with both DIF and DEA below the zero axis, indicating that the bearish trend remains unchanged. The RSI is at 41.59, neither in the oversold zone nor back in the strong zone, representing weak oscillation. The 4-hour chart shows this more clearly, with the negative MACD histogram expanding, and RSI at only 24.99, having entered the oversold area, indicating a demand for a short-term rebound, but the strength and sustainability of the rebound are in question. The 1-hour level is slightly better, with the MACD histogram turning positive, showing signs of DIF crossing above DEA, and RSI recovering to 46.41, indicating that short-term momentum is repairing. At the 15-minute level, MA5 and MA10 are both above MA30, MACD red bars are enlarging, and RSI is at 60.86, showing a bullish short-term bias.
Now let’s verify this with the Qinglan TPV system. The core rule is that the 1-hour EMA55 acts as the bullish-bearish boundary, and the current EMA55 is at 63,296.93, while the current price of 62,990 is below it. In the past 8 one-hour candlesticks, there have been 0 instances where the closing price was above EMA55, with 0 crossings, indicating that the price is being completely suppressed below the moving average line, with bears controlling the situation. Although the current price is 0.48% away from EMA55, not meeting the oscillation threshold, there have also been no instances where two consecutive candlesticks closed above EMA55, so the conditions for going long are not met. For shorting conditions, while the price is indeed below EMA55, the MACD histogram has shortened for two consecutive periods, and RSI is rebounding from the oversold area, indicating that the downward momentum is waning, which poses a high risk for chasing shorts. Therefore, at this position, the TPV system gives a wait-and-see signal, neither chasing long nor short, waiting for clarity in direction.
Regarding on-chain data, the Fear and Greed Index is at 27, indicating that the market is in a state of fear, but often, opportunities brew in such times. The funding rate shows that bearish momentum is weakening, and market sentiment is neutral to weak, indicating that bearish forces are exhausting, but bulls also do not dare to launch a large-scale attack. Additionally, there has been a net inflow of 4,701 BTC into CEX over the past 7 days, led by Coinbase, with significant BTC inflows into exchanges, increasing potential selling pressure, casting a shadow over the rebound.
In terms of key resistance and support levels, the first key resistance above is the 1-hour EMA55 at 63,296. If the price cannot exceed this level, the bulls are just paper tigers. Further up, the 4-hour MA30 at 63,717 serves as the second resistance. The first support below is at 62,500, which has been tested multiple times recently. If it breaks, the next level to watch is the whole number at 62,000, and below that is the strong support level at 61,500 on the daily chart. Today, focus on the range between 62,500 and 63,300; whichever side breaks, the direction will follow that movement.
For trading strategies, I have two plans for everyone. First, for aggressive friends, if the price can close above 63,300 with two consecutive one-hour candlesticks, and the MACD histogram continues to expand, a small long position can be attempted, with an entry around 63,350, a stop loss at 62,900, and target levels at 64,000 and 64,500. Second, for conservative friends, wait for the price to rebound to the range of 64,000 to 64,500. If a long upper shadow or a top formation appears, a short position can be set, with an entry around 64,100, a stop loss at 64,650, and target levels at 63,000 and 62,500. If the price directly breaks below 62,500, do not rush to chase shorts; wait for a pullback to the range of 62,500 to 62,700 to enter, with a stop loss above 63,000 and target levels at 61,500.
The risk warning is simply stated: before the Federal Reserve's meeting, market volatility will increase, and positions in either direction should be well managed; do not bet heavily on direction.
Follow Qinglan Crypto Classroom to grasp more trading opportunities! Welcome to visit our official website www.qinglan.org
📊 Qinglan TPV trading strategy backtesting reference
🕒 Last backtesting time 08-02 07:00:01
Total analysis: 3352 Backtest: 3348 Accuracy: 82% (2747/3348)
免责声明:本文章仅代表作者个人观点,不代表本平台的立场和观点。本文章仅供信息分享,不构成对任何人的任何投资建议。用户与作者之间的任何争议,与本平台无关。如网页中刊载的文章或图片涉及侵权,请提供相关的权利证明和身份证明发送邮件到support@aicoin.com,本平台相关工作人员将会进行核查。