Cryptocurrency Circle Academician: The rebound height of 8.6 Ethereum (ETH) has become a shackle; how will the new round of Ethereum market unfold? Latest market analysis reference
The current price of Ethereum is 1890. This kind of volatile market tests one’s mentality the most. Following the price up can easily lead to a pullback, and cutting losses can easily cause bottom-fishing funds to push it up. Many retail investors always think about grabbing the big trend, ignoring the rhythm control within the fluctuations. Currently, at a price of 1890, there is no clear bullish trend, and the bears have not completely taken over. Do not subjectively predict one-sided rises and falls; trading based on market signals is the way to survive. In a volatile market, do not heavily bet on direction; prioritize the risk-to-reward ratio. If the market is not understandable, choose to watch. Protecting the principal is always more important than chasing short-term profits.
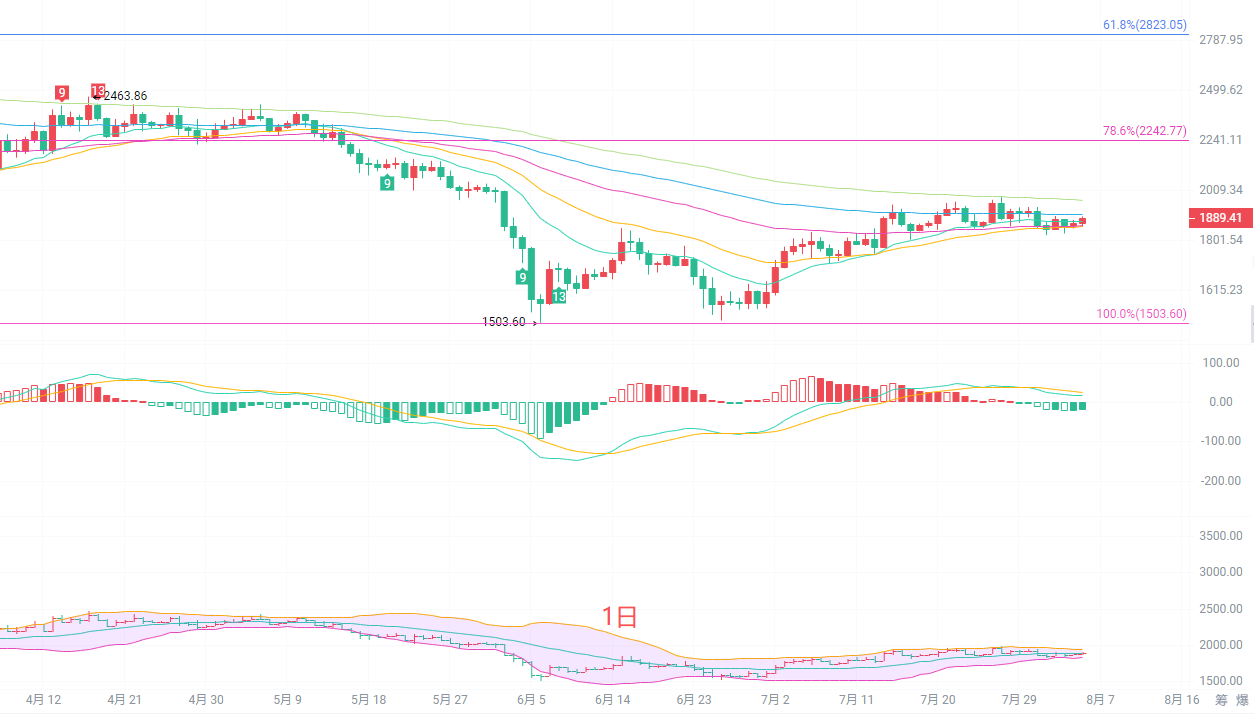
The daily candlestick chart is in a recovery and fluctuation range after a mid-term decline. The EMA moving average system shows EMA15 at 1877 and EMA30 at 1856; the price is stabilized above the short-term moving averages, but the 60, 90, and 120-period moving averages are still above, forming pressure. The key resistance above is located around 1905-1967. The MACD indicator DIF and DEA bullish momentum has not been fully released. The Bollinger Bands are narrowing, with the upper band at 1949 and the lower band at 1826, entering a range consolidation overall. Strong support is near 1826 below. If this position is effectively broken, it will open up further downward movement; above, a breakout of 1949 would provide an opportunity for upward movement on the daily line, while the current daily level still belongs to rebound recovery and has not reversed the bullish trend.
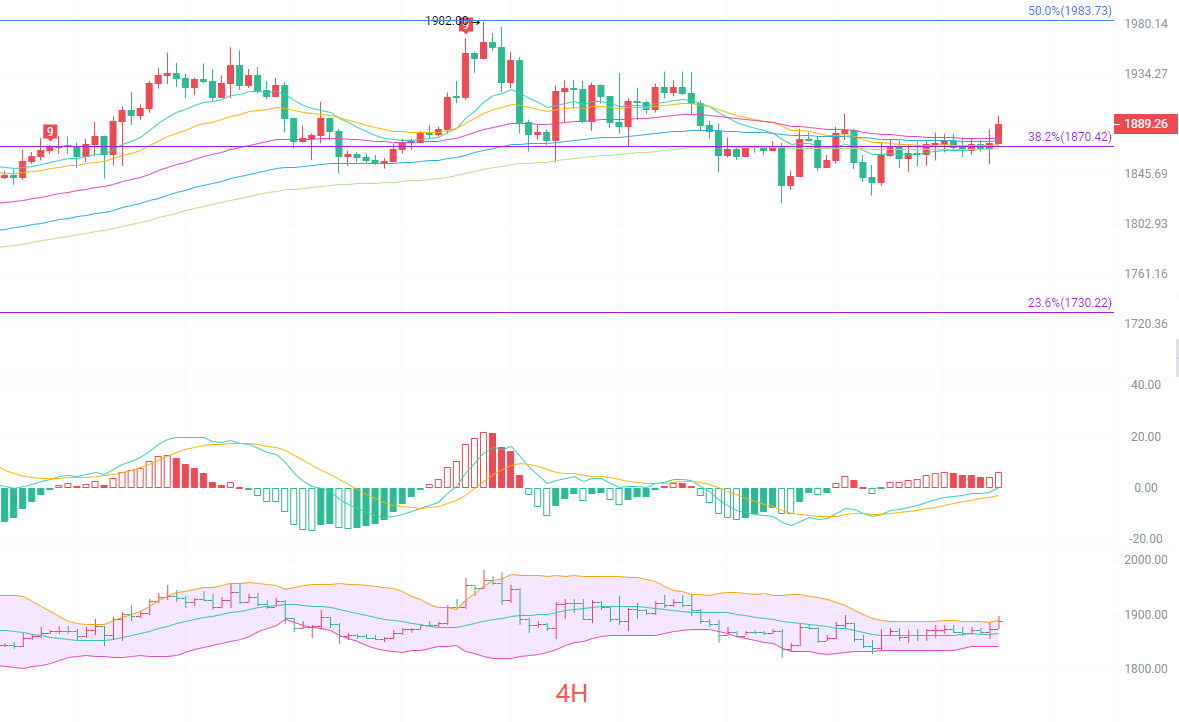
The four-hour candlestick chart has recently formed a low-level upward fluctuation structure. The short-term EMA15 and EMA30 moving averages are turning up, with the price resting on the short-term moving averages. The 38.2% Fibonacci level at 1870 serves as a short-term support level. The MACD indicator DIF and DEA bullish strength has warmed slightly but has not formed a strong bullish trend. The Bollinger Bands are narrowing, with the upper band at 1891 and the lower band at 1842. The price is nearing the upper Bollinger Band, with the possibility of facing resistance and pulling back. The first resistance above is at 1902, which is the recent four-hour high point. Only by stabilizing above this level will the short-term bullish space further open; if it faces resistance and pulls back, it will seek support in the 1870-1842 range. The four-hour chart still exhibits a range fluctuation pattern.
Short-term reference:
If it does not break below 1870 to 1820, it is expected to move up, with a stop loss at 1790 and a target looking at 1900 to 1930.
If it does not break above 1900 to 1930, it is expected to move down, with a stop loss at 1960 and a target looking at 1860 to 1820.
Specific operations should primarily rely on real-time market data. For more detailed information, you can consult the author. The publication of the article has a delay, and it is recommended for reference only at your own risk.

Reminder: The above content is solely created by the author’s public account. Advertisements at the end of the article and in the comments section are not related to the author. Please discern cautiously, thank you for reading.
免责声明:本文章仅代表作者个人观点,不代表本平台的立场和观点。本文章仅供信息分享,不构成对任何人的任何投资建议。用户与作者之间的任何争议,与本平台无关。如网页中刊载的文章或图片涉及侵权,请提供相关的权利证明和身份证明发送邮件到support@aicoin.com,本平台相关工作人员将会进行核查。