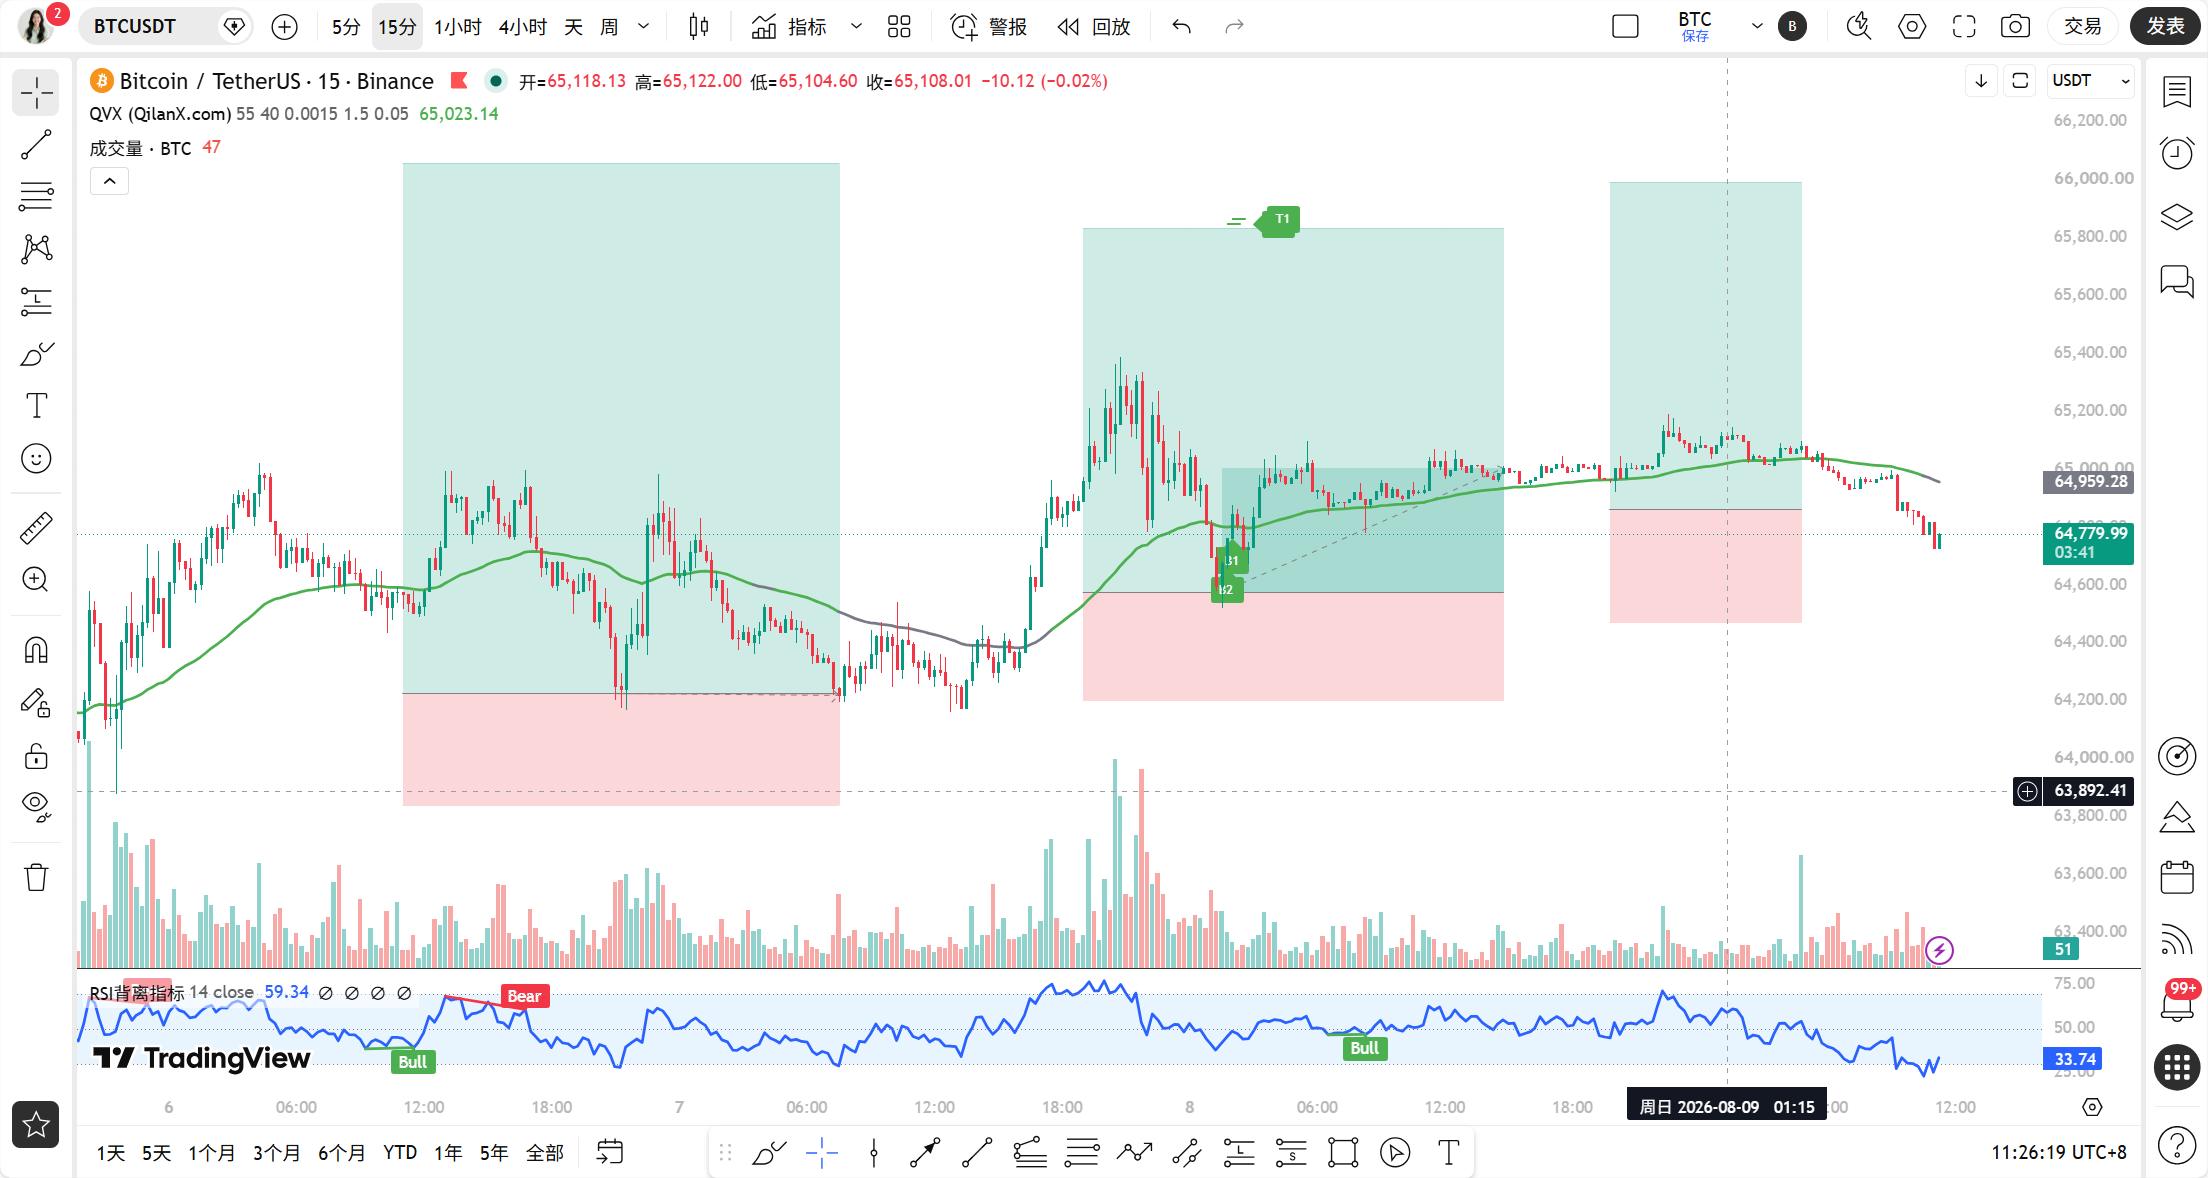
Dear teammates, the information in today's market in the morning is quite substantial. Miners have deposited 2802 BTC to Binance in the past two days, worth 182 million US dollars. This large deposit is typically interpreted by the market as a potential sell signal. Meanwhile, Ledger has issued a warning that the BIP-110 fork does not have replay protection, and operating forked coins could lead to losses on the main chain BTC, which has directly heightened market risk aversion. With these two negative factors combined, Bitcoin is clearly under pressure around 64800, and short-term bulls need to be especially cautious.
The current time is August 9, 11:35 AM, with BTC quoted at 64781 USDT, a 24-hour decline of 0.27%. This position is quite interesting, as it is exactly stuck near the 1-hour EMA55, representing a typical line-bound fluctuation state. The fear and greed index is at 31, with market sentiment in the fear range, indicating that most retail investors have begun to waver. However, it is often at such times that a calm perspective is required.
Let's first look at the daily level. MA5 is at 64731, MA10 is at 64056, MA30 is at 64366, and the moving average system shows a bullish arrangement with prices above all moving averages. The MACD's DIF is at 157.23, DEA at 80.18, and the histogram at 77.05. Although the red bars have shortened compared to the previous periods, the overall momentum remains bullish. The RSI is at 45.99, in a neutral to weak area, indicating that the daily level's pullback has not yet completely ended, but it has not entered the oversold region.
Next, let's look at the 4-hour level. MA5 is at 64973, MA10 at 64965, MA30 at 64568, and the short-term moving averages are starting to flatten out. The MACD's DIF is at 239.14, DEA at 264.33, and the histogram is at -25.20, indicating the appearance of green bars after a death cross, showing that the adjustment pressure at the 4-hour level is being released. The RSI is at 59.83, still above 50 after retreating from a high position, categorizing it as a strong adjustment.
The 1-hour level is currently the most critical battleground. MA5 is at 64879, MA10 at 64956, MA30 at 64984, and the moving average system is starting to diverge downwards. The EMA55 is at 64892, and the current price of 64781 has already fallen below this key dividing line. The MACD's DIF is at -14.14, DEA at 25.72, and the histogram at -39.85, with the green bars still expanding, indicating that bearish momentum at the 1-hour level is still being released. The RSI is at 32.29, already approaching the oversold area, with a potential technical rebound in the short term, but the strength of the rebound needs to be observed.
The 15-minute level is even weaker. MA5 is at 64778, MA10 at 64820, MA30 at 64938, with short-term moving averages in a bearish arrangement. The MACD's DIF is at -63.70, DEA at -51.46, and the histogram is at -12.25. Although the green bars have narrowed somewhat, both DIF and DEA are below the zero axis, limiting rebound strength. The RSI is at 30.78, having entered the oversold area, indicating a need for short-term recovery.
Now let's use the Qinglan TPV system to verify the signal. At the 1-hour level, there have been 5 instances of closing prices higher than EMA55 out of the past 8 candles, with 1 instance of crossing. The current price is only 0.17% away from EMA55. According to the system rules, this amplitude is less than 0.3%, representing line-bound fluctuation, increasing the likelihood of oscillation. However, with only 1 crossing, it does not meet the criteria for judging a fluctuating market, so we are still handling it as a trending market.
In terms of short-selling conditions, the condition of the price being pressured below the 1-hour EMA55 has been met, with the current price of 64781 lower than the EMA55 of 64892. However, the condition of two consecutive 1-hour candles closing below the EMA55 still needs confirmation, as currently only one candle has closed below EMA55. In terms of pressure encountering resistance, we need to see a long upper shadow or a top fractal; as of now, the 1-hour level has not shown a clear top reversal signal. Regarding insufficient rebound strength, the condition of MACD column shortening for two consecutive cycles has not yet been met, and although RSI has fallen from a high position, it has not yet triggered the standard of falling back above 70.
In summary, the TPV system is currently in an observation period, and the short-selling conditions have not been fully met, while the conditions for going long are even less established. In this situation, it is crucial to avoid entering based on feeling; we must wait for the system to provide clear signals before taking action.
In terms of on-chain data, large deposits by miners to exchanges are indeed a short-term pressure signal, but we must also see the positive side. Whales are massively building positions in SOL, planning to buy 500,000 SOL at an average price of 76 USD, and this warming of risk preference has a motivating effect on overall market sentiment. Additionally, Wells Fargo announced plans to launch tokenized deposits in 2026, and the entry of traditional financial institutions represents a long-term benefit. The U.S. Senate will conduct a procedural vote on the CLARITY Act on September 15, and the advancement of regulatory frameworks will also enhance market compliance expectations.
Looking at the key offensive and defensive positions, the first resistance level above is at the 1-hour EMA55 of 64892, which has been contested multiple times today. The second resistance level is at the 4-hour MA5 of 64973; if the price can regain the 65000 round number, the short-term bearish logic will be disrupted. The first support level below is at the daily MA5 of 64731, which has already been tested once this morning. The second support level is at the daily MA10 of 64056, which is the midpoint between the bullish and bearish trends; once it falls below, deeper corrections should be anticipated.
In terms of trading ideas, I present two plans. The first is a trend-following short-selling plan; if two consecutive 1-hour candles close below EMA55, and a long upper shadow or top fractal pattern occurs, while MACD green bars begin to shorten, one can lightly short in the 64850 to 64950 range, with a stop-loss above 65200, aiming for a first target at 64050 and a second target at 63700. The second plan is to wait for stabilization and go long; if the price shows a volume reversal signal in the 64050 to 64200 range, such as a long lower shadow or bottom fractal, while RSI rebounds from the oversold area, one can lightly try a long near 64200, with a stop-loss below 63800, aiming for a first target at 64800 and a second target at 65200.
Here, it is particularly important to remind that the current price is only 0.17% away from EMA55, representing a line-bound fluctuation state, where false breakouts and false breakdowns are most likely to occur. Therefore, whether going long or short, the position must be controlled at a light level, with strict stop-losses, and do not hold on to losing trades.
In terms of risk warning, the uncertainty of the BIP-110 fork is currently the biggest black swan. If there are abnormal fluctuations in the forked chain, it may trigger a chain reaction on the main chain BTC, so it is essential to control leverage and positions carefully.
Follow Qinglan Crypto Classroom to grasp more trading opportunities! Welcome to visit the official website www.qinglan.org
📊 Qinglan TPV Trading Strategy Backtesting Reference
🕒 Last Backtesting Time 08-09 07:00:02
Total Analysis: 3451 Backtests: 3445 Accuracy Rate: 81.1% (2795/3445)
免责声明:本文章仅代表作者个人观点,不代表本平台的立场和观点。本文章仅供信息分享,不构成对任何人的任何投资建议。用户与作者之间的任何争议,与本平台无关。如网页中刊载的文章或图片涉及侵权,请提供相关的权利证明和身份证明发送邮件到support@aicoin.com,本平台相关工作人员将会进行核查。