This morning's most noteworthy news is not that Bitcoin has increased by 0.45%, but that at the $67,000 mark, the CEX short liquidation intensity has accumulated to $412 million. What does this number mean? If the price can really break through, short stop-losses will be triggered in a chain reaction, creating a strong short squeeze. Meanwhile, the CEO of Strategy publicly stated that Bitcoin has shown strong resilience, unafraid of sell-offs and security challenges. The confidence expressed at the institutional level, combined with the number of new wallets on-chain hitting a 10-month high, indicates that retail and large whales are quietly increasing their holdings. These combined signals make me feel that the market is not as weak as it appears on the surface.
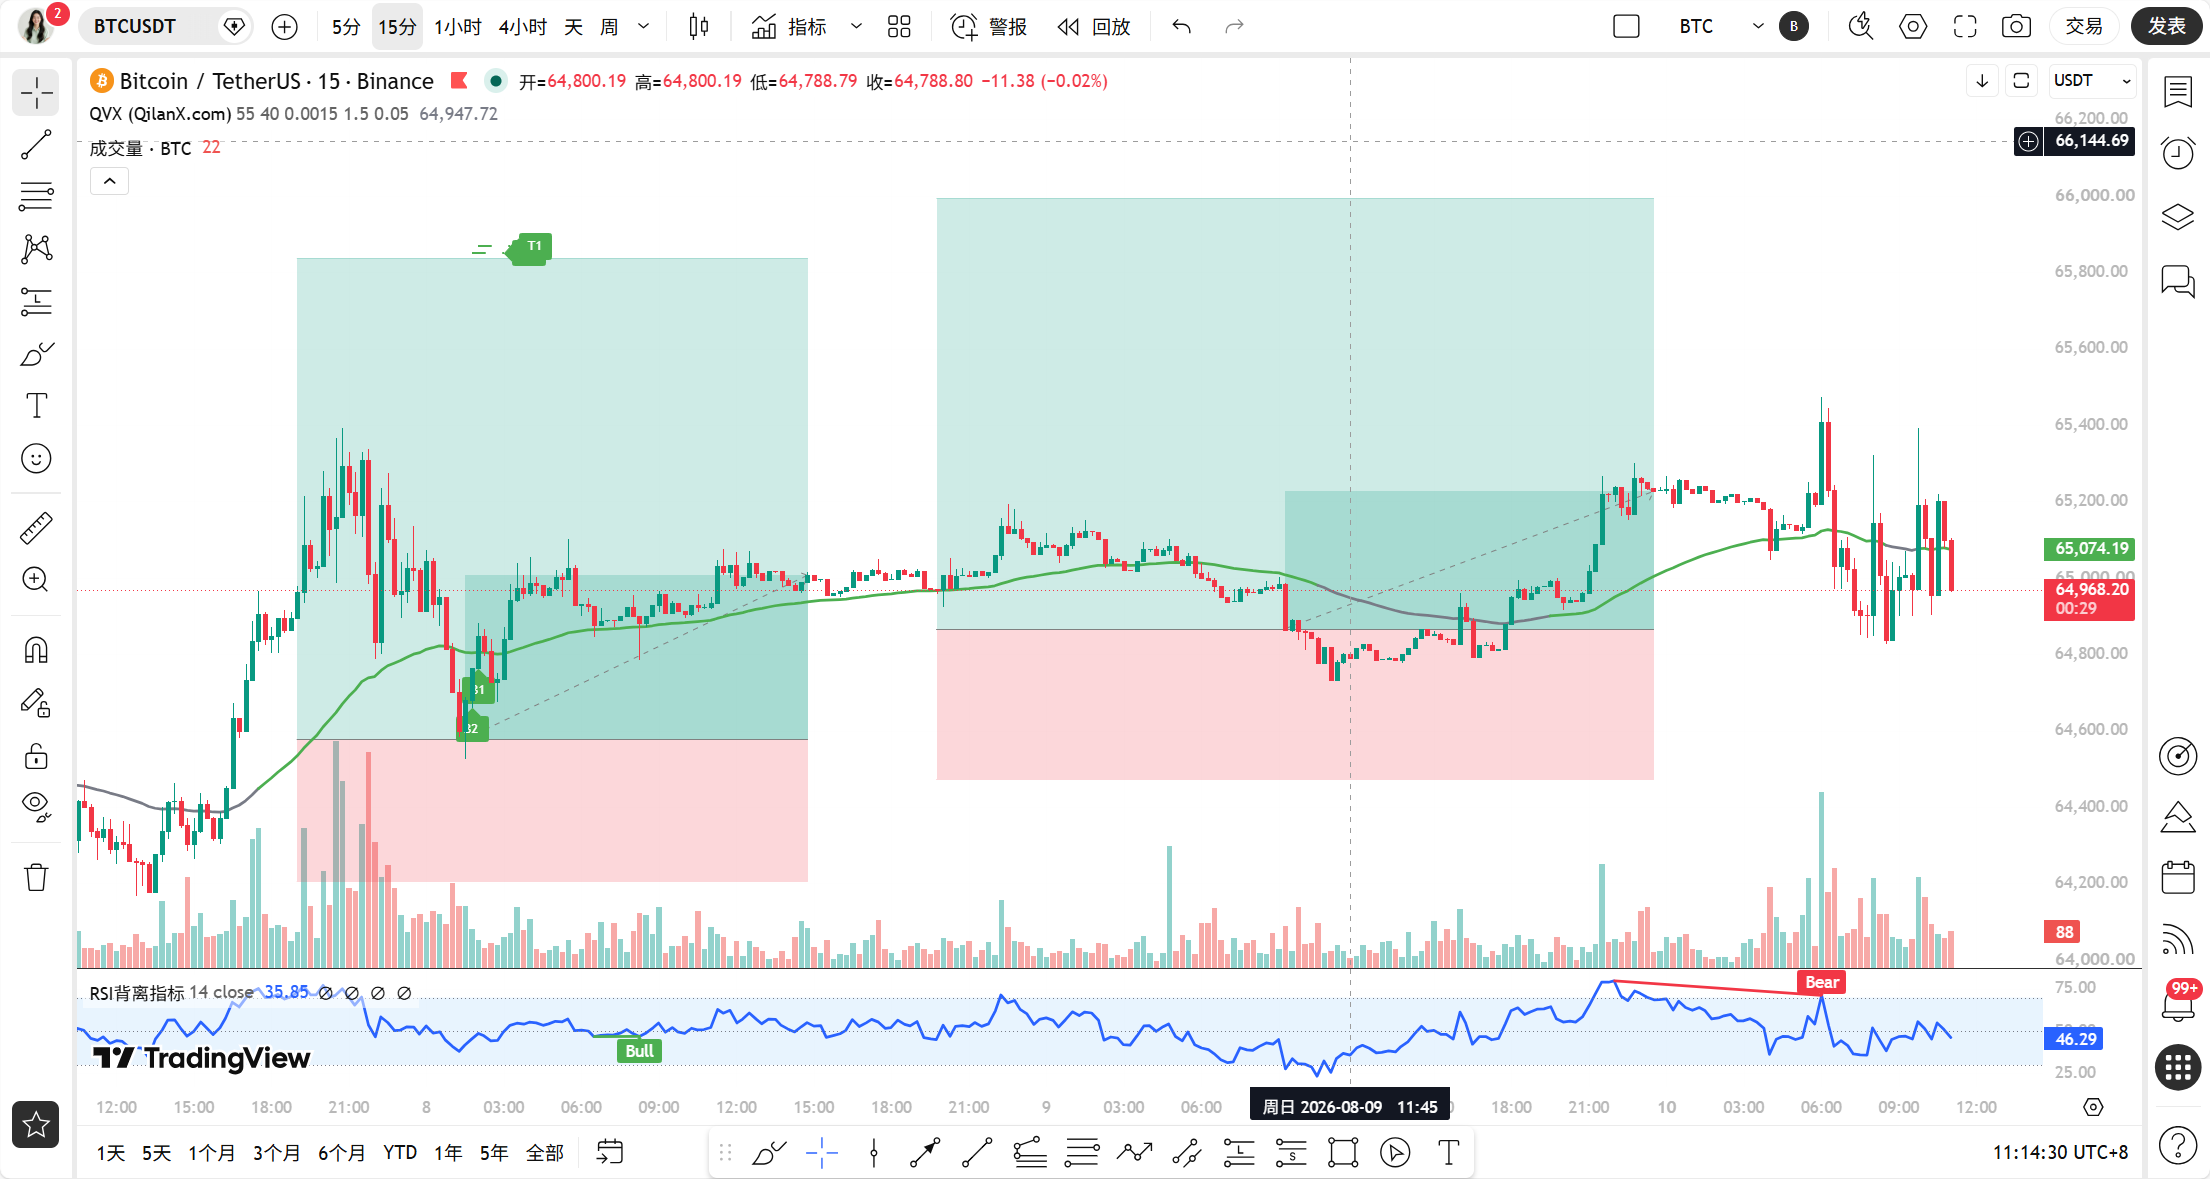
The current time is August 10, 11:14 AM, with BTC priced at 64,968 USDT, a 24-hour increase of 0.45%. The price is stuck near the psychological threshold of $65,000, creating a dilemma, with both bulls and bears waiting for a directional signal.
Looking at the daily chart, the MA5 is at 64,815, the MA10 at 64,276, and the MA30 at 64,408. The short-term moving averages have formed a bullish arrangement, with the price securely above all moving averages. The MACD DIF is at 196.27, DEA at 101.68, and the histogram at 94.59. Despite the red histogram not continuing to widen, the overall bullish pattern has not been damaged. The RSI is at 60.05, in a neutral to strong area with upward space remaining, not reaching overbought conditions. The issue with the daily chart is that the range between $65,000 and $67,000 is a previous area of dense transactions, with the pressure from trapped positions genuinely existing, making a quick breakthrough unlikely.
On the 4-hour level, things are a bit mixed. The MA5 is at 65,045, the MA10 at 64,996, and the MA30 at 64,761. The moving averages are converging, indicating uncertainty in the short-term direction. The MACD DIF is at 192.49, DEA at 227.58, and the histogram is at negative 35.09, with bearish momentum still being released, but not strongly. The RSI is at 50.26, perfectly hovering on the line dividing bulls from bears, with no clear direction. The 4-hour level gives me the feeling that bearish momentum is exhausting, but bullish momentum has not yet taken over, presenting a typical accumulation pattern.
The 1-hour level is more direct. The MA5 is at 65,025, MA10 at 65,091, and MA30 at 65,008, with moving averages completely intertwined. The MACD DIF is at 21.75, DEA at 39.62, and the histogram at negative 17.87, with bearish momentum still present but contracting continuously. The RSI is at 37.76, relatively low, indicating a demand for a short-term oversold rebound. The critical EMA55 is at 64,972, and the current price is at 64,968, just 4 points away, virtually running along the line.
At the 15-minute level, the MA5 is at 65,065, MA10 at 65,046, and MA30 at 65,075, with moving averages flattening. The MACD DIF is at negative 16.19, DEA at negative 25.40, and the histogram is at positive 9.21, indicating signs of stabilization in the short term. The RSI is at 51.93, neutral.
Now, let's verify using the Qinglan TPV system. The 1-hour EMA55 is at 64,972, and the current price is at 64,968, technically below the EMA55. However, looking at the past 8 one-hour candlesticks, the closing price was greater than the EMA55 5 times and less than it 3 times, with 3 crossovers. Additionally, the absolute amplitude from price to EMA55 is only 0.01%, completely meeting the threshold for a consolidation determination. According to the system's rules, this state belongs to a consolidating market, with no proactive long or short positions; only range trading strategies should be provided. In terms of formations, no standard top or bottom formations have appeared at the 1-hour level, and although the MACD histogram is contracted, it has not formed an explicit reduction for 2 consecutive periods. The RSI shows signs of recovery from 37.76, but the momentum isn't sufficient. Overall, the TPV system suggests a wait-and-see approach, awaiting direction selection.
Regarding on-chain data, the fear and greed index is at 30, in the fear zone, which is often characteristic of a stage bottom area. BTC's market share is at 56.68%, still high, indicating that capital is rotating within Bitcoin rather than flowing significantly into altcoins. On-chain trading volume has surged, with new wallet creations hitting a 10-month high, which is a solid signal of incremental capital entering the market. However, it is important to note that the cost lines for short-term holders are at $67,000 and $72,000, which are potential selling pressure zones. A rebound to those levels will encounter significant resistance.
In terms of key support and resistance levels, the first support is at 64,800, which aligns with the 1-hour MA5 and MA10 convergence area. The second support is near 64,400, which is the 4-hour MA30 position and also serves as the support band for the daily MA30. The first pressure point above is at 65,200, which corresponds to the 15-minute MA30 position. The second pressure zone is between $65,600 and $65,800, where the previous rebound highs are located. Going further up, there’s the critical psychological level of $67,000, which also has the maximum intensity of short liquidations.
In terms of trading strategies, the market is currently in a consolidating phase, so do not chase highs or panic sell. If the price retraces to the $64,800 to $64,500 range and establishes a 1-hour bottom formation or a long lower shadow signal, one can consider a small long position, setting a stop loss below $64,200, with target levels at $65,200 and $65,600. If it breaks $65,600, one may continue holding with a target of $67,000. If the price directly breaks through $65,600 with volume and stabilizes after a retracement without breaking, a long position can also be taken, with a stop loss set below $65,200, targeting $67,000. For short positions, if the price rebounds to the $65,600 to $65,800 range and forms a top formation or a long upper shadow, a small short position can be taken, with a stop loss above $66,000 and target levels of $64,800 and $64,400. However, it is crucial to note that there is a $412 million short liquidation wall above $67,000, and once broken, shorts should exit decisively and not hold on to positions.
Risk Warning: Currently in a consolidation range, false breakouts are frequent. Strict stop losses and position control should be observed, and do not over-leverage in betting direction.
Follow Qinglan Crypto Classroom to seize more trading opportunities! Visit the official website www.qinglan.org
📊 Qinglan TPV Trading Strategy Backtest Reference
🕒 Last Backtest Time 08-10 07:00:02
Total Analysis: 3467 Backtests: 3463 Accuracy: 80.9% (2800/3463)
免责声明:本文章仅代表作者个人观点,不代表本平台的立场和观点。本文章仅供信息分享,不构成对任何人的任何投资建议。用户与作者之间的任何争议,与本平台无关。如网页中刊载的文章或图片涉及侵权,请提供相关的权利证明和身份证明发送邮件到support@aicoin.com,本平台相关工作人员将会进行核查。