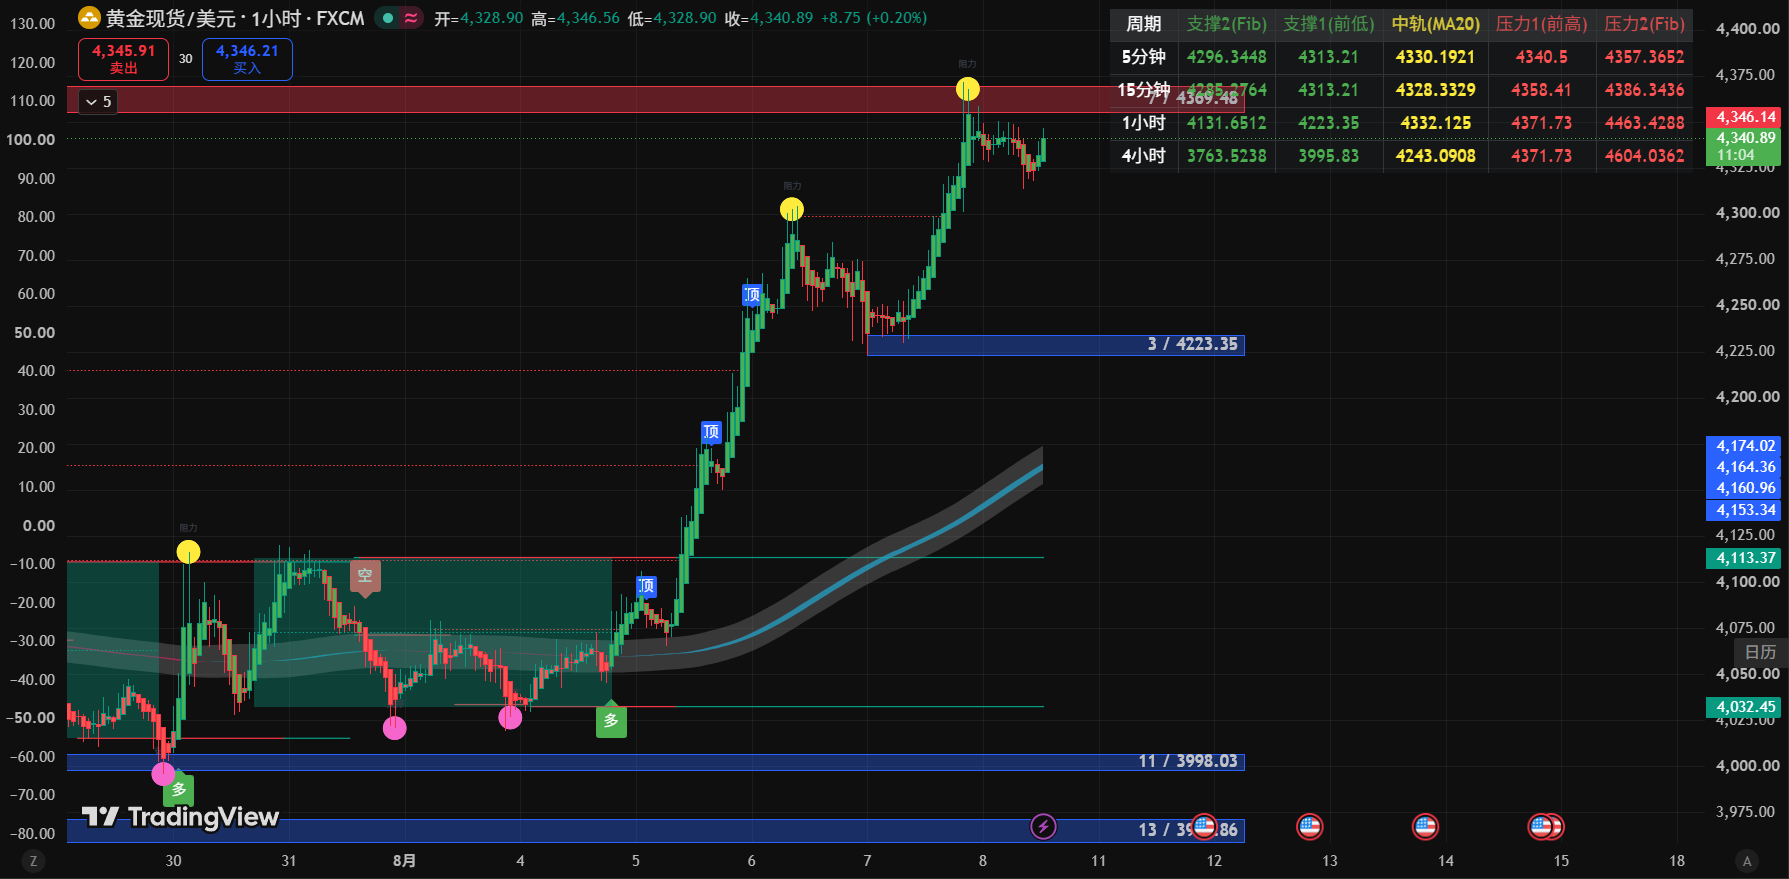
1-hour K-line chart
1. News: Non-farm payrolls supportive digestion and profit-taking resonance at high levels
In the last 24 hours, the international gold market entered a consolidation phase after last week’s strong rally, with the following core influencing factors:
Non-farm data bearish for the dollar, bullish for gold (bullish): The market continues to digest previously weak employment data and Fed rate cut expectations, with long-term safe-haven and anti-inflation funds maintaining demand for gold allocation.
Profit-taking at high levels emerges (bearish): After gold prices reached a historical high of $4371, some short-term highly leveraged funds and profitable investors chose to exit to lock in profits, leading to increased technical selling pressure.
Geopolitical sentiment temporarily stabilizes (neutral to bearish): There are no further deteriorating geopolitical events in the short term, with market sentiment shifting from risk aversion to technical correction.
2. Technical aspect: Highs show topping signals, short-term adjustments face correction
Based on the reference chart's 1-hour K-line chart, key technical indicators analysis:
K-line shape and movement: Gold previously surged from 4060, reaching a peak of $4371 and showing a “nine-turn sequence (green 13)” topping signal at high levels. Following this, it consistently closed with bearish candles, with the latest quote at $4325.26.
Moving average system (MA):
MA5 (4330) and MA10 (4334) have formed a dead cross at the top, with prices operating below the short-term moving averages.
MA30 (4303) is becoming the first core lifeline support for the current price rebound.
MA52 (4286) remains flat upward, the overall big trend for bulls has not been broken, but the short-term has entered a fluctuating correction/retracement pattern.
Key support/resistance levels:
First resistance level: $4371 (previous segment peak).
First support level: $4300 - $4303 (1-hour MA30 moving average and integer level).
Second support level: $4280 - $4286 (1-hour MA52 strong support zone, i.e., “resistance-support swap zone”).
Fluctuation indicator (RSI): The bottom RSI2 is 55, RSI3 is 59. The indicators have completely fallen back from the previous overbought area to the neutral zone of 50-60, showing that short-term bullish momentum has weakened and bears dominate in the short term.
3. Operating strategy: Blindly chasing long positions is strictly prohibited, wait for correction support to stabilize
1. Specific point suggestions
Initial buying point (buy low): $4295 - $4300 (lightly test long positions while stabilizing at MA30 without breaking below $4290).
Main additional position point (strong support long): $4280 - $4290 (confirm stabilization by bouncing off MA52 strong support zone).
First take-profit target: $4330 - $4335.
Strict stop-loss point: $4275 (falling below $4275 means breaking the hourly upward trend line, must firmly stop loss).
2. Position management strategy
Total position control: Suggested to control within 10 of total funds.
Batch positioning: Test 5% position near $4300, add another 5% upon stabilization at $4285, strictly avoid high-level bottom fishing.
4. Risk warning and response plan
High-level bearish drop risk:
Risk performance: After hitting $4371 triggering TD13 signal, if the $4300 level is breached, it may trigger a series of stop-loss squeeze, quickly probing down to the $4250 area.
Response plan: Strictly prohibit holding positions without stop-loss, must set a hard stop-loss below $4275 after entering long positions.
Narrow range washout risk:
Response plan: Wait for the 1-hour K-line to confirm a bullish candle indicating the end of the drop before manually intervening, avoid blindly catching knives in large bearish candles.
免责声明:本文章仅代表作者个人观点,不代表本平台的立场和观点。本文章仅供信息分享,不构成对任何人的任何投资建议。用户与作者之间的任何争议,与本平台无关。如网页中刊载的文章或图片涉及侵权,请提供相关的权利证明和身份证明发送邮件到support@aicoin.com,本平台相关工作人员将会进行核查。