Last Friday, the U.S. non-farm payroll data unexpectedly fell short of expectations, with a decrease of 23,000 jobs instead of an increase, which raised market expectations for the Federal Reserve to keep interest rates unchanged. All three major U.S. stock indices rose sharply; however, Bitcoin did not benefit from the stock market's rally, continuing to consolidate around the $65,000 mark, indicating that the short-term decoupling phenomenon between the cryptocurrency market and traditional risk assets is still ongoing.
As of the week ending August 7, Bitcoin spot ETFs accumulated inflows of $853 million, marking the largest weekly net inflow since mid-April this year. This influx of funds initially shows that institutions are gradually regaining strong interest in Bitcoin after experiencing intense selling pressure in the first half of this year.
The market focus will shift to the U.S. Consumer Price Index for July, which will be released on August 12. This key economic indicator may further affect market expectations regarding the Fed's monetary policy, thereby influencing the capital flow and price trends of Bitcoin ETFs.
Last week, Bitcoin reached a peak of $65,772 on July 27, with a low of $62,231. As of the time of writing, the quote stands at $65,000, while Ethereum's 14-day high was $1,981 and the low was $1,821, currently priced at $1,917.
Bitcoin four-hour chart
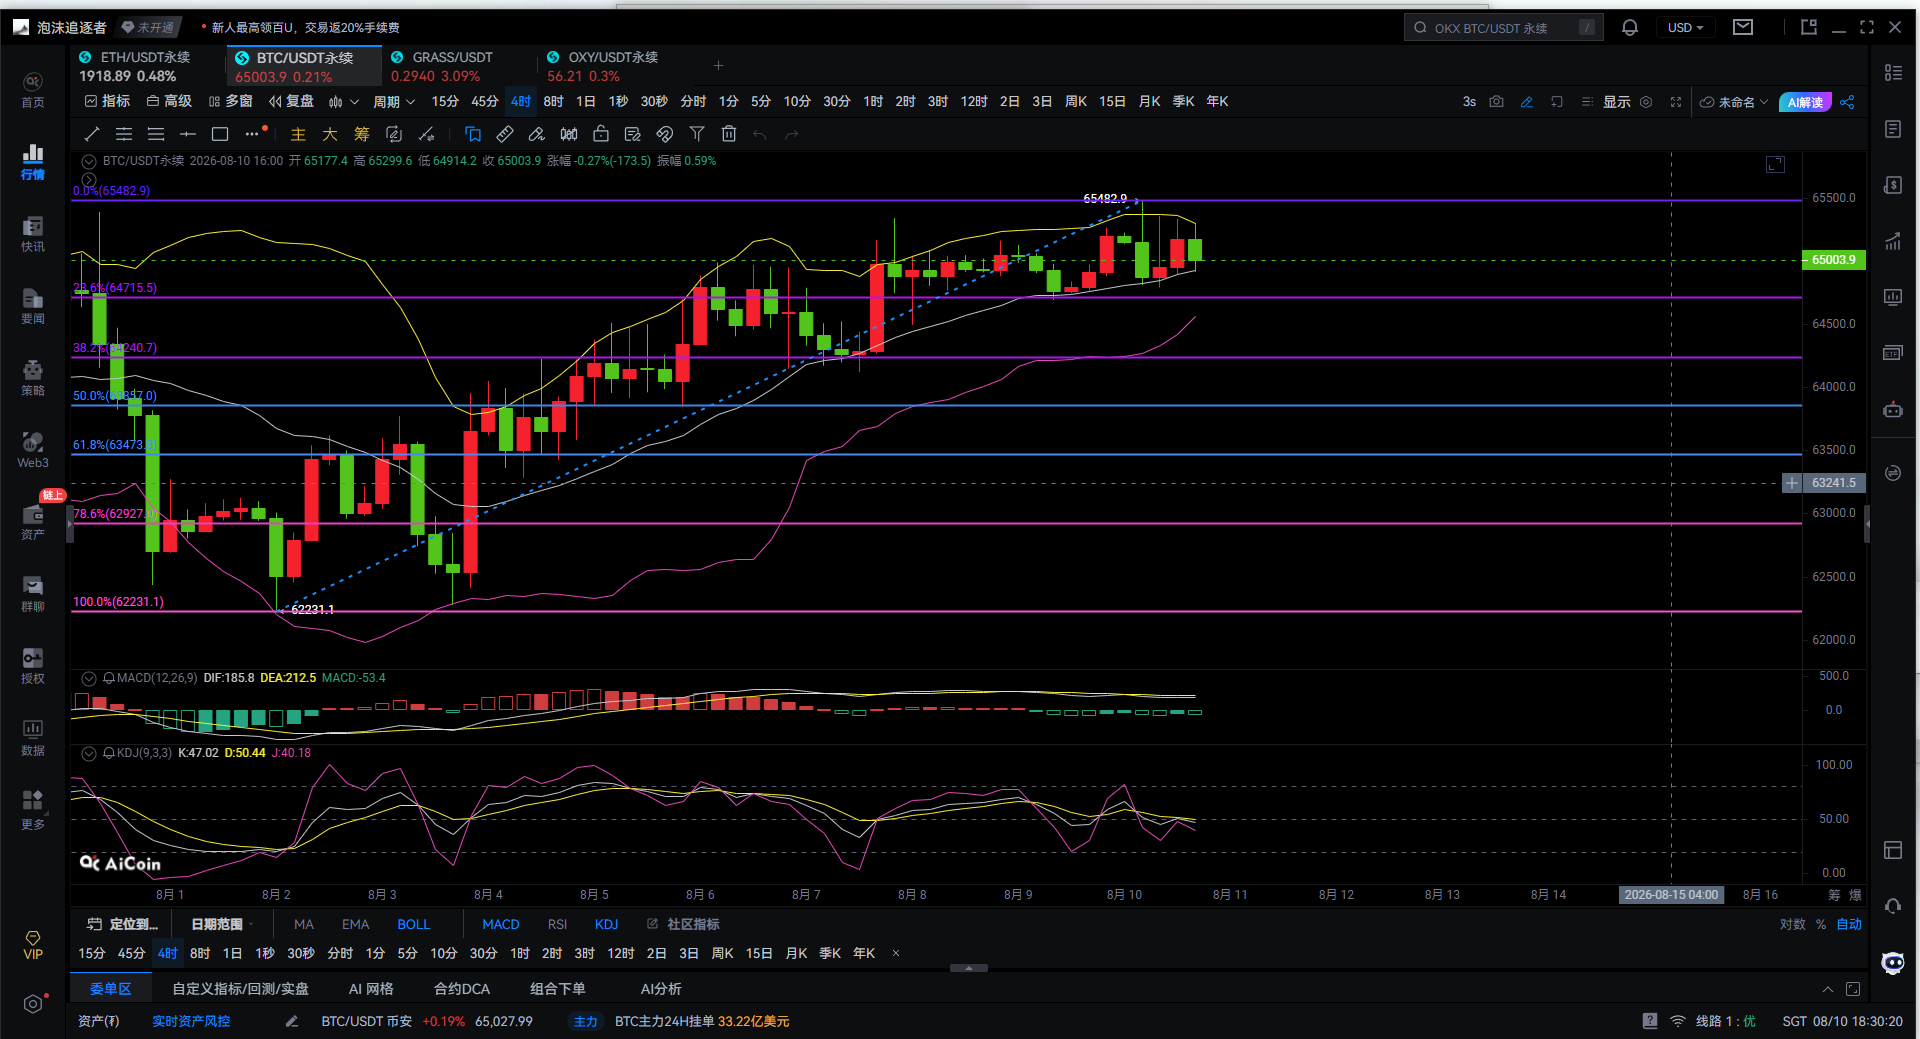
Now, looking at this four-hour chart of Bitcoin, let me give you a clear conclusion: the upward rebound trend is still present, but it has begun to stall in the short term and is entering a phase of oscillation and adjustment. Next, we need to focus on whether the price can stabilize around $65,000, and whether it can break past the key level of $65,480.
1. Fibonacci: Key levels clearly marked
This wave of rebound rose from around $62,231 to about $65,483, and the price is currently hovering around $65,000. By drawing Fibonacci retracement lines, the key positions are clear:
Near $65,483: This is a strong short-term resistance level and also the previous high point. Only by breaking through it can new upward space be opened up.
Near $64,762: This is the 23.6% retracement support level and the most important dividing line between bulls and bears in the short term. Whether it can be held depends on this point.
Near $64,241: 38.2% retracement support level. If $64,762 cannot hold, it is highly likely to retest this level.
Near $63,857: 50% retracement level, also an important dividing line of strength and weakness for this round of rebound.
I personally think that as long as the $64,762 level is not effectively broken, the four-hour rebound structure is not completely ruined. However, if it breaks down and fails to recover by closing, we need to be cautious in the short term as it may continue to explore the area between $64,240 and $63,850.
2. MACD: The strength of the upward movement is clearly weakening
The MACD indicator, although still above the zero line, has clearly shown a reduction in the red bars, and the DIF line has started to weaken. What does this indicate? The bulls haven’t completely died out, but after reaching a high, it is evident that momentum has diminished. Therefore, at this position, we must not blindly chase after rising prices. Especially above $65,000, if there is no rising volume and it cannot break through $65,480, a high followed by a retreat is very likely.
3. KDJ: Short-term bias towards correction
The KDJ indicator has now started to turn down from its previous high, with the K, D, and J lines overall pointing downwards, indicating that short-term bullish sentiment is cooling off. My understanding is simple: this is not a strong unilateral rally, but rather a situation where profit-taking needs to be digested after the rise. The next likely step will be to first oscillate, even retest support, and then decide the next directional move.
4. BOLL: Price hits the upper band and starts to fall back
Bitcoin has been rising along the upper Bollinger band, but has started to fall back after being pressured near the upper band. Although the overall trend of the Bollinger Band is still upward, in the short term, the price has begun to gravitate towards the middle band. This means: the upward trend remains, but there is a need for a pullback to confirm support.
The first scenario: strong tendency
As long as Bitcoin holds above $64,760 and then reclaims $65,000, effectively breaking above the $65,480 to $65,500 range on the four-hour candlestick, there remains a chance for this rebound to continue rising and challenge higher positions.
The second scenario: oscillating downtrend
If $64,760 fails to hold, MACD continues to produce a death cross downward, and KDJ continues to weaken, then we need to watch the support around $64,240. In extreme cases, it could even retest near $63,850.
Conclusion from the expert
At this position, I do not recommend blindly chasing long positions above $65,000. Although the overall trend is still a rebound structure, the short-term indicators have begun to weaken. The best approach is to keep an eye on the support level at $64,760 and the resistance level at $65,480.
If it stabilizes above $64,760 and shows signs of consolidation, we can continue to look for rebounds; a breakout above $65,480 would signify that real upward space has opened up; if it breaks below $64,760, it’s better not to hold on to long positions and to prepare for a pullback to $64,240.
In summary: the trend is "mostly bullish, but short-term is at risk of correction." It’s better to wait for a pullback than to chase high; follow the trend after a breakout.

It’s better to give you a correct mindset and trend than to provide you with a 100% accurate suggestion; teaching a man to fish is better than giving him a fish; advice can make a quick profit, but learning the mindset earns a lifetime!
Written on: (2026-08-10, 18:30)
(Article - Expert Commentary) Disclaimer: There is a delay in online publication; the above suggestions are for reference only. Investment carries risk; please be cautious when entering the market!
免责声明:本文章仅代表作者个人观点,不代表本平台的立场和观点。本文章仅供信息分享,不构成对任何人的任何投资建议。用户与作者之间的任何争议,与本平台无关。如网页中刊载的文章或图片涉及侵权,请提供相关的权利证明和身份证明发送邮件到support@aicoin.com,本平台相关工作人员将会进行核查。