Academician of the Coin Circle: On August 19, the surface of Ethereum (ETH) is sideways consolidation, but the essence is the reshuffling of long and short positions! Latest market analysis reference
The current price of Ethereum is 1917, it can't go up, nor can it go down deeply, back and forth hitting stop losses, holding long positions fearing a plunge, and shorting fearing a direct breakout. The current market is a typical consolidating and grinding market, with no clear signals for the general direction. Many people always think about catching the big trend and frequently open and close positions, resulting in repeated losses in a consolidating market. Don’t always focus on short-term fluctuations of a few hundred points; in a consolidating market, chasing highs and cutting losses is the most taboo; controlling your hands is more important than anything else.
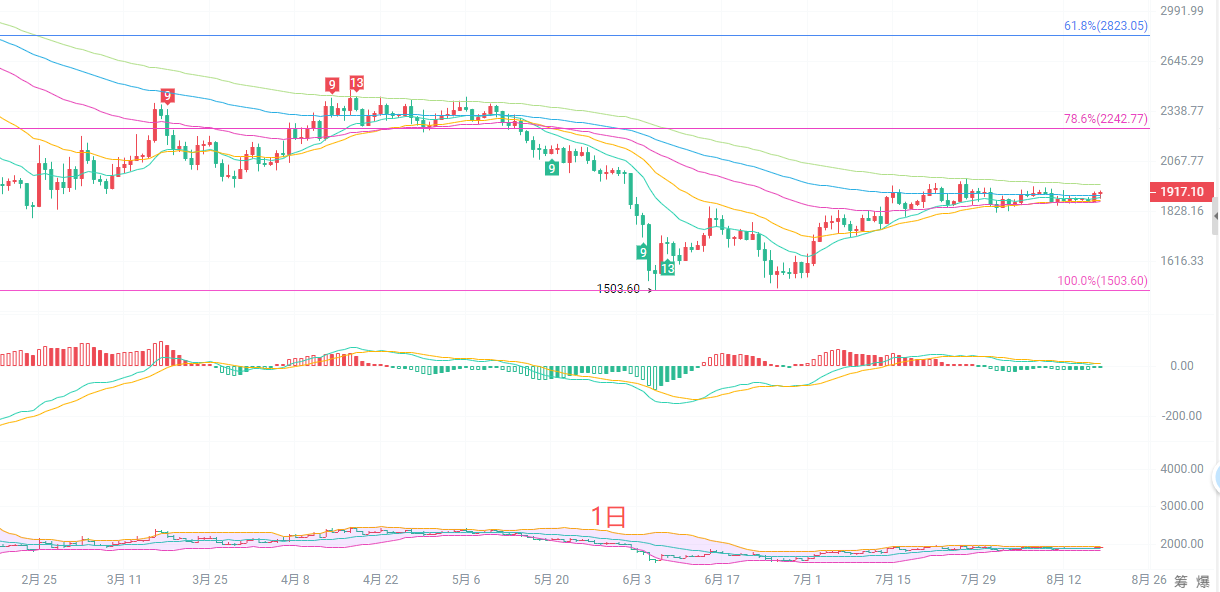
The daily K-line is overall in a low-level repair and consolidation range after a downturn. The moving averages are intertwined and flattening; the 15, 30, and 60-period EMAs are conjoined, indicating that the forces of bulls and bears are relatively balanced, and no clear one-sided trend has formed. The Bollinger Bands are narrowing, with prices running close to the middle band. The MACD indicator's DIF and DEA are conjoined near the zero axis, and the red bars are slightly increasing, with bulls having a slight advantage, but the upward momentum is insufficient. Key resistance above is in the 1930-1950 range, which is an important short-term resistance level. Only by firmly standing above this range will the daily line open up further rebound space; core support below is at 1845-1870. An effective drop below this level will damage the daily rebound structure and restart the downward probing.
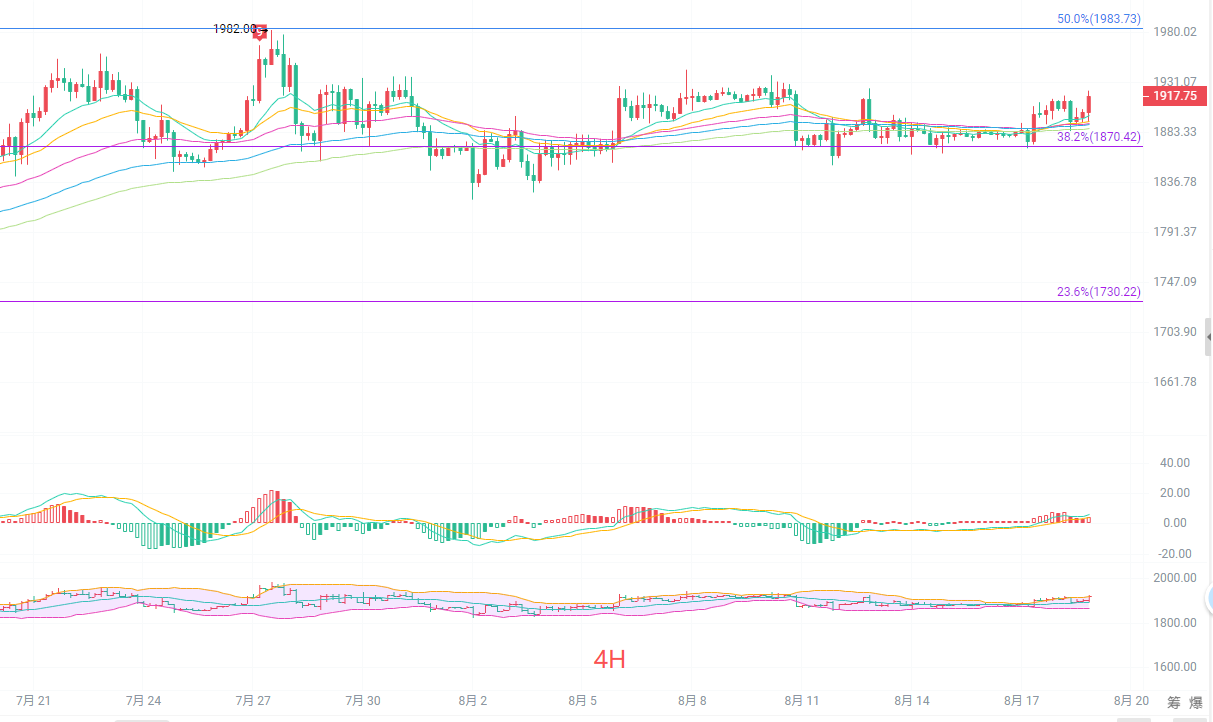
The four-hour K-line is running above multiple EMA moving averages, showing a short-term bullish arrangement, indicating a strong consolidating pattern. The 4-hour Bollinger Bands are flattening, with prices oscillating running close to the upper band, with short-term pressure at 1922-1930, which is the previous high point position that has been tested multiple times without effective breakthroughs, representing strong resistance. The MACD indicator's DIF remains above the DEA, with the red bars slightly releasing, but not continuously enlarging, indicating that bullish momentum has weakened. Support below looks at 1870-1890, which is at the Fibonacci 38.2% level, and also a densely packed support zone for the 4-hour moving averages. As long as it does not drop below this range, the strong consolidating structure of the 4-hour chart will be maintained; if it breaks below, it will turn towards a correction.
Short-term reference:
Adding long positions around 1890 to 1870, with a stop loss of 50 points, targeting 1925 to 1945.
Adding short positions around 1945 to 1965, with a stop loss of 50 points, targeting 1900 to 1885.
Specific operations should be based on real-time market data. For more information, you can consult the author; there may be delays in article publication, so suggestions are for reference only and risks are self-borne.

Kind reminder: The above content is solely created by the author for the official account. Advertisements at the end of the article and in the comments section have nothing to do with the author. Please discern carefully. Thank you for reading.
免责声明:本文章仅代表作者个人观点,不代表本平台的立场和观点。本文章仅供信息分享,不构成对任何人的任何投资建议。用户与作者之间的任何争议,与本平台无关。如网页中刊载的文章或图片涉及侵权,请提供相关的权利证明和身份证明发送邮件到support@aicoin.com,本平台相关工作人员将会进行核查。