Good morning teammates, I am Qinglan. Today's market is quite interesting. BlackRock has directly handed a report to institutional investors stating that a traditional 60-40 portfolio with 1% to 2% in Bitcoin can improve annualized returns and Sharpe ratios, paving the way for mainstream funds to enter the market. On the other hand, the mining company Canaan has been quietly doing big things, increasing its holdings to 1917 BTC, ranking 35th among the top 100 holders. Miners are not selling coins but instead accumulating them, naturally reducing selling pressure in the market. The combination of these two pieces of news has set a slightly warm tone for today’s market, but whether the price can hold will depend on the technical indicators.
The current time is 10:47 AM on August 19, with Bitcoin priced at 64414 USDT. The 24-hour increase is only 0.31%, and the low volatility is quite dull, but low volatility often means a trend change is approaching, so we need to stay alert.
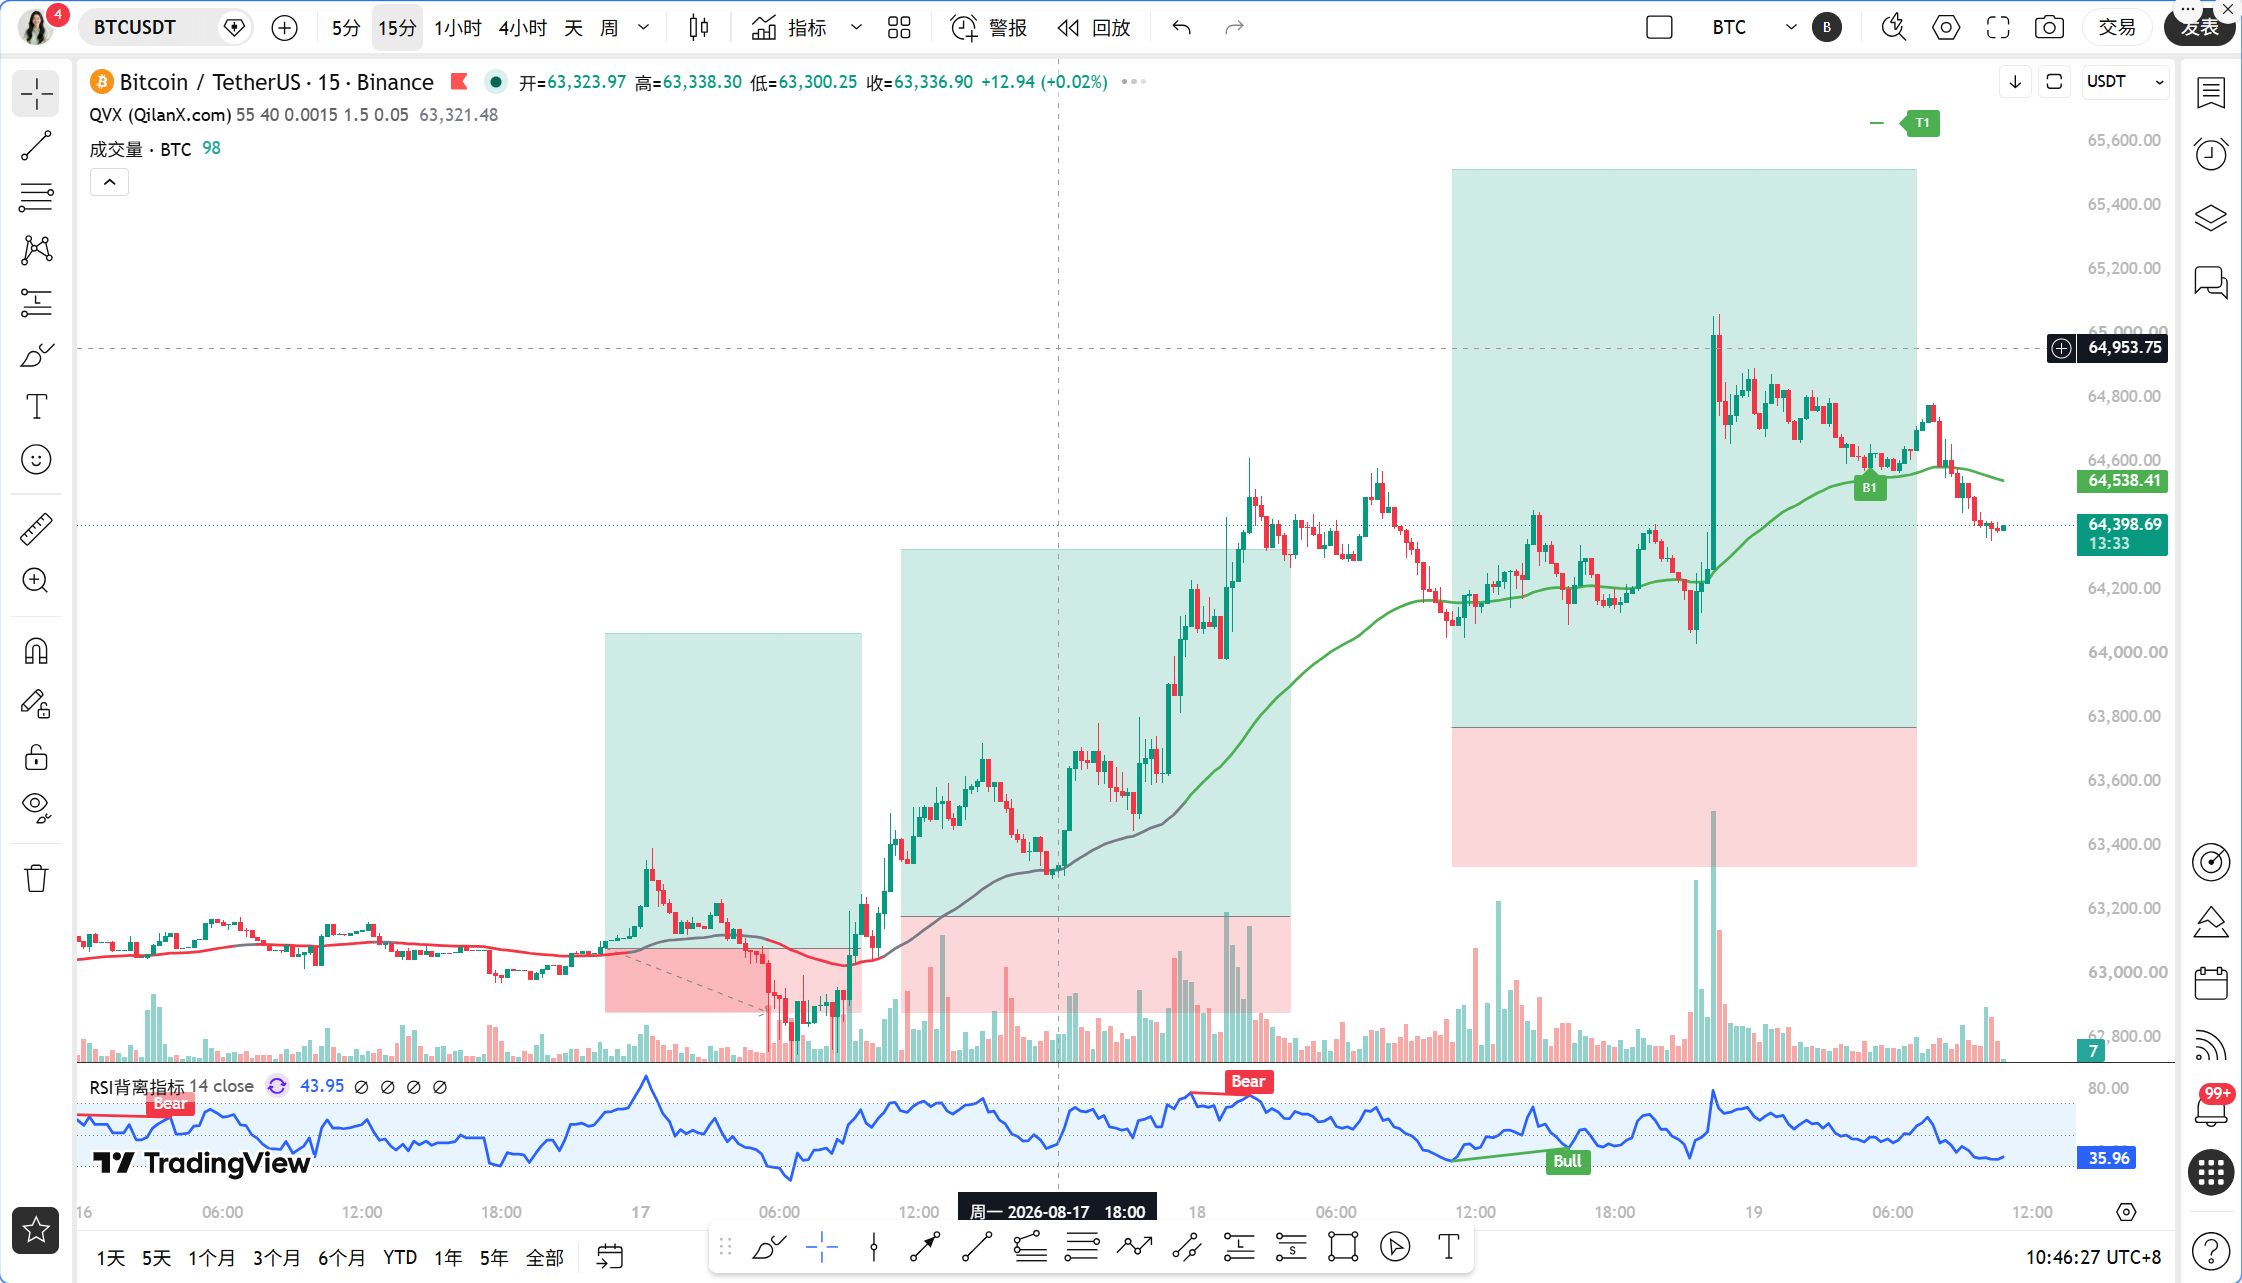
Let’s take a look at the larger time frame. The daily MACD histogram has turned red, the DIF and DEA are below the zero axis but the distance is narrowing. The RSI is at 47.62, which is in a neutral, slightly corrective state. The MA5 and MA10 have turned upwards, while the MA30 is forming short-term support around 64201, indicating a bullish consolidation pattern on the daily structure. The 4-hour level is clearer, with the MACD histogram at 102.74 remaining positive, the DIF well above the DEA at 326, and the RSI at 68.83, close to the overbought area. The MA5 and MA10 are in a bullish arrangement, confirming an upward trend in the 4-hour chart. However, the 1-hour level is beginning to show divergence, with the MACD histogram turning negative, the DIF crossing below the DEA forming a death cross, and the RSI dropping to 55.73, suggesting that short-term momentum is weakening. The 15-minute level shows it more clearly, with the RSI crashing to 24.32, severely oversold. The MACD histogram is also expanding in negative territory, indicating a short-term rebound may be needed, but the strength is questionable.
Now, let's use the Qinglan TPV system to validate the signal. The core rule is the 1-hour EMA55, currently at 64132. The current price of 64414 is above the moving average, and the closing prices of the past 8 1-hour candles have all remained above the EMA55, with zero cross-throughs. The price deviation from the moving average is 0.44%, which does not meet the criteria for a consolidation range, indicating a one-sided bullish trend area. However, the conditions for buying require three elements to be met simultaneously: First, the price must stabilize above the EMA55; this is achieved, as the last 8 candles have remained above it. Second, support must stabilize; currently, there hasn't been a long lower shadow or bottom formation, with the price hovering around 64400, and the support signal is unclear. Third, falling momentum must exhaust; are the 15-minute and 1-hour MACD histograms shortening? They are not; the 15-minute histogram is still expanding in negative territory, and the 1-hour is also weakening, so the momentum exhaustion signal does not hold. Therefore, the TPV system currently does not provide an active buy signal. The trend direction is bullish, but the short-term pullback risk is accumulating, and we need to wait for a stabilization signal before entering the market.
On-chain data indicates that the fear and greed index is unknown, but the BTC market share is at 56.56%, showing that funds are still circulating within mainstream coins. The increase in holdings by mining companies and public companies financing for coin purchases represent solid buying pressure. The SEC's relaxation on fundraising thresholds has opened the green light for compliant funds. All of these are medium-term favorable signs. However, do not overlook bearish factors: gold has dropped below 4350 USD, and a retreat in safe-haven assets may divert part of Bitcoin's safe-haven demand. The Philadelphia semiconductor index plunged by 5%, and a correction in U.S. tech stocks may trigger a correlated decline in risk assets. These external variables could interrupt the rebound rhythm at any time.
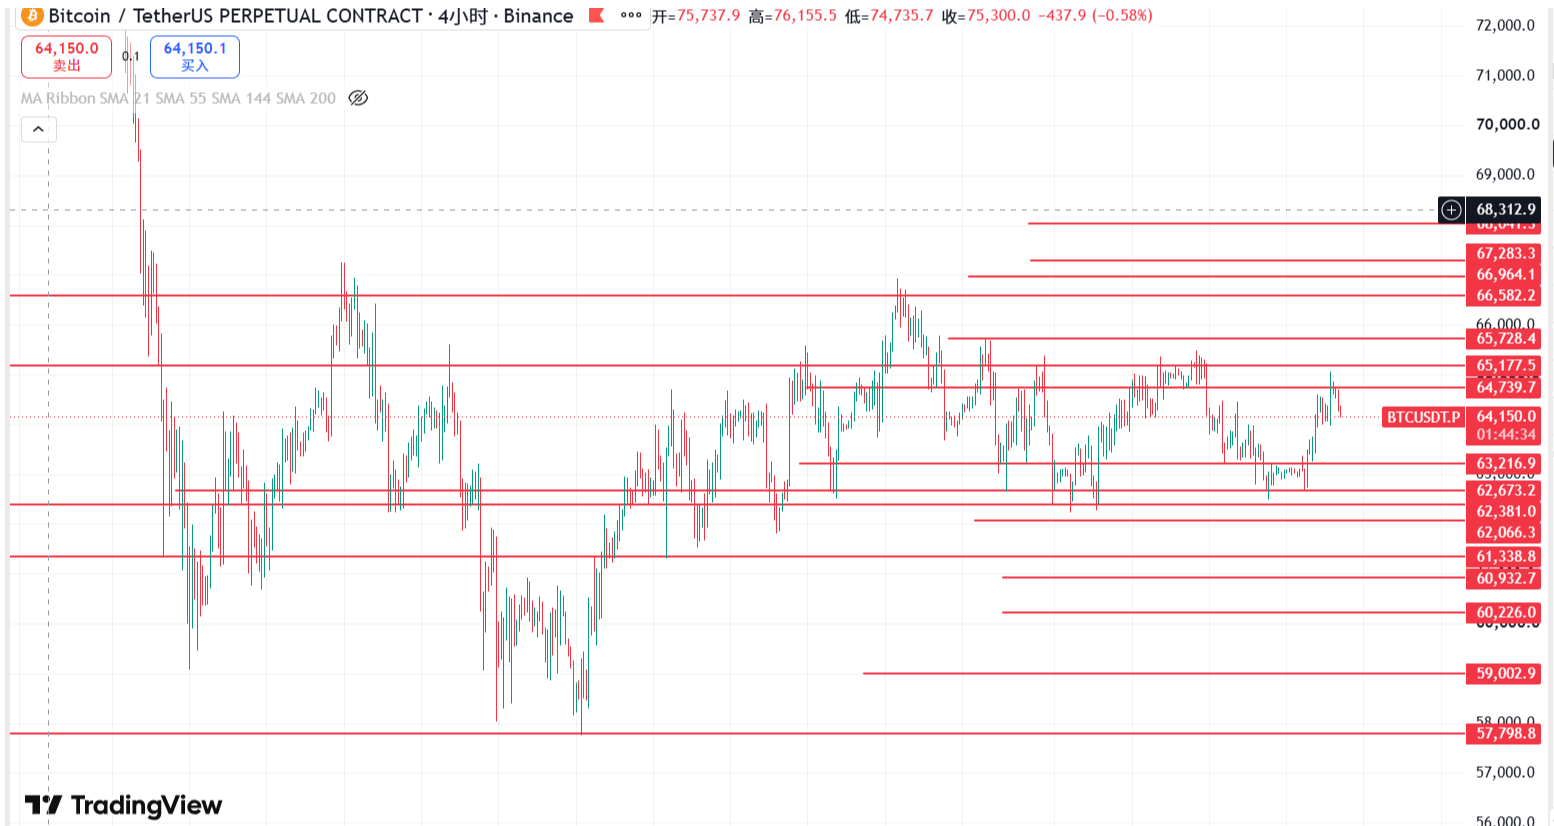
Regarding key defensive positions, the first resistance is at the $65000 psychological level, which triggered the liquidation of 56 million shorts after a brief touch yesterday, indicating a significant accumulation of short stop-loss orders at this position. A breakout could accelerate upward movement. The second resistance lies in the range of 65500 to 66000, an area of previous concentrated trading activity. The first support is at 64132, which corresponds to the 1-hour EMA55, serving as the dividing line between bulls and bears; as long as the daily close does not fall below this level, the bullish structure remains intact. The second support is around 63500, corresponding to the resonance area of the 4-hour MA30 and the daily MA30, which, if retraced to here, could actually provide a good position for medium-term layout.
As for the trading ideas, I have two scenarios. The first scenario is to buy on a pullback, with a bullish outlook. The entry conditions are to wait for the price to pull back to the range of 64100 to 64200, while looking for bottom formation or a long lower shadow in the 1-hour chart. The MACD histogram should show two consecutive bars of reduction, and the RSI should rise from the oversold area back above 30. Once these three conditions are met, we can enter the market. Place a stop loss at 63800 and target 65000, with a follow-up at 65500 after a breakout. The second scenario is to chase long on a breakout. If the price breaks through 65000 with increased volume and holds above for more than 30 minutes, we can directly follow up, placing a stop loss at 64600 and targeting 66000. If the price falls below 63800, it indicates a loss of EMA55 support, and the bullish logic is broken; in that case, we should remain sidelined and avoid catching falling knives.
The risk warning is simple: in a low-volatility environment, false breakouts are frequent, and any one-sided signal must wait for K-line confirmation; don’t be fooled onto the train by a big bullish candle.
Follow Qinglan's crypto class, and let's seize more trading opportunities together! Welcome to visit the official website www.qinglan.org
📊 Qinglan TPV Trading Strategy Backtest Reference
🕒 Last backtest time 08-19 07:00:01
Total analysis: 3608 Backtest: 3603 Accuracy: 79.8% (2876/3603)
免责声明:本文章仅代表作者个人观点,不代表本平台的立场和观点。本文章仅供信息分享,不构成对任何人的任何投资建议。用户与作者之间的任何争议,与本平台无关。如网页中刊载的文章或图片涉及侵权,请提供相关的权利证明和身份证明发送邮件到support@aicoin.com,本平台相关工作人员将会进行核查。