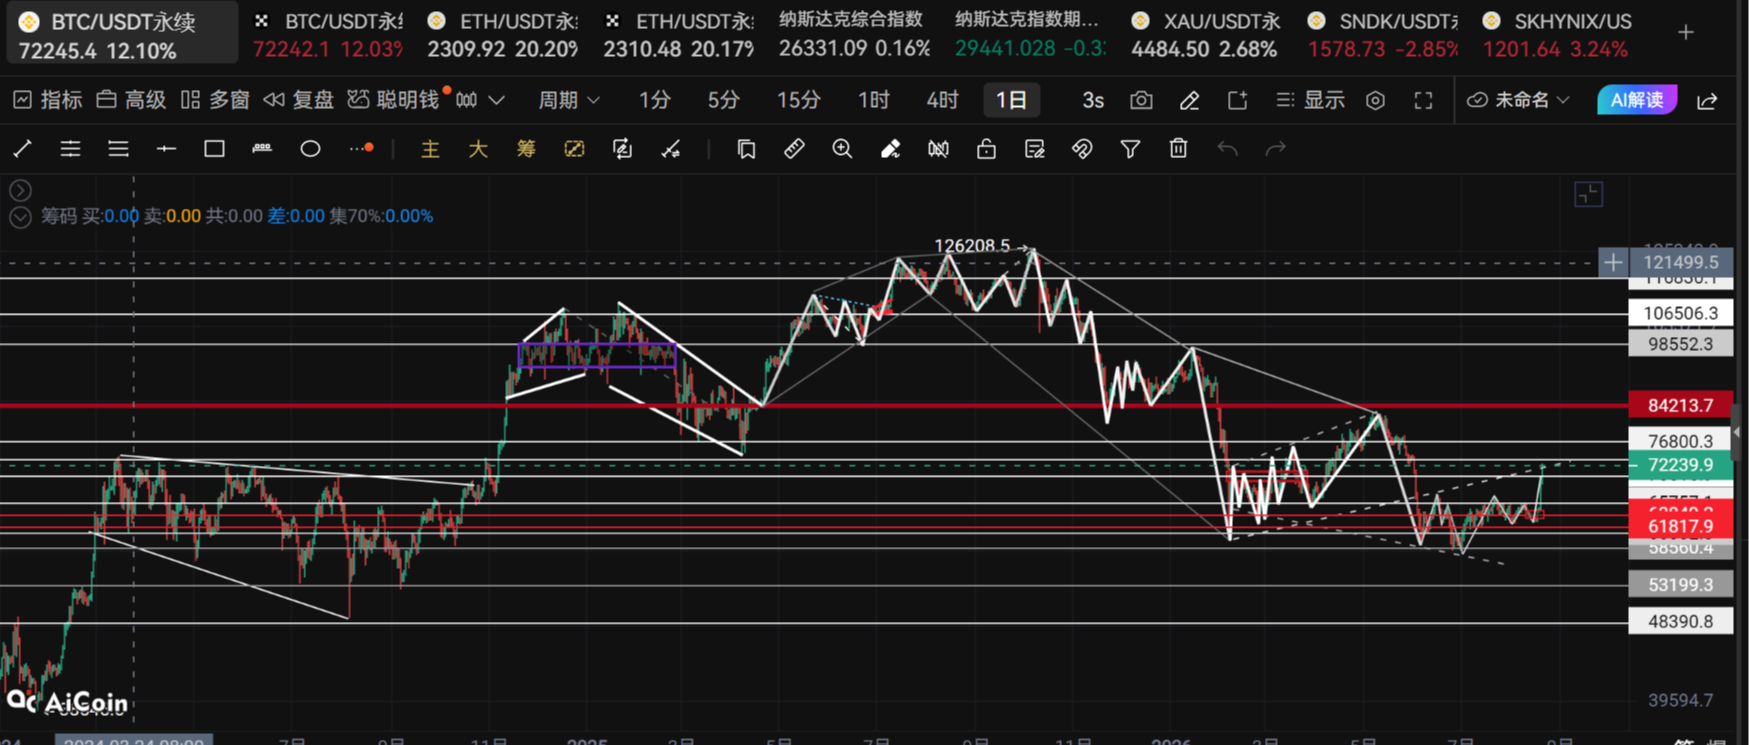
The current short-term structure of Bitcoin is showing a certain degree of repair, with prices having broken through the previous day's high of $64,600 and once reaching around $65,057.
However, this increase is more pronounced on the hourly and 4-hour charts, while the larger trends on the daily and weekly charts have yet to complete a true reversal. Therefore, at this stage, it is more appropriate to define the market asan upward correction within a range, rather than concluding that a new upward trend has been established.
The two most important levels to watch are the lower $64,600 and the upper $65,800—$66,000.
1. Hourly Breakthrough of $64,600, Short-term Structure Begins to Upgrade
On the evening of August 18, after the U.S. stock market opened, Bitcoin experienced a rapid rise, briefly touching around $65,057, and breaking directly through the daily high of $64,600 from the previous day.
This level had previously been an important resistance for the market, thus this breakthrough holds certain significance.
From the hourly structure, before the breakthrough, the price retraced to the area around $63,900—$64,000 before reclaiming that ground and gradually forming an upward advancing structure.
Although the price has pulled back slightly from above $65,000, it continues to operate around $64,800.
Therefore, what truly needs attention in the short term is not whether $65,000 can be broken instantly, but ratherwhether it can convert the $64,600 level from a resistance to a support after breaking through.
If $64,600 can complete an effective main force swap, the short-term structure will become even stronger.
2. 4-hour Level: The Breakthrough Has Occurred But Needs Confirmation
From the 4-hour structure perspective, Bitcoin dipped to around $62,700 early on August 17 but quickly rebounded, bringing the price back above $63,400.
Afterward, the 4-hour level formed a series of higher structures, and although there were retracements, $63,800 was not effectively broken further down.
With the price breaking upward past $64,600 again, the short-term structure has clearly improved.
However, a breakthrough does not mean the market will immediately accelerate.
What truly needs confirmation at the 4-hour level is:whether it can stabilize above the $64,600 level after the breakthrough.
If the price can regain support after a retracement to $64,600 and continue pushing toward $65,000—$65,500, then the upward continuity will be further enhanced.
Conversely, if the price drops back to $64,300 or lower, then the validity of this upward breakout will need to be reassessed.
Daily sharing of real-time trading strategies, offering free position diagnosis, closing strategies, and market practical insights. Scan the QR code to follow the official account“Bitcoin Watermelon”,join the community for strategies!
3. Daily Chart Shows Significant Repair, a Bullish Candlestick Recovers Several Days of Losses
The changes in the daily structure are even more noteworthy.
On the previous trading day, Bitcoin opened near $62,800 and ultimately surged to around $64,500, forming a very obvious bullish candlestick.
More importantly, this bullish candlestick essentially recaptured the losses from several consecutive previous trading days.
From a structural viewpoint, after a series of declines in the market, prices began to repair upward again. After August 14, the market gradually freed itself from pressure at the previous lows, and then rose continuously.
The rise on August 18 further broke through $64,600.
However, we cannot directly conclude that the daily trend has fully reversed just because of this bullish candlestick.
The reason is simple:
There is still significant pressure above at $65,000—$65,500, while $65,800—$66,000 is a more critical pressure zone on the weekly chart.
Thus, we are still in the daily repair phase, and the trend has not been entirely confirmed yet.
Daily sharing of real-time trading strategies, offering free position diagnosis, closing strategies, and market practical insights. Scan the QR code to follow the official account“Bitcoin Watermelon”,join the community for strategies!
4. $65,800—$66,000 is the Level That Determines Whether the Market Can Further Expand
From the weekly structure view, Bitcoin is still within a larger range of fluctuations.
The key lower zone is around $63,200, while the upper is concentrated at $65,800—$66,000.
The market has previously tested this range multiple times upward but has failed to form an effective breakout.
Thus, if the price can stabilize above $64,600 and continue moving toward $65,800—$66,000, then the real important test is just beginning.
A particular condition needs to be observed:
After breaking through $65,800—$66,000, the price cannot fall back below this range after a retracement.
If a breakthrough, retracement confirmation, and further upward movement can be achieved, it means the previously larger fluctuation range may be effectively broken, and the market has the opportunity to enter a new ascending phase.
Conversely, if the price fails again in the $65,800—$66,000 area, it is likely to revert back to operating within the fluctuation range.
Therefore, it is not necessary to hastily judge the final direction but to wait for critical positions to provide answers.
5. No Matching Increase in Open Interest, This is the Most Cautious Part Right Now
Although the price has broken through $64,600, there has not been a significantly ideal synchronous increase in open interest.
Normally, if the price breaks an important resistance while open interest significantly increases, it usually indicates new funds are entering the market, thus enhancing the continuity of the breakout.
But this situation is different this time:
While the price rises, open interest has actually decreased.
This suggests that there are notable positions exiting during the current upward process.
This could involve short-covering or some long positions taking profits.
Especially since the distance from $65,000—$65,500 to $65,800—$66,000 is very close, it makes sense for some longs to take profits at this point.
This also explains why the price can continue to test upward, but the rate of increase has not significantly accelerated for the time being.
Therefore, the biggest contradiction now is not whether the price can continue to rise, but rather:
Prices have begun to rise, but whether capital and positions can keep up.
If the price continues to rise and open interest increases again, the credibility and continuity of the breakthrough will be notably enhanced.
If the price continues to rise but open interest keeps decreasing, then it’s necessary to guard against a return to a range after a spike.
Daily sharing of real-time trading strategies, offering free position diagnosis, closing strategies, and market practical insights. Scan the QR code to follow the official account“Bitcoin Watermelon”,join the community for strategies!
6. Moving Averages Structure Begins to Improve, Support Gradually Forms Below $64,600
From the daily moving averages, the 5-day, 7-day, 20-day, and 60-day moving averages are gradually converging, and the short-term moving averages are also showing signs of turning upward.
Currently, the more important support area is gradually centralizing around $63,800—$64,000.
And what’s most noteworthy above is the 90-day moving average, currently located around $65,000.
This is also why it has not been easy to break through $65,000.
The 90-day moving average is often seen as an important mid-term lifeline in technical analysis. If the price can truly stabilize above it, it will positively impact subsequent trend repairs.
Thus, $65,000 is not only a round number but also a resistance area formed by moving average pressure and the previous price structure.
7. Bollinger Bands: Short to Medium Term is Bullish, But 4-hour Has Reached the Upper Band
Bollinger Bands have shown some positive changes as well.
After the daily mid-band breakthrough, the price did not fall back below it, and the bandwidth has started to slightly expand.
This indicates that market volatility is gradually recovering.
At the 4-hour level, several candlesticks have been running above the mid-band, and the current price is gradually approaching the upper band.
Therefore, the signals from the Bollinger Bands still lean toward an upward release.
However, when prices reach the upper band, we should not simply interpret it as a guarantee of continued increases.
What warrants more observation is:
whether prices can continue to operate near the upper band and achieve further breakthroughs through consolidation.
If this can be achieved, the upward momentum will significantly strengthen.
Daily sharing of real-time trading strategies, offering free position diagnosis, closing strategies, and market practical insights. Scan the QR code to follow the official account“Bitcoin Watermelon”,join the community for strategies!
8. Vegas Channels: The Hourly and 4-Hour Charts Have Strengthened
From the Vegas Channels perspective, the hourly line has broken through the 144 and 169 moving averages, as well as the 676 and 576 slow channel lines.
Currently, these levels are gradually becoming support.
Especially around $63,800—$64,000, multiple moving averages and channels show significant resonance.
The 4-hour level has also shown similar changes, with the 144 and 169 moving averages gradually opening up, shifting the overall structure toward a bullish orientation.
This suggests that as long as $63,800—$64,000 is not effectively broken down, there are conditions for the 4-hour level to continue testing $66,000.
The daily chart is relatively lagging and still in the repair process.
Therefore, it can be understood that:
the hourly chart has turned bullish, the 4-hour has clearly improved, the daily is in repair, and the weekly is still in a large range of fluctuations.
This is currently the most accurate cycle structure.
9. MACD and DMI are Improving Together, But Large Cycles Have Not Completed a Reversal
Regarding MACD, the hourly chart has formed a golden cross above the 0 axis, while the 4-hour chart also maintains a bullish repair state.
Although the daily chart has formed a golden cross, it remains below the 0 axis.
This implies that short-term momentum has significantly recovered, mid-term is strengthening, but the daily level cannot yet confirm a true trend reversal.
DMI is showing a similar structure.
The PDI on the hourly and 4-hour levels is once again above the MDI, favoring the bulls, and the ADX has also shown some degree of repair.
However, the daily remains weak, and the ADX is at a low level.
Thus, it cannot be simply interpreted that the market has entered a strong trend phase.
A more accurate definition is:
Short-term bulls are dominant, short to medium term momentum is repairing, and large cycles are still in fluctuation repair.
Daily sharing of real-time trading strategies, offering free position diagnosis, closing strategies, and market practical insights. Scan the QR code to follow the official account“Bitcoin Watermelon”,join the community for strategies!
10. RSI Has Reclaimed 50, But Still Needs Time for Confirmation
In terms of RSI, the hourly and 4-hour levels have regained the 50 axis, indicating that the structure of strength and weakness in the short to medium term has clearly favored the bulls.
The daily level has also reclaimed above 50, but currently, it has only shown one significant repair candlestick, so we still need to observe whether it can stabilize.
The weekly chart has not yet completed an effective breakout.
This means that the current market still needs to open up layer by layer.
A breakout on the short-term does not mean an immediate reversal of the daily trend; improvement on the daily does not mean that the weekly chart will immediately enter a main rising phase.
The market requires time to complete the transmission between cycles.
11. ATR Indicates That Short-term Fluctuations of Several Hundred Dollars Are Normal
From the 4-hour ATR, the normal fluctuation range is still several hundred dollars.
Therefore, the price falling from $65,000 to around $64,500, or even briefly dipping below a certain support, does not necessarily mean that the structure has been compromised.
What truly matters isthe closing position.
Especially in the current ranging market, intraday spikes and brief breakouts are very common.
So do not immediately judge the market as bearish just because the price briefly dropped below $64,600 by a few dollars.
What needs to be observed is where the 4-hour and daily lines ultimately close.
Daily sharing of real-time trading strategies, offering free position diagnosis, closing strategies, and market practical insights. Scan the QR code to follow the official account“Bitcoin Watermelon”,join the community for strategies!
12. The Current Key Positions Are Very Clear
Integrating multiple cycles and indicators, the key positions can now be clearly delineated.
Upper Resistance
$64,800: the first level of short-term resistance.
$65,100: resistance from the hourly and daily resonance.
$65,400—$65,500: a more important short to medium-term resistance area.
$65,800—$66,000: the core resistance at the weekly level, and a key area determining whether the large range can break upward.
Lower Support
$64,600: currently the most important breakthrough conversion point.
$64,300: near the 4-hour Fibonacci 0.618, also an important position for judging whether this upward breakout fails.
$63,800—$64,000: support formed by multiple indicators, including moving averages and Vegas channels.
If the price continues to operate above $64,600, then the short-term structure remains strong.
If it falls below $64,300 and re-enters that area, then the judgment of the current upward volatility will need to be significantly lowered.
13. The Most Likely Future Movement: Range-Bound with a Slight Upward Bias, Look to $65,100 First
Considering the current price structure, moving averages, Bollinger Bands, MACD, DMI, RSI, and open interest, I lean towards maintaining aslight upward movement in a range scenario.
The first target remains near $65,100.
If the $65,100 level breaks, then I will look to $65,400—$65,500.
The true dividing line for strength is at $65,800—$66,000.
But it should be emphasized that:
there is no clear confirmation of an obvious increase in open interest alongside the current price rise.
Thus, this market can continue to test upward, but we should not overly expect it to directly enter an accelerated upward phase.
If the combination of “price rising + open interest increasing again” occurs later, the continuity of the breakout will be significantly enhanced.
Conversely, if the price continues to rise while open interest keeps decreasing, more caution is needed to guard against a return to range-bound trading after profit-taking by long positions.
Therefore, at this stage, the most important thing is not to guess whether the market will definitely rise or fall, but to observe the gains and losses at critical positions.
Whether $64,600 can hold is the dividing line for short-term strength; $64,300 is an important defense for the current upward structure; $65,800—$66,000 is the core pressure that determines whether the large cycle can really open up space.
As long as $64,600 can stabilize, the market will still have the conditions to test upward.
And once there is a true breakout above $65,800—$66,000, and a retracement that does not break, then the market structure will further upgrade from "repair" to "trend breakout".
Before that, a more reasonable approach is still:watch the repair, wait for confirmation, and do not prematurely conclude the trend.
Daily sharing of real-time trading strategies, offering free position diagnosis, closing strategies, and market practical insights. Scan the QR code to follow the official account“Bitcoin Watermelon”,join the community for strategies!

免责声明:本文章仅代表作者个人观点,不代表本平台的立场和观点。本文章仅供信息分享,不构成对任何人的任何投资建议。用户与作者之间的任何争议,与本平台无关。如网页中刊载的文章或图片涉及侵权,请提供相关的权利证明和身份证明发送邮件到support@aicoin.com,本平台相关工作人员将会进行核查。