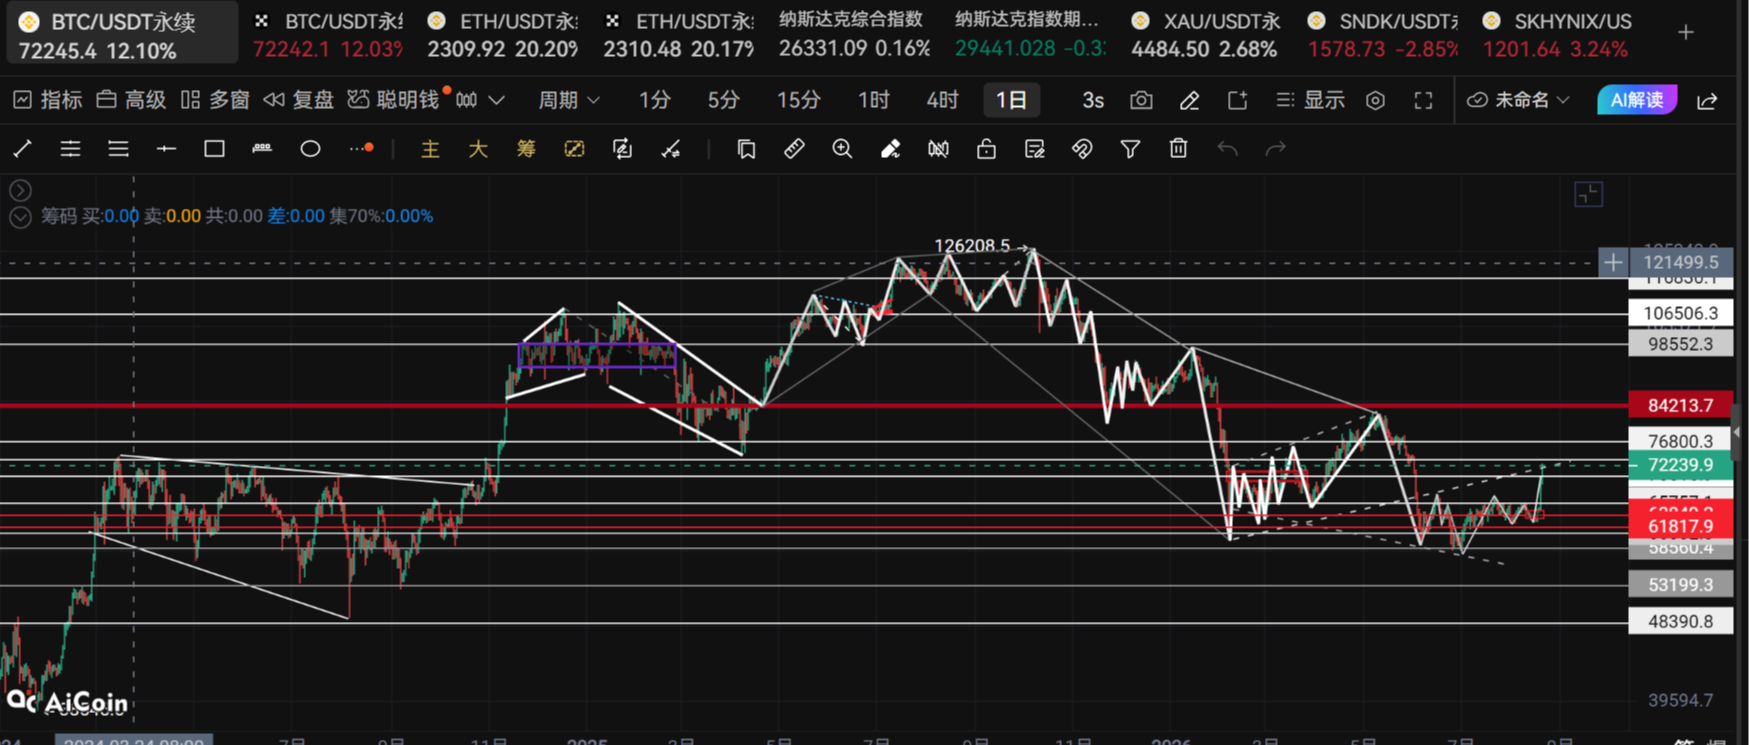
Academician of the Coin Circle: On August 20, Bitcoin (BTC) experienced a significant surge, rewriting the short-term pattern; should we be wary of a trap that lures bulls into a corrective phase? Latest market analysis and operational advice breakdown
Bitcoin is currently priced at 68,500. The market is always full of drama; not long ago, it was stuck at a low for an extended period, leading many to lose patience and cut losses, only to see a rapid rise afterward. Many friends are now torn, wondering whether this surge is the beginning of a new trend or just another pullback after a bullish false signal. Fear of chasing highs and missing out on a significant market move is the real dilemma for most traders at this time.
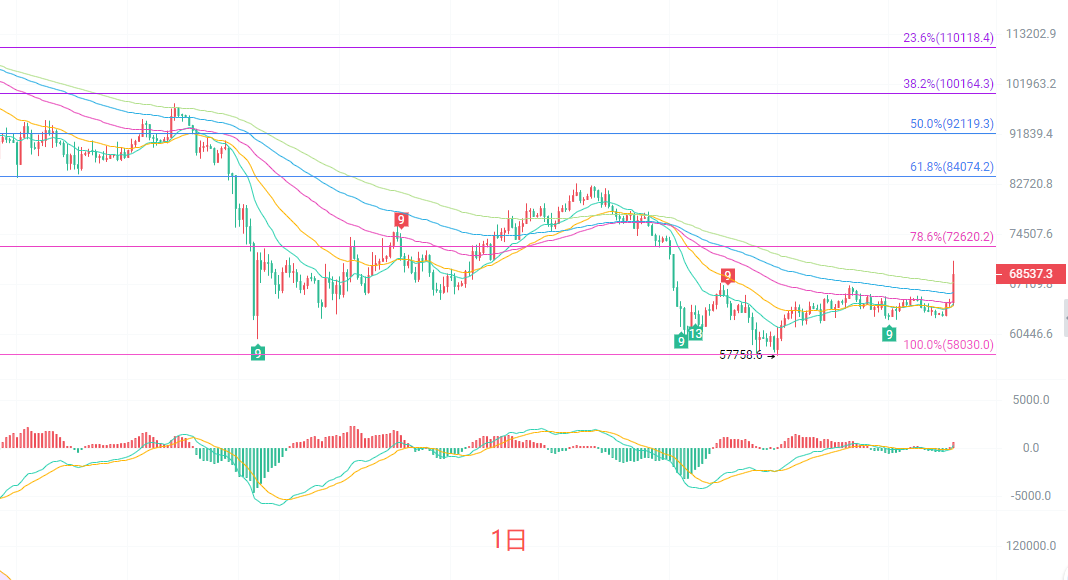
The daily K-line has shown a rebound from the previous low of 57,758, with the current price breaking above several EMA moving averages. The moving average system, which was previously diverging downward, is now flattening out. The mid to long-term moving averages still exert strong resistance above. The MACD indicator's DIF is approaching DEA upwards, and the green bars have contracted, turning red; bullish momentum has started to be released, but the strong volume surge phase has not yet been reached. The Bollinger Bands show signs of opening upwards, with the upper band pressure resting around 66,700 - 67,000. The current price has already risen above the upper band, indicating a short-term overbought situation. The important Fibonacci resistance is at 72,620, with the core support at 62,355. The larger bearish pattern on the daily chart has not completely reversed; this phase is more inclined towards a recovery rebound after a significant drop.
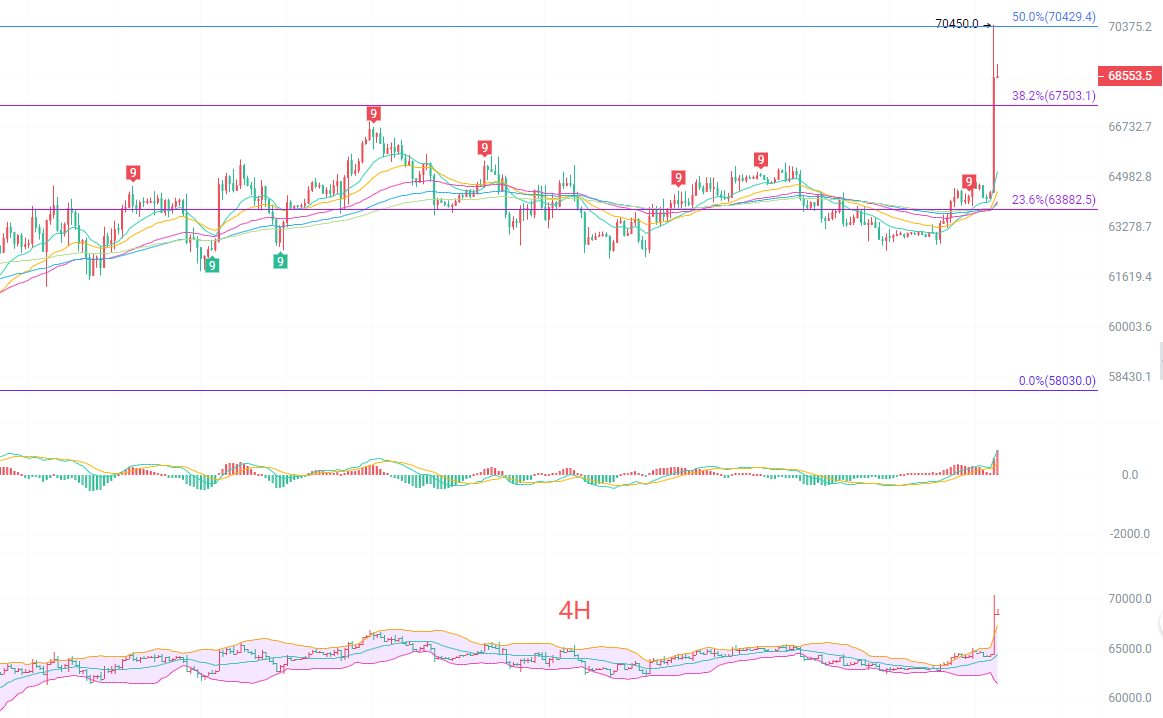
The four-hour K-line has directly broken through the upper edge of the previous consolidation range at 63,882, creating a large bullish candle that has completely shattered over a month of sideways movement. All short-term EMAs have turned upward, firmly supporting the price with a very clear bullish trend. The MACD has surged significantly upward, with the red bars continuing to expand, fully releasing bullish strength. The Bollinger Bands have opened upwards directly, with the price running outside the upper band, indicating a clear overbought condition in the short term. The first resistance is at 67,503, with further resistance at 73,355, and the support returns to the upper edge of the range at 63,882, which is a crucial watershed for this breakout. In the four-hour timeframe, the short-term bullish sentiment is dominant, but after a rapid surge, there is always a need for a pullback to digest profit-taking; caution is advised against blindly chasing prices upwards.
Short-term reference:
If the price stays above 65,000 to 66,000, set a stop loss at 500 points, with targets between 72,600 to 73,400.
If the price fails to break 73,200 to 73,500, set a stop loss at 500 points, with targets between 68,000 to 66,000.
Specific operations should rely mainly on real-time market data; for more detailed information, you can consult the author. There may be delays in the article publication; this advice is for reference only, and risks are to be borne by the reader.

Friendly reminder: The above content is only created by the author's public account. The advertisements at the end of the article and in the comments section are unrelated to the author; please discern carefully. Thank you for reading.
免责声明:本文章仅代表作者个人观点,不代表本平台的立场和观点。本文章仅供信息分享,不构成对任何人的任何投资建议。用户与作者之间的任何争议,与本平台无关。如网页中刊载的文章或图片涉及侵权,请提供相关的权利证明和身份证明发送邮件到support@aicoin.com,本平台相关工作人员将会进行核查。