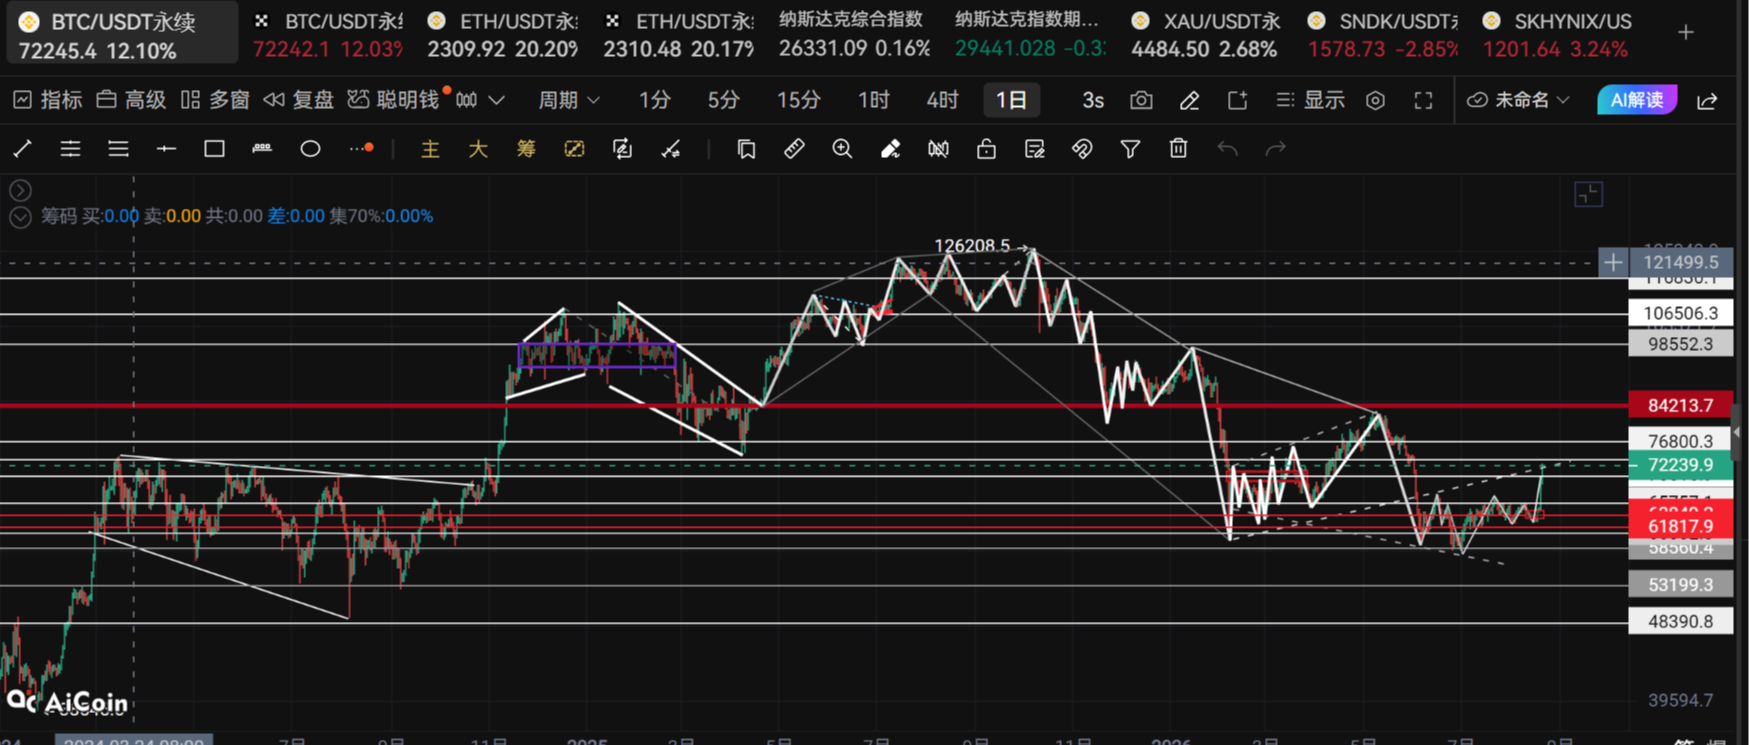
Cryptocurrency Circle Academician: After the big breakout of Ethereum (ETH) on August 20, has the real game of Ethereum just begun? Latest market analysis reference
The current price of Ethereum is 2080, a rapid rise brought it directly to around 2098, and many friends probably missed this rebound. After a long time of bottoming out at a low level, many people couldn't hold on and sold off, only for the market to suddenly gain momentum. That's how the market works; most profits are earned through endurance, not by chasing highs. Now many are in a dilemma, wondering if this wave is a reversal or a short-term trap; chasing in raises the fear of missing out, while not chasing raises the fear of missing the opportunity.
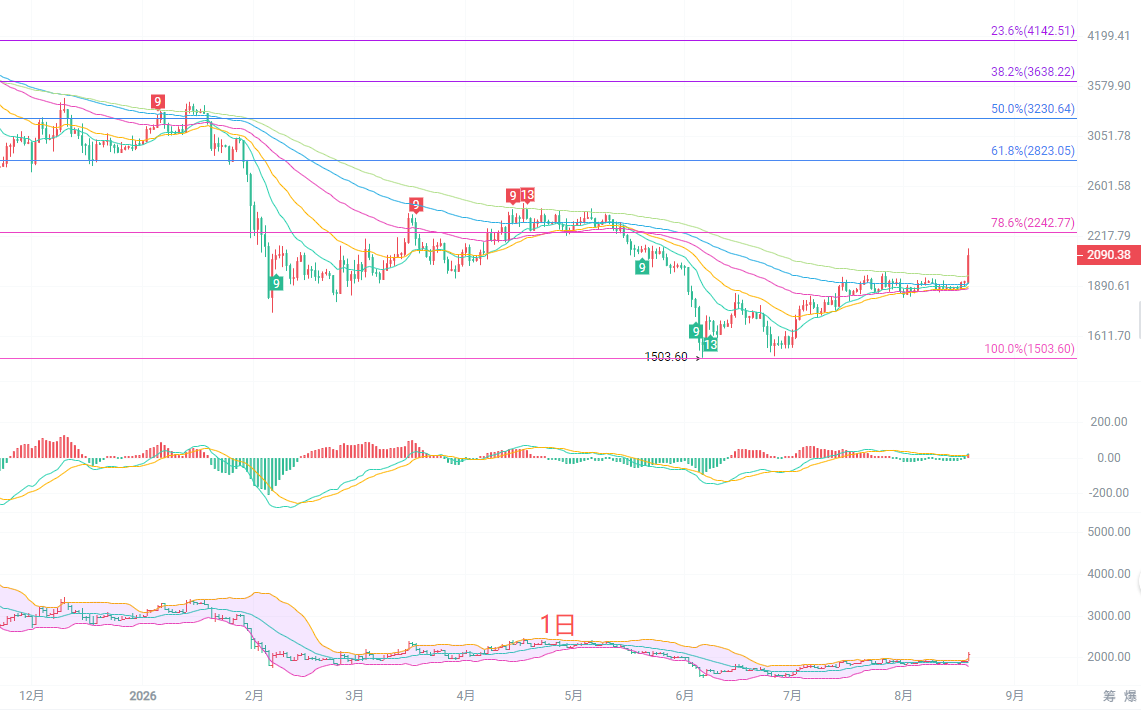
The daily K-line has started a rebound from the previous low of 1503, currently touching the Fibonacci 78.6% resistance near 2242. In the moving average system, the short-term EMA15 and EMA30 are turning upward, while the medium to long-term EMA60 and EMA90 are still in a downward trend, indicating that this is only a rebound and the larger trend has not fully reversed. The MACD indicator's red bars are continuously expanding, with the DIF turning upwards, indicating that bullish momentum is being released; the Bollinger Bands are opening upwards, and the price is above the upper band, currently in an overbought state. Strong resistance is at 2242-23300 above, and the first support area is at 1890-1900 below. If it cannot stabilize above 2242, it is likely to experience a rise followed by a pullback for correction.
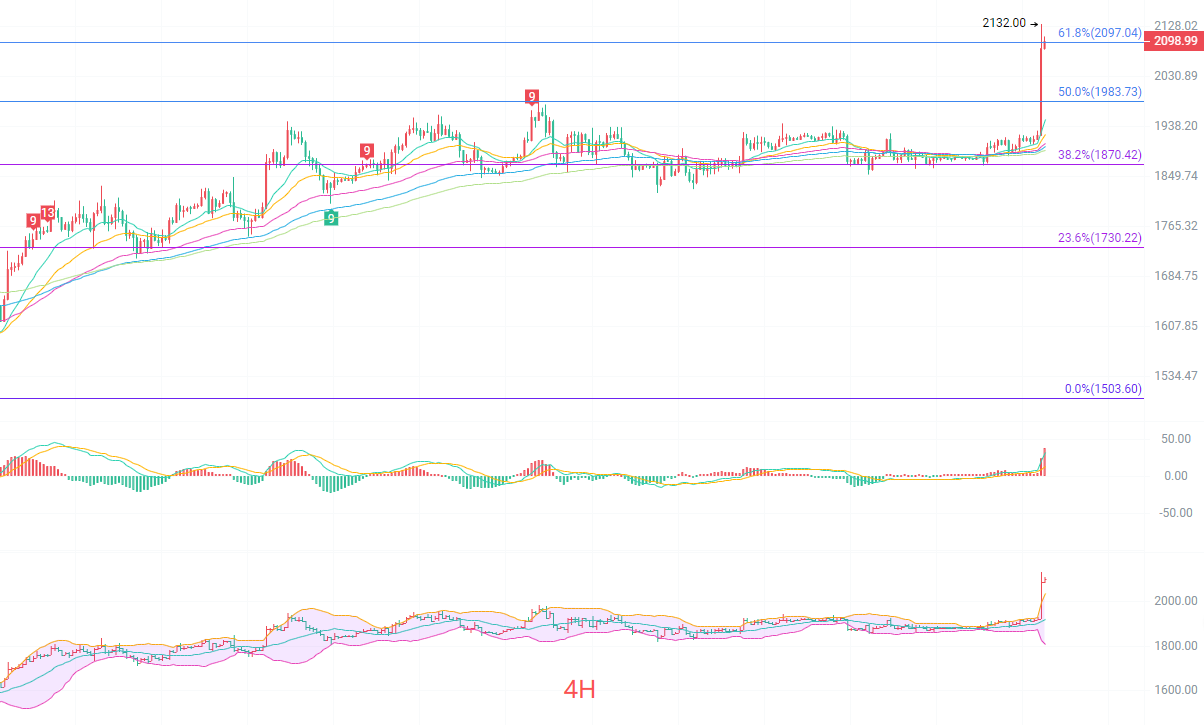
The four-hour K-line shows a strong bullish candle breaking through the previous consolidation platform, with a peak touching 2132. The Fibonacci 61.8% level is at 2097, and the price is currently hovering around this key resistance level. The short-term EMA moving averages are all in a bullish arrangement, with the price firmly above all averages, indicating a dominant bullish trend. The 4-hour MACD has quickly risen to a high position, with red bars significantly expanding, and the indicator has entered the overbought zone, presenting a risk of a top divergence correction. The Bollinger Bands are rapidly opening up, with the K-line running close to the upper band. Direct resistance is at 2130-2180 above, and key support is at 1980-2010 below, which is the upper edge of the previous consolidation platform. In the short term, avoid blindly chasing highs, as after a strong rise, it is easy for the four-hour level to show pullback actions to confirm support.
Short-term reference:
If it does not break 2010 to 1990 on the downside, go long, with a stop loss of 40 points, targeting 2130 to 2240.
If it does not break 2230 to 2250 on the upside, go short, with a stop loss of 40 points, targeting 2130 to 2020.
Specific operations should be based on real-time market data. For more information, please consult the author. There may be delays in publishing the article; suggestions are for reference only, and risks are borne by the reader.

Warm reminder: The above content is solely created by the author of the public account. Advertisements at the end of the article and in the comments section are not related to the author; please discern carefully. Thank you for reading.
免责声明:本文章仅代表作者个人观点,不代表本平台的立场和观点。本文章仅供信息分享,不构成对任何人的任何投资建议。用户与作者之间的任何争议,与本平台无关。如网页中刊载的文章或图片涉及侵权,请提供相关的权利证明和身份证明发送邮件到support@aicoin.com,本平台相关工作人员将会进行核查。