Author: @glassnode
Translation: Popular Blockchain

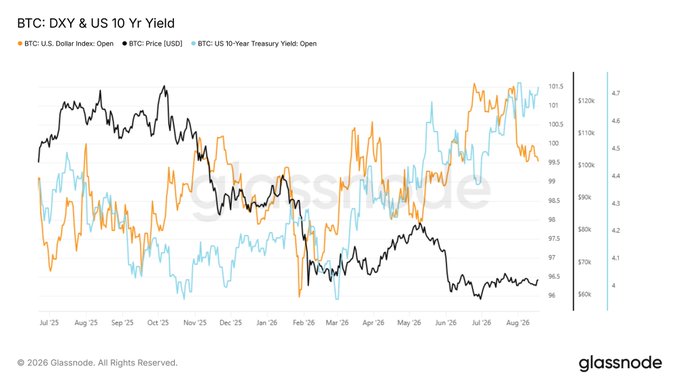
The weakening dollar failed to boost Bitcoin as the U.S. 10-year treasury yield climbed to around 4.7%, keeping the financial environment in a tightened state, and the high real yield has become the main macro resistance suppressing prices.
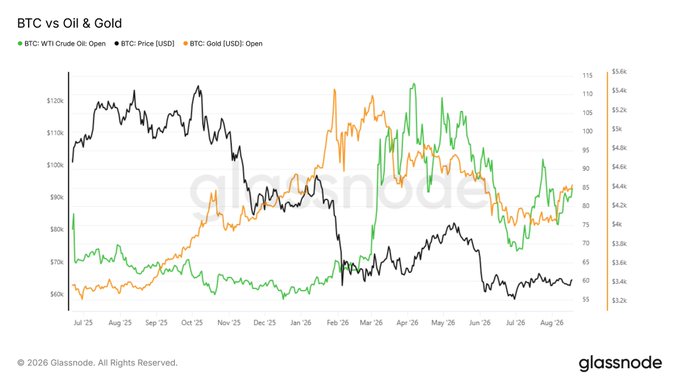
Gold remains around $4,400, while crude oil is hovering in the mid-80s, highlighting that Bitcoin has not participated in the broader buying of scarce assets. Its trading attributes still reflect a risk asset sensitive to liquidity, rather than an inflation hedge. Both spot prices and the short-term holder cost benchmark ($68,500) are below the real market average ($75,800), confirming that the market is in a capitulation phase, which means the turnover price is simultaneously below the holding costs for recent buyers and broadly active investors.
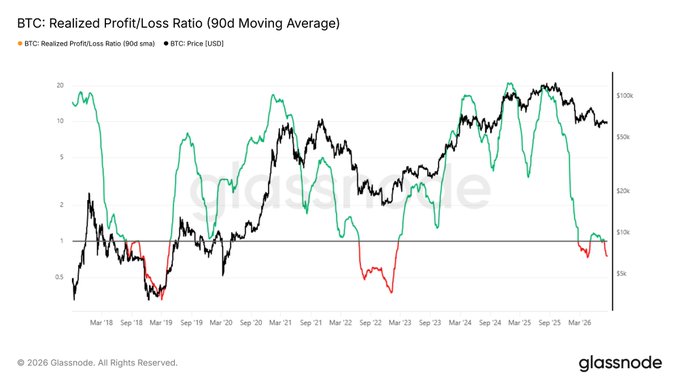
The relative unrealized loss peak is around 0.25 (previous cycles were above 0.6), indicating that this pullback is shallower and more widespread; meanwhile, the realized profit and loss ratio stands at 0.75, still above the historically marked level of less than 0.5 that signifies the exhaustion of selling pressure.
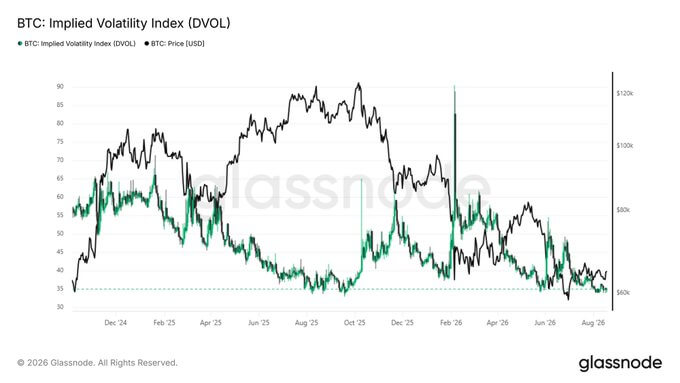
Demand for perpetual contracts has turned positive, and after experiencing a daily low of -5,000 BTC for ETF outflows, it has stabilized, but the persistently negative Coinbase premium and the drop in DVOL to the mid-30s indicate that spot participation and directional consensus are still both absent.
Macro Insights
The weakening dollar faces yield pressure
The macro environment Bitcoin faces is still full of contradictions. The dollar index (DXY) has fallen back from July highs, which usually benefits risk assets; however, the U.S. 10-year treasury yield continues to rise to about 4.7%. Bitcoin has yet to respond positively to the weakness of the dollar, with prices still anchored around the cycle low of $60,000 to $65,000.
This divergence indicates that the persistently high real and nominal yields are still the core macro constraints. They not only maintain a tight financial environment but also raise the opportunity cost of holding non-yielding assets. To create a more favorable macro backdrop for Bitcoin, weakening the dollar is not enough; it must also be accompanied by a sustained decline in U.S. treasury yields.
Bitcoin lags behind hard asset buying
This differentiation is also significant in hard assets. Gold lingers at around $4,400, crude oil rebounds to the mid-80s, while Bitcoin, after experiencing a sharp drop earlier this year, still remains in the $60,000 to $65,000 range.
This indicates that Bitcoin has not received funds flowing into scarce or inflation-sensitive assets and continues to appear as a risk asset sensitive to liquidity. To confirm a stronger macro recovery signal, we need to see Bitcoin begin to narrow the performance gap relative to gold and crude oil.
On-Chain Insights
Capitulation phase established
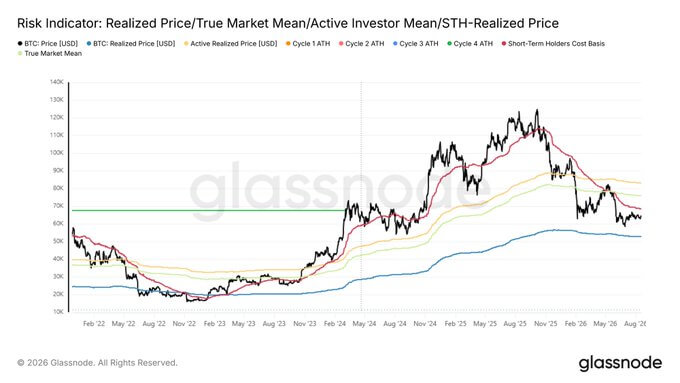
Shifting from macro context to on-chain valuation, the structural trend has been consistent since early February 2026 when prices broke below the real market average and short-term holder cost benchmark. This breakdown established the bear market pattern, indicating the trading prices of Bitcoin are below the holding costs of recent buyers and broadly active investors.
As the bear market deepens, the short-term holder cost benchmark has fallen to $68,500, below the real market average of $75,800, representing that current token turnover prices are below the holding thresholds for these two major groups. This structure is an essential feature of the capitulation phase, as historically, cycle bottoms often develop in this range. As long as prices remain below the short-term holder cost benchmark, on-chain valuation models will determine the market is in the capitulation period—new buyers accumulate with high certainty during this phase, but the overall market remains extremely fragile to adverse macro headwinds.
Shallower pain, longer bottoming
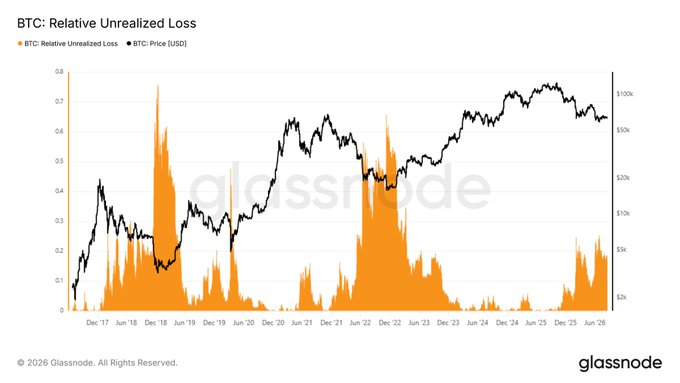
Since mid-May, the market has been in the capitulation range for almost three months, with a notable feature of this cycle being the intensity of investors' pain is relatively moderate. Relative unrealized losses (measuring the proportion of the total unrealized losses in the network to the total market cap, reflecting potential financial pressure) peaked in this round at only nearly 25%, far below the previous cycles' capitulation phase of over 60%. Thus, the severity of losses for trapped investors is less than in previous bear markets.
This partly reflects that the pullback so far has been shallower, but also because large supplies were absorbed at prices far below historical highs during the election period, making the upper selling pressure trapped positions distributed relatively evenly, rather than concentrated at the cycle top. The lower cost basis of the loss-prone tokens has eased overall pain, but it also means that digesting this dispersed upper trapped position will require more time, directly leading to the current sideways oscillation and prolonged bottoming.
No exhaustion, no bottoming
Experiencing a capitulation phase with only moderate pain leads to the core question: where is the ultimate pain point and when will the cycle bottom form? Accurately predicting the bottom is impossible, but the path towards exhaustion of selling pressure will likely involve a longer bear market duration, deeper price discounts, or both.
This cycle exhibits both characteristics: significant declines in the second half of January 2026 and in May, and it has operated in a confirmed bear market pattern for over seven months. The difference is that this capitulation phase has been shorter in duration and shallower in magnitude so far. Although bottoming characteristics have begun to appear, it is still uncertain whether macro catalysts will trigger a deeper round of decline in the coming months. Based on a 90-day moving average, the realized profit and loss ratio historically needs to drop below 0.5 to signal the exhaustion of cyclical selling pressure, while the current indicator is at 0.75. Before this indicator rises above the 2.0 key threshold again, any rebound should be viewed as a local uplift rather than a trend reversal.
Off-Chain Insights
The demand for perpetual contracts has turned positive
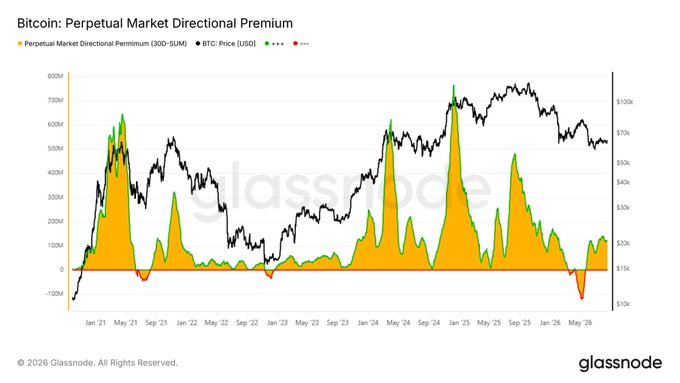
The 30-day perpetual contract market directional premium has significantly rebounded back into positive territory after briefly turning deeply negative during recent sharp declines. This indicates that leveraged traders are once again willing to pay a premium for long risk exposure, reflecting a significant improvement in speculative risk appetite.
However, compared to the extreme positive premiums seen in previous impulsive market conditions, current readings remain relatively mild. This shows that derivative positions have shifted to a bullish bias but have not yet reached a frenzy state. If prices can rebound more clearly, long positions still have room for further expansion.
U.S. spot demand has yet to enter the market
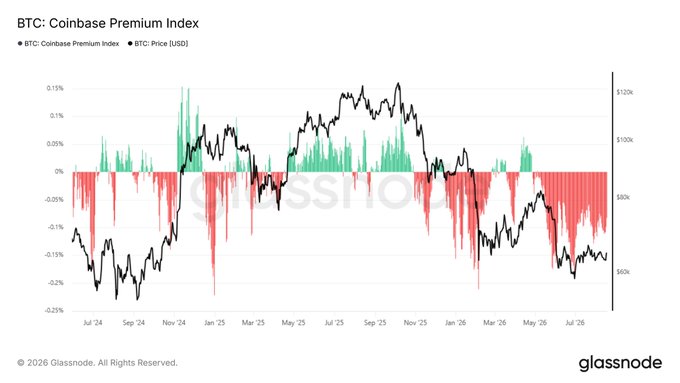
Although there has been some improvement in perpetual contract positioning sentiment, the Coinbase premium index remains negative, indicating that U.S. spot demand has not yet formed effective support. During most of the recent consolidation period, even when Bitcoin stabilized in the $60,000 to $65,000 range, the premium remained below the zero axis.
This has led to a clear divergence between the recovering leveraged risk appetite and the sluggish spot participation. Only if the Coinbase premium continuously returns to positive territory can it strongly prove that the market recovery is driven by real U.S. spot accumulation and not solely reliant on derivatives.
After significant outflows, ETF funds stabilize
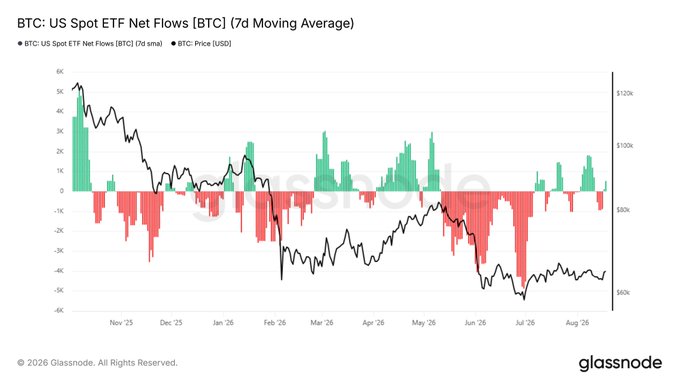
The flow of U.S. spot ETF funds has seen substantial improvement compared to the severe sell-off in early June and July (when the 7-day average had slipped to about -5,000 BTC). Since then, capital inflows have repeatedly returned to positive and experienced a strong accumulation wave in early August.
The latest readings have turned slightly positive again after briefly showing outflows, indicating that the selling pressure at the institutional level has significantly eased, but sustained accumulation momentum has not yet formed. If we can see a more lasting positive inflow into ETFs, it will further strengthen the logic that compliant spot demand is re-accumulating at the bottom of the current consolidation range.
Implied volatility compressed to cycle lows
The Bitcoin DVOL index has fallen back to the mid-30s, placing implied volatility in the low range of the past two years. This suggests that, despite Bitcoin still being near recent lows, the options market is pricing expectations of future volatility relatively smoothly.
This level of volatility compression means that the market's expectation for significant fluctuations in the short term has notably decreased. Although low implied volatility itself does not indicate direction, long-term volatility compression will make the market more sensitive to potential catalysts. Once a catalyst appears, it could easily trigger a sharp expansion of volatility.
Downward hedging demand diminishes
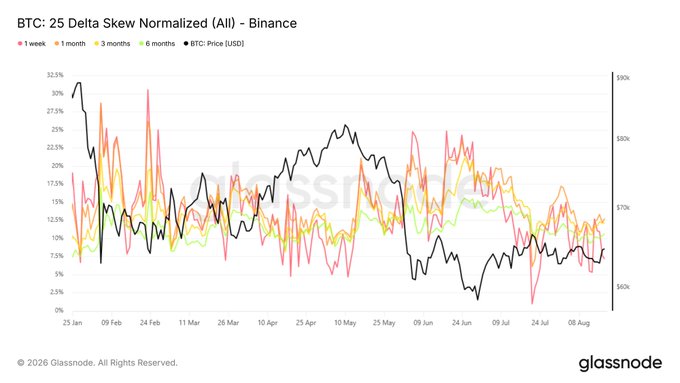
The 25-delta skew across the entire volatility curve remains positive, indicating that put options still maintain a premium compared to call options, and investors are still willing to pay for downside protection.
However, the short-term skew has significantly compressed, with the 1-week expiring skew dropping to lower recent ranges, while the longer expiration skews remain around 10%–13%. This indicates that short-term panic sentiment has substantively eased, although investors remain cautious over longer periods.
Options liquidity is concentrating around $65,000
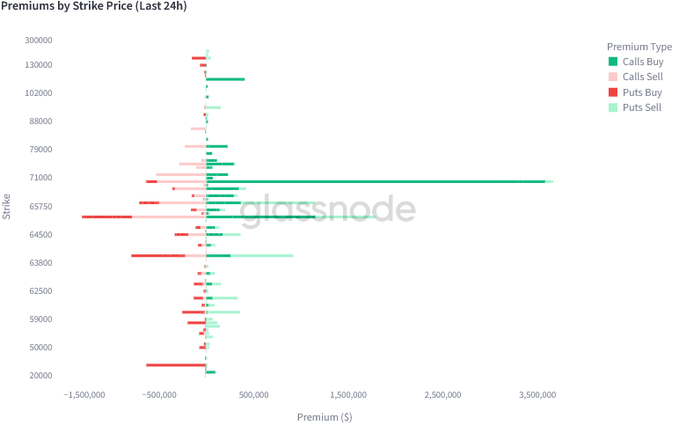
In the past 24 hours, option premiums have been highly concentrated around the $65,000 strike price, where large put buying faced significant counteracting put selling. This reflects that capital is engaged in heated two-way games within the current price range rather than forming a clear directional consensus.
On higher price curves, call option buying is mainly focused on the $68,000 and $130,000 range, indicating structural demand for upside play; while significant put buying at $45,000 suggests some investors are still positioning for deep downside protection. Overall, the position structure remains seriously divided, with core strategies focusing on managing risks around the current spot range.
Conclusion
The macro environment remains the primary constraint: the weakness of the dollar is offset by the rise of the 10-year U.S. treasury yield to around 4.7%, and Bitcoin has lagged behind the buying trends in gold and crude oil.
On-chain models indicate that prices are below the real market average and short-term holder cost benchmark, confirming that we are in the capitulation phase; but the relative unrealized loss has peaked around 0.25 (historically above 0.6), indicating that this round of pullback is shallower, more evenly distributed, and requires time rather than deeper price drops to digest. Off-chain signals also show divergence: demand for perpetual contracts turning positive, ETF outflows stabilizing, but the Coinbase premium remains negative, and implied volatility is compressed to cycle lows. The realized profit and loss ratio reported at 0.75 indicates that the exhaustion phase of selling pressure has not yet arrived. Until yields fall and this ratio rises back above the 2.0 threshold, any recovery should be viewed as a local rebound in the bottoming process.
This article link: https://www.hellobtc.com/kp/du/08/6419.html
Source: https://x.com/glassnode/status/2090114717624742256
免责声明:本文章仅代表作者个人观点,不代表本平台的立场和观点。本文章仅供信息分享,不构成对任何人的任何投资建议。用户与作者之间的任何争议,与本平台无关。如网页中刊载的文章或图片涉及侵权,请提供相关的权利证明和身份证明发送邮件到support@aicoin.com,本平台相关工作人员将会进行核查。
