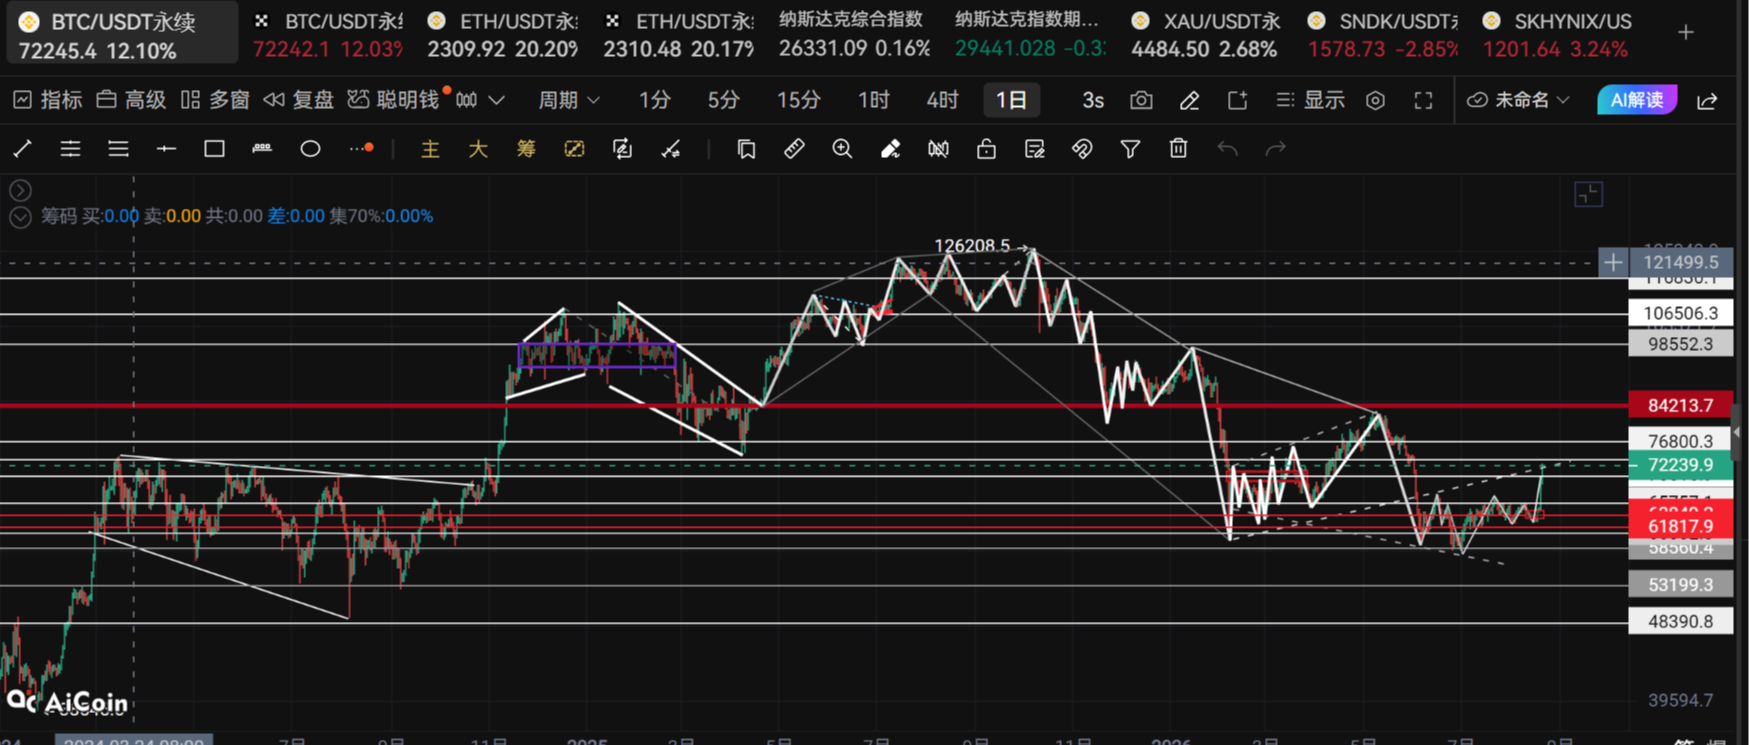
Crypto Circle Academician: On August 21, Bitcoin (BTC) made a significant upward surge breaking the balance, does key support determine the height of this round of market? Latest market analysis and operational advice interpretation
Bitcoin's current price is 72300, which has puzzled many people. Watching BTC directly break through multiple pressures to reach 72300, those who missed the opportunity feel regretful, while those holding are anxious about whether to take profits. Many friends have just gotten used to the fluctuating market, and suddenly a large upward candle breaks previous thinking, fearing to buy high and catch the peak, yet also afraid of missing out on a larger movement. If everyone reviews the content from the past two months, they will know that my layout for upward movement is all around the 60,000 level. Until now, I've still not exited and remained in the game; the entry point is too good and it’s impossible to exit all at once, I will only gradually take profits.
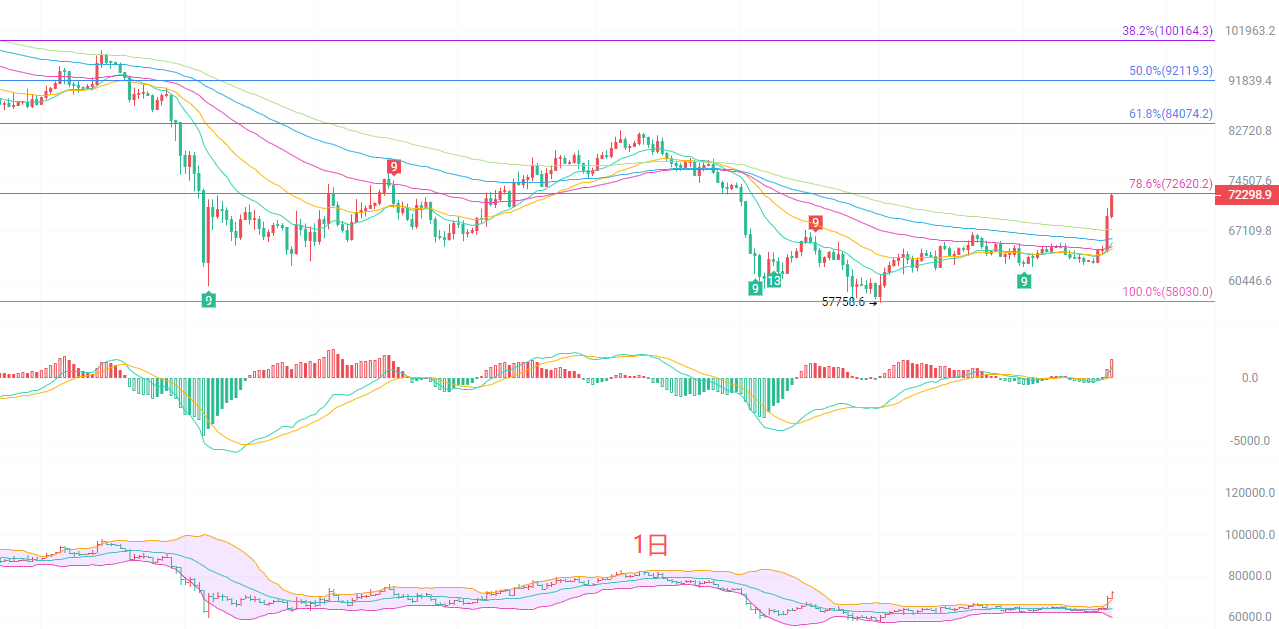
The daily K-line has broken upwards through the previous long-term consolidation zone, with prices standing above all EMA moving averages, and the moving averages are turning upward forming a bullish arrangement. The MACD indicator is rising quickly, the red bars are significantly expanding, and the Bollinger Bands are opening upwards, with bullish power being concentrated and released. The primary Fibonacci resistance level above is at 72620, with further resistance looking towards 75400; the key support below falls in the 67500-68000 range, which is the breakout position for this round. After a large daily bullish candle, there is a need for a pullback to confirm support; after consecutive large increases, indicators are in the overbought region, making it unwise to chase prices blindly, and caution is needed against the risk of deep corrections brought about by height retractions.
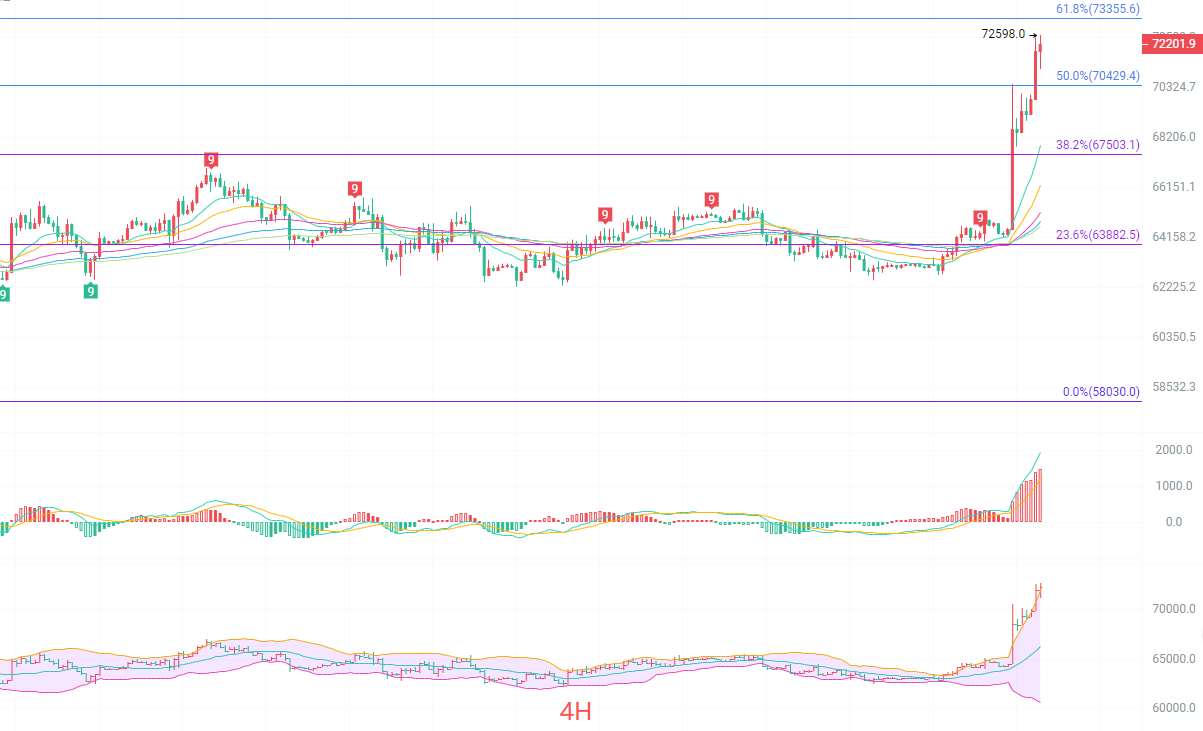
The four-hour K-line continues to rise along the upper track of the Bollinger Bands, and the Bollinger Channel is widely opened. The short-term EMA moving averages are fully supporting prices, and the bullish trend is very strong. The MACD maintains high-level red bars, but the indicators have already entered a seriously overbought range, and a top divergence pullback may occur at any time. The Fibonacci resistance at 73355 is just nearby, serving as a short-term strong resistance. The first support below is at 70429, followed by support at 67503. The four-hour market is characterized by a rapid surge, with no significant corrections, thus amplifying the risks of chasing orders. Even if the long-term trend is bullish, it is necessary to wait for a pullback to stabilize before considering participation; chasing prices directly at high levels easily leads to rapid spikes causing losses.
Short-term reference:
If the current price continues to rise, set a stop loss of 500 points, with the first target at 73300, and continue holding after breaking the level.
If it fails to break the range of 73200 to 73500, set a stop loss of 500 points, with targets looking down to 72500 to 72000.
Specific operations should be based on real-time data from the market, for more detailed information, you can consult the author. The publication of the article has a delay, and advice is for reference only, risk is undertaken by oneself.

Kind reminder: The above content is only created by the author for the public account, and the advertisements at the end of the article and in the comments section are unrelated to the author. Please discern carefully, thank you for reading.
免责声明:本文章仅代表作者个人观点,不代表本平台的立场和观点。本文章仅供信息分享,不构成对任何人的任何投资建议。用户与作者之间的任何争议,与本平台无关。如网页中刊载的文章或图片涉及侵权,请提供相关的权利证明和身份证明发送邮件到support@aicoin.com,本平台相关工作人员将会进行核查。