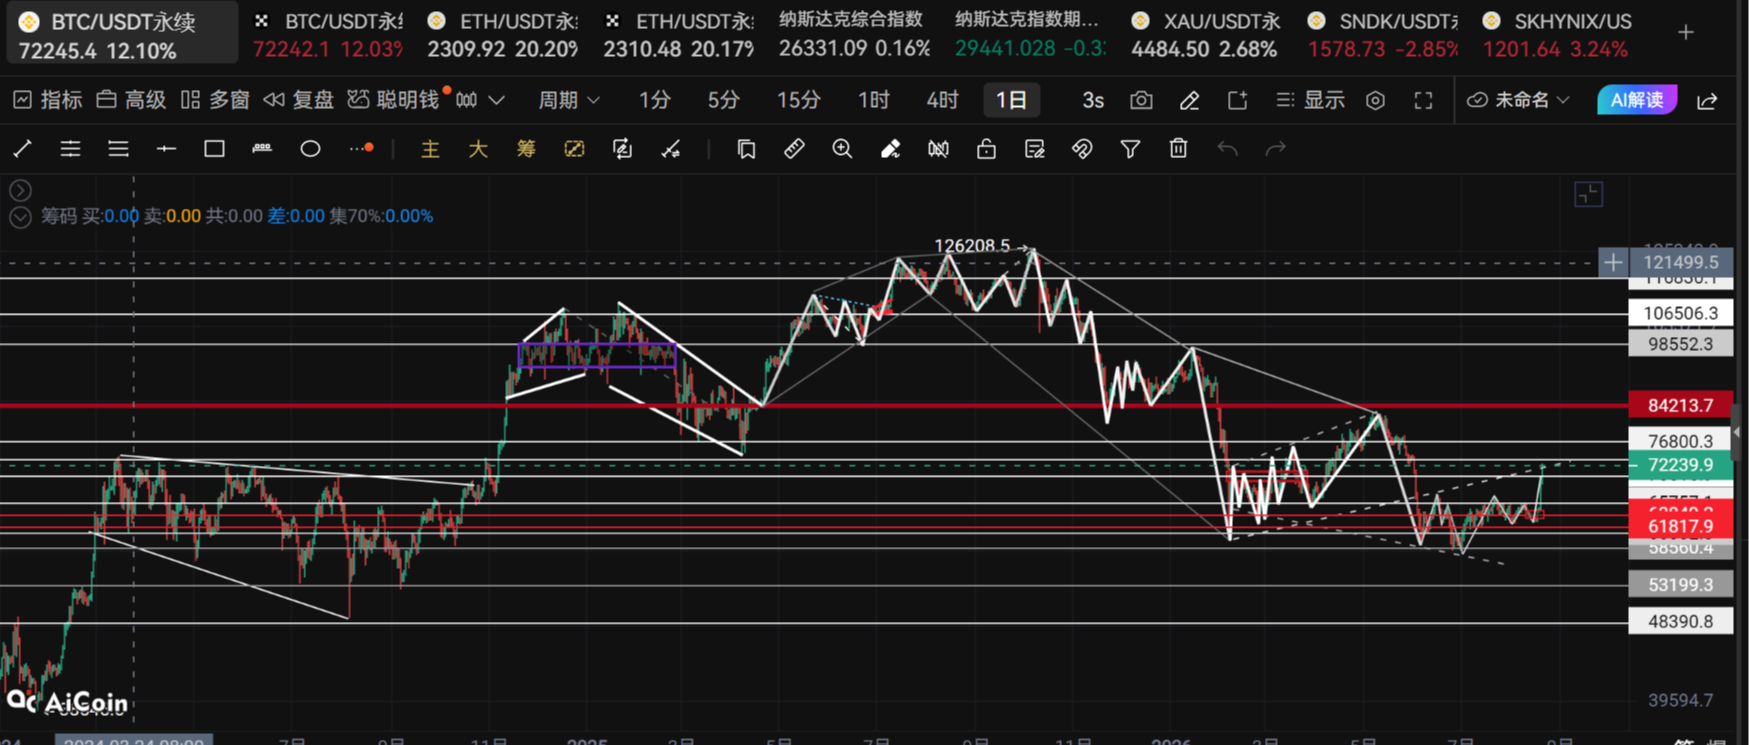
Crypto Circle Academy: On August 21, Ethereum (ETH) violently surged, breaking out of the range. What are the next two possible evolution paths? Latest market analysis reference
Ethereum's current price is 2300, rising from 1630 to 1670 to 1700 three times in a row. Many friends are feeling both envy and confusion. After enduring a bottoming process for so long, the prolonged sideways movement has worn down most people's patience. Just when many cut their losses and left the market, the price suddenly shot up. Many people missed the surge and are now afraid to chase, fearing they will enter just as a pullback occurs and get stuck. The market is always like this, giving birth to opportunities in despair, continuously rising amidst hesitation. Now that the price has reached 2300, we are still moving north. The market has accumulated a large amount of profit-taking, and the risks of chasing higher are clearly visible, as there are several points below 1700. Now is the time to let the bullets keep flying
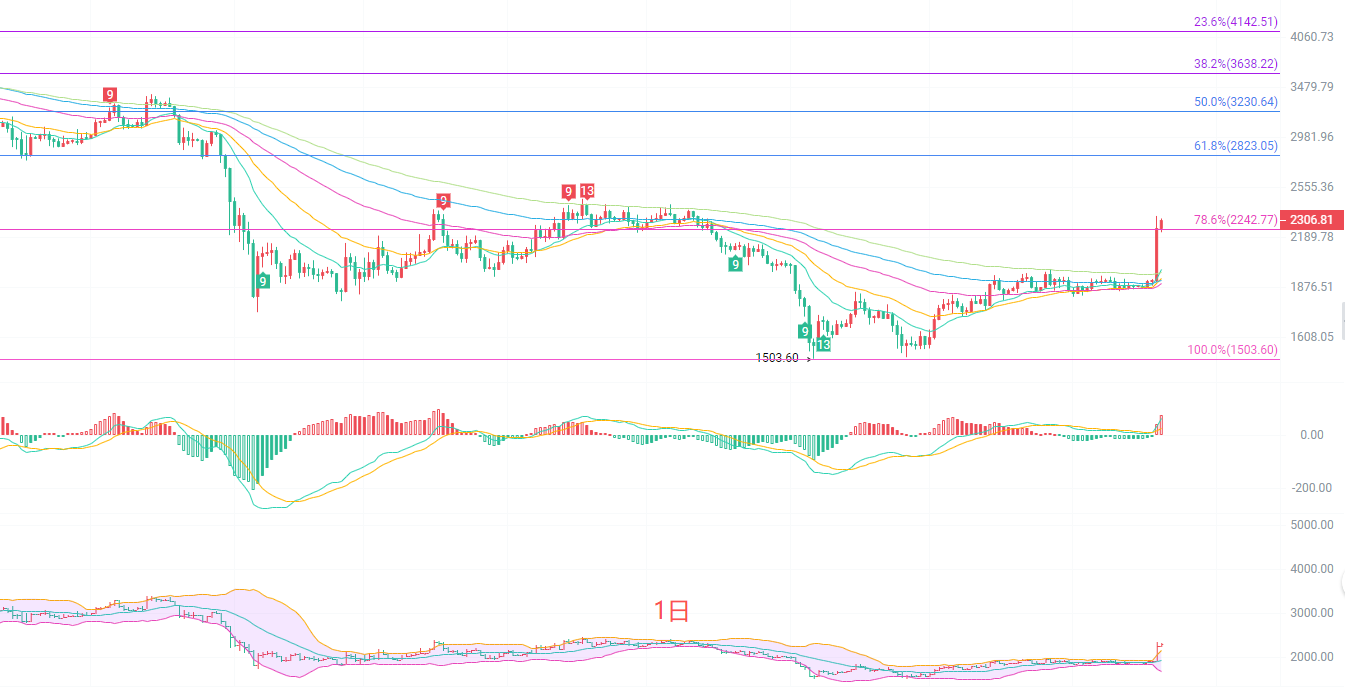
The daily candlestick is above all EMA moving average systems, with the moving averages starting to turn upward from a twisted position, indicating a mid-term trend that has shifted from sideways to slightly bullish. The price has reached the Fibonacci 78.6% level above 2242, which has turned from a previous high point into support. The MACD indicator is synchronously increasing, with the red bars significantly expanding, and bullish momentum is being concentrated and released. The Bollinger Bands are opening upwards, with the price above the upper Bollinger Band, which is indicative of a typical strong bullish trend. However, it is important to note that after a large daily candlestick, the indicators have entered the overbought range, meaning that there is a demand for short-term pullback repairs. Key support below looks at the EMA30 and EMA60 moving average range of 1920 to 1990; this is an important defensive position for the current rise. As long as it does not break down effectively, the bullish structure on the daily level will not be damaged.
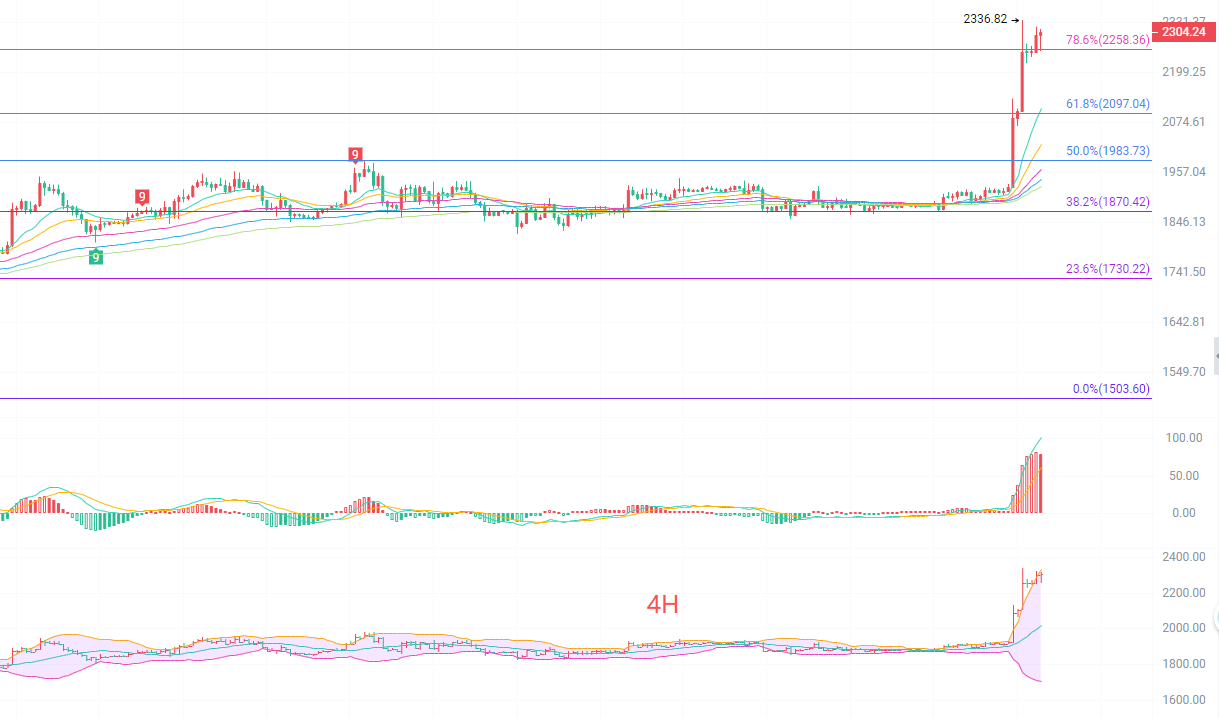
The four-hour candlestick has significantly diverged from the moving average group, and the short-term divergence rate has been stretched greatly. All EMA moving averages are in a bullish arrangement, with the moving averages diverging upwards, maintaining a good mid-term bullish trend. The price is steady above the Fibonacci 78.6% level of 2258, and the short-term pressure above looks toward around 2336, the high point of this surge. The 4-hour MACD has increased significantly, with the red bars continuously expanding, and bullish momentum being fully released, but the indicators are already at a high level, posing a hidden risk of bearish divergence. The Bollinger Bands are widely opened, and the candlestick is running close to the upper band, indicating an extreme strong state. In such market conditions, do not randomly short or try to catch the top, as it's very hard to predict tops in a strong trend. It is more likely that the market will see a pullback repair, and key levels to watch during the pullback are the 61.8% level of 2097 and the 38.2% level of 1870. These two are key support areas to observe during the pullback phase.
Short-term reference:
If it does not break 2100 to 2150 below, it will go north, with a stop loss of 40 points, targeting 2300 to 2350.
If it does not break 2330 to 2350 above, it will go south, with a stop loss of 40 points, targeting 2250 to 2200.
Specific operations should rely on real-time market data. For more details, please consult the author. Article publishing may have a delay, so it is recommended for reference only; risks are borne by oneself.

Warm reminder: The above content is solely created by the author of this public account. The advertisements at the end of the article and in the comments section are unrelated to the author, so please discern carefully. Thank you for reading.
免责声明:本文章仅代表作者个人观点,不代表本平台的立场和观点。本文章仅供信息分享,不构成对任何人的任何投资建议。用户与作者之间的任何争议,与本平台无关。如网页中刊载的文章或图片涉及侵权,请提供相关的权利证明和身份证明发送邮件到support@aicoin.com,本平台相关工作人员将会进行核查。