This wave of Bitcoin repricing is largely attributed to the sudden announcement by the U.S. Treasury to increase long-term bond repurchases. My personal view is similar to the editor's; it feels more like a K-line drawn by the Donald himself. Unless there are concrete actions on the ground, I remain skeptical, of course, this is just my personal opinion.
Today's live stream will discuss a metric that many new friends tend to overlook—trading volume. It is the key value that helps you determine whether the trend has strength. Even with a 10% increase, why can some markets continue to rise while others reverse and adjust after just two days? The difference is largely hidden in the trading volume.
Many beginners only look at the price at first glance: has it gone up or down? But have you ever thought that the price only tells you which direction the market is heading, while the trading volume tells you whether there is enough capital supporting that direction? Simply put: price is the result, trading volume is the process.
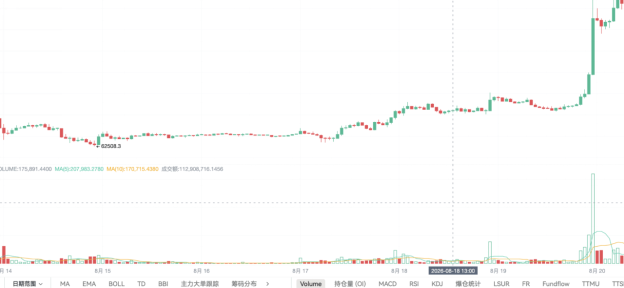
First, let's talk about where to find trading volume. At the bottom of the market page, there is a Volume section; clicking it will bring up a red and green bar chart, which represents the trading volume. For a 1-hour period, it shows how much has been traded during that hour. Green and red correspond to increases and decreases, and sometimes there are dotted lines, which represent the estimated trading volume predicted by algorithms. The larger the trading volume, the more participants there are in that period, and the more active the capital exchange; the smaller the trading volume, the quieter the market, indicating that fewer participants are involved. For example, if a shopping mall usually has 100 visitors per day and suddenly has 5000 on a particular day, it shows that the place has suddenly gained a lot of attention, capital, and foot traffic. The trading market operates on the same principle; when Bitcoin surged dramatically, it compared to the previous days as if it were a still pond.
Four Basic States of Trading Volume
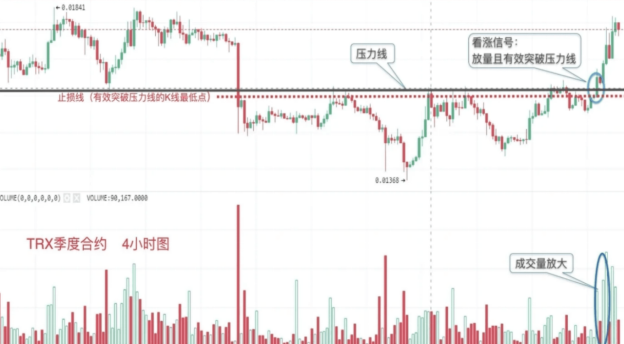
The first state is expansion, which means the trading volume has significantly increased compared to before, making the market suddenly lively with a large influx of capital. For example, if Bitcoin has been oscillating in a range for a long time and suddenly breaks through a resistance level while the trading volume noticeably increases, it indicates that not only is the price breaking through, but more capital recognizes this breakthrough, which generally signifies a higher quality breakout.
Speaking of this, it seems trading volume is quite simple; its real core usage is price-volume relationship, analyzing price and trading volume together.
Situation 1: Uptrend + Expansion This is the combination the market is most eager to see, indicating that more capital is participating in the uptrend, and the bullish strength is increasing, especially when breaking through resistance levels, which is particularly noteworthy. The other day was the best example; Bitcoin fluctuated for months and suddenly broke through 70,000 in a single day, with trading volume expanding two to three times compared to usual. At such times, your previously calculated, AI-predicted, and indicator-provided resistance levels are basically unbreakable.
Situation 2: Uptrend + Contraction The price continues to rise, but the trading volume is decreasing. This situation requires vigilance, indicating that fewer people are willing to participate, which we often refer to as divergence between price and volume. This does not mean it will drop immediately, but it reminds you that the upward momentum may be weakening. Follow-up observations should focus on whether there are long upper shadows, breaking key support levels, or obvious selling pressure—where selling orders significantly outnumber buying orders.
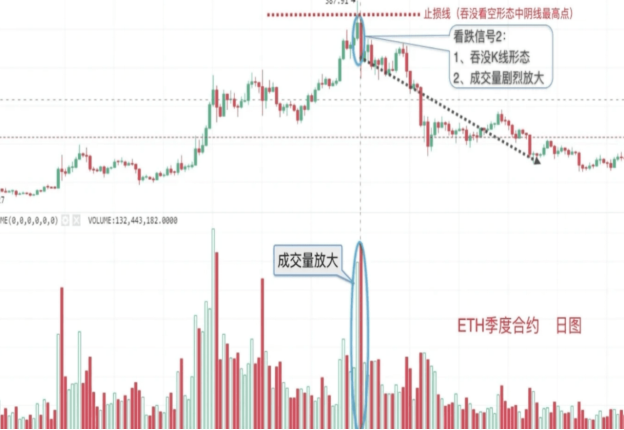
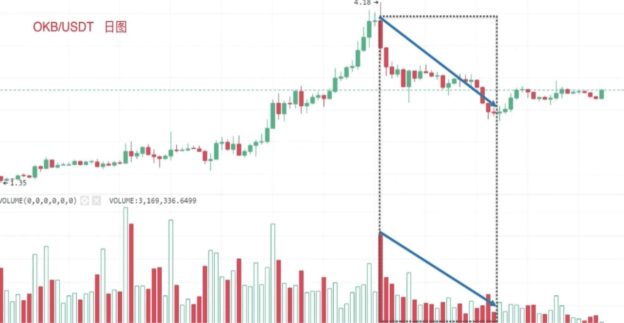
Situation 3: Downtrend + Expansion The price is falling while the trading volume noticeably increases. For instance, if Bitcoin had support at 70,000 but suddenly falls through with huge trading volume, this type of decline usually has significant impact. Recently, Bitcoin experienced this, and a similar trend occurred at the beginning of the year 2024; you can check the K-line charts, it seems such movements happen several times each year.
Practical Application: Using Trading Volume to Determine the Validity of Breakouts
Many friends look for support and resistance levels, but often misjudge real versus false breakouts, making it hard to determine buy and sell points—this is when trading volume can be very helpful. Remember one thing: true breakout = price breakthrough + trading volume confirmation.
Here are three practical scenarios: Case 1: Expanding Breakout, as mentioned earlier, when the price breaks through a key level simultaneously with increased trading volume, this breakout has the highest credibility. Case 2: High Price Increase + Continuous Volume Decrease, suppose we are watching Bitcoin and notice that the price continues to rise while trading volume continuously declines; this does not mean a drop will occur immediately, but it indicates weakening upward momentum. Follow-up observations should focus on whether there is obvious selling pressure or if key support levels are breached, i.e., whether it will create a “downtrend + expansion” combination. Case 3: Low Volume Consolidation Followed by Expansion Breakout, after a price decline, if trading volume decreases significantly, leading to a consolidation period, and then on a certain day it breaks out of the range with noticeably increased trading volume. The key point is not that “low volume equals a bottom,” but whether the trading volume expands again after a period of low volume consolidation.
There are also a few common combinations worth noting: high price drop + expansion, indicates a high probability of further decline.
Unconsciously, Bitcoin has reached above 78,700. I wish the popularity of my live stream could rise this fast. It’s interesting to note that two weeks ago, people were still discussing when to find a bottom, and now they are already talking about when to find a top. A couple of days ago, so many short positions were opened; I believe many are still waiting to short, and that pressure is still there. However, market sentiment is indeed high now, with all KOLs actively bullish, which could sustain the increasing trading volume. So don't underestimate the power of the masses, haha.
Currently, there are live streams every day; feel free to keep up with your AiCoin friends! Book in advance 👇
https://www.aicoin.com/zh-Hans/live/list?tab=upcoming
Join our community to discuss together and become stronger!
Official Telegram community:
AiCoin Chinese Twitter:
Aster Rebate:
https://www.asterdex.com/zh-CN/referral/9C50e2
Hype Rebate:
https://app.hyperliquid.xyz/join/AICOIN88
Binance Rebate:
https://jump.do/zh-Hans/xlink-proxy?id=3 Invite Code: aicoin668
Coinbase Rebate:
https://jump.do/xlink?checkProxy=true&proxyId=25 Invite Code: Y8L23JL
免责声明:本文章仅代表作者个人观点,不代表本平台的立场和观点。本文章仅供信息分享,不构成对任何人的任何投资建议。用户与作者之间的任何争议,与本平台无关。如网页中刊载的文章或图片涉及侵权,请提供相关的权利证明和身份证明发送邮件到support@aicoin.com,本平台相关工作人员将会进行核查。