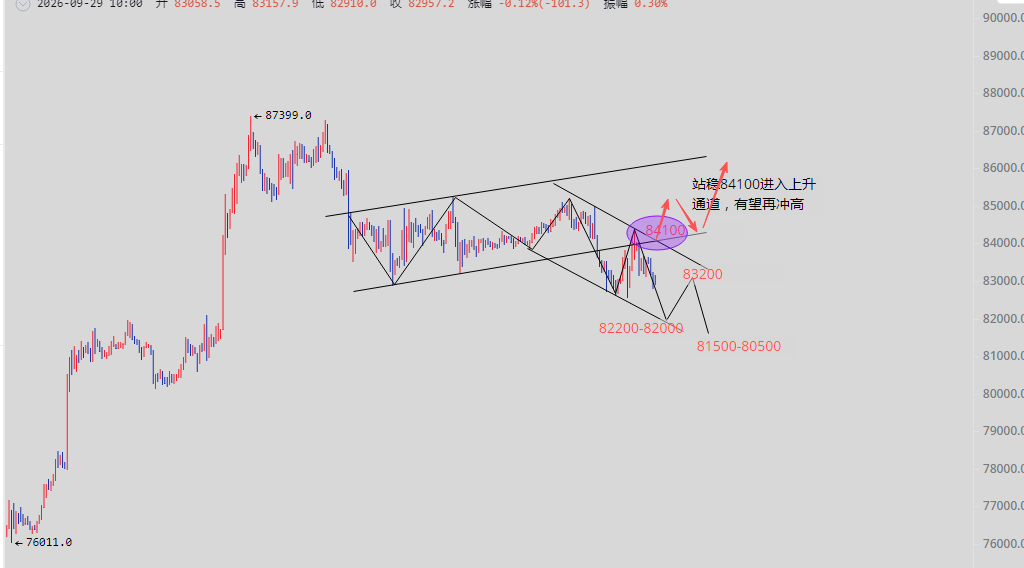
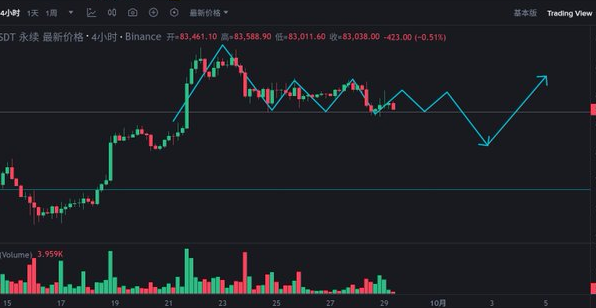
On August 31, in the conflict between the United States and Iran that reignited last night and this morning, the U.S. launched a surprise attack on the Strait of Hormuz, and Iran immediately retaliated. The cryptocurrency and stock markets were clearly affected and declined. This week, the direction of the U.S.-Iran conflict will again become an event that the market has to closely monitor. However, some market analysts indicate that this conflict may have limited sustainability, and the U.S. will continue to use economic sanctions as the main means to pressure Iran. Additionally, this week the market will receive the U.S. non-farm payroll report, the G20 finance ministers and central bank governors meeting, and the Federal Reserve's release of the Beige Book. Among these, Friday's U.S. August employment report is the last non-farm data before the Federal Reserve's interest rate meeting on September 16, which will be a key point to test the expectations for a rate hike in September.
On Monday, before the official opening, Bitcoin had already weakened and declined. So the question arises, which position must be broken in the subsequent market for the accelerated downward correction to begin?
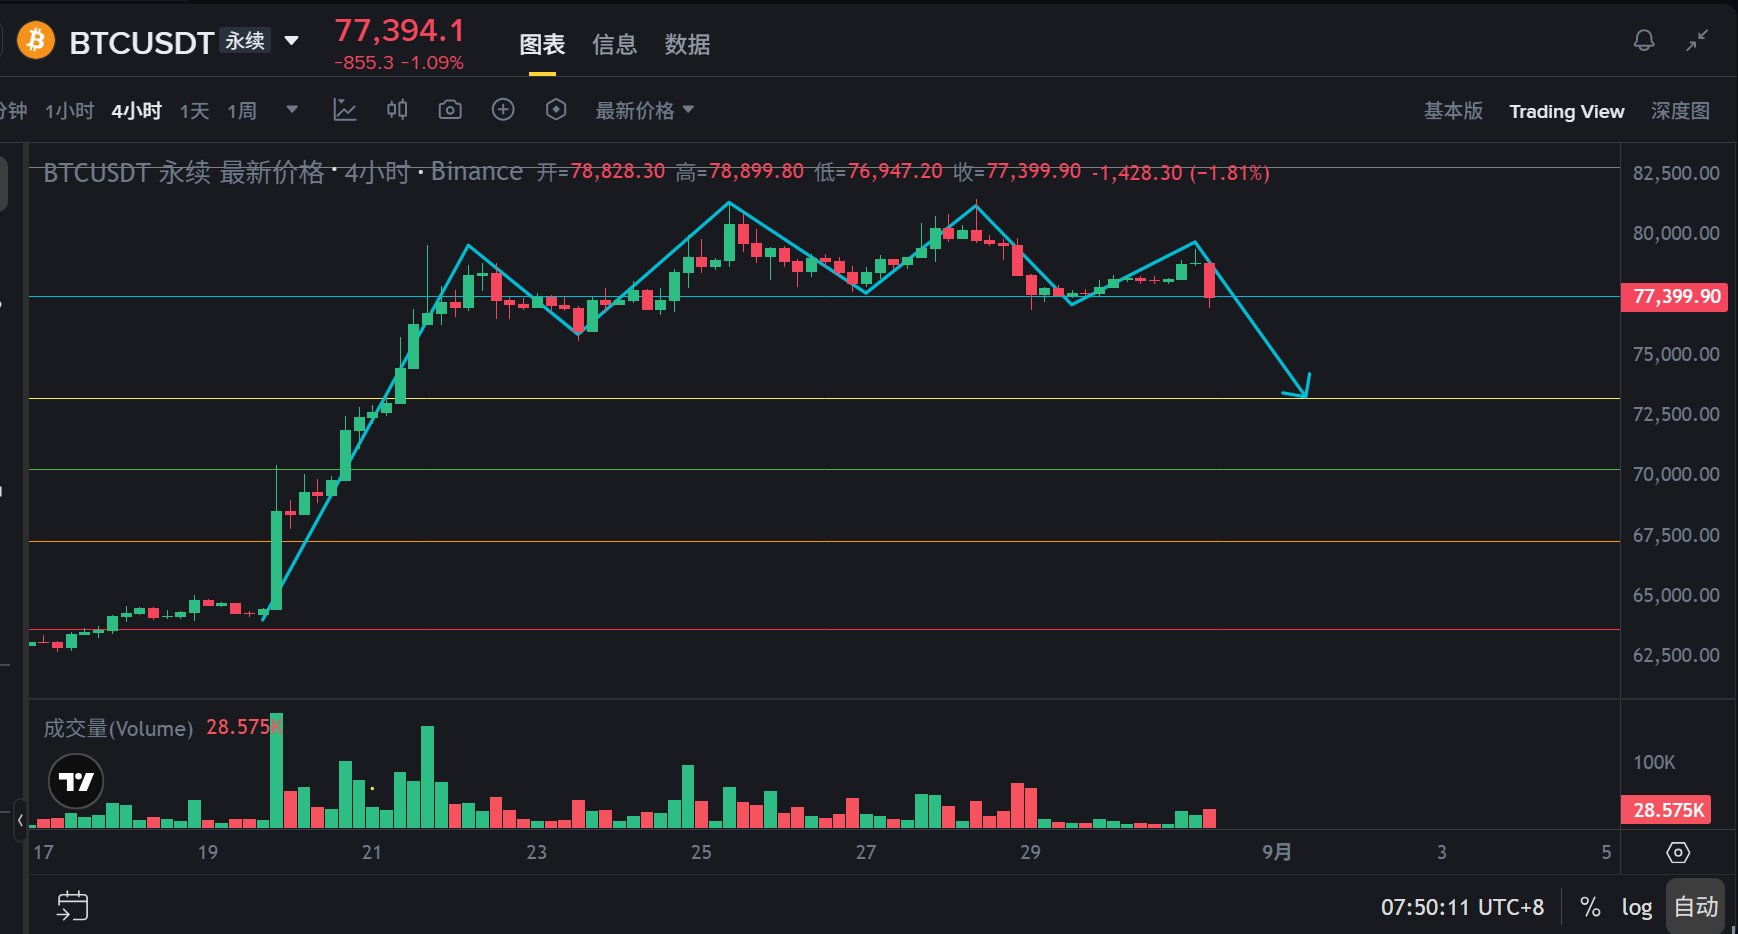
Firstly, looking at the market, on the 4-hour level, Bitcoin has formed a multiple M head pattern in the range of 77,000 to 82,000 USD. There is a clear resistance on the upside, while there are also several key support lines on the downside.
The first defense line is near 77,000 USD. This position is the low point from last Friday and also the lower edge of the consolidation range over the weekend, making it an important support level at present. If it breaks below 77,000 with volume, the short-term bullish structure will be directly damaged, and the price will likely first test 75,000 USD.
Next, looking at the second key position of 75,000 USD. If the price effectively breaks below this level, major mainstream CEX exchanges will see a total long position of up to 919 million USD facing liquidation. Once such a large liquidation order is triggered, a vicious cycle will form: the market declines, causing liquidations of long positions, which leads to forced selling, further pushing the price down and directly initiating an accelerated downward market.
Finally, the watershed for the mid-term trend is 72,000‑73,000 USD. This level is both the Fibonacci 0.382 retracement level and the 120-day moving average, as well as the bottom of the market structure over the past three months. If this range is genuinely broken, the mid-term bullish logic will be declared invalid, and it is highly likely that a further decline to the 68,000‑70,000 USD range will follow.
Valuable information is not easy to come by; please like, share, and follow for synchronized operations. (Public Account: Big Bull Says Market)
Market review does not constitute investment advice; cryptocurrency is highly volatile, and contract trading carries extreme risk, so please manage your positions wisely.
免责声明:本文章仅代表作者个人观点,不代表本平台的立场和观点。本文章仅供信息分享,不构成对任何人的任何投资建议。用户与作者之间的任何争议,与本平台无关。如网页中刊载的文章或图片涉及侵权,请提供相关的权利证明和身份证明发送邮件到support@aicoin.com,本平台相关工作人员将会进行核查。