Cryptocurrency Expert: After the big jump of 9.1 Bitcoin (BTC), it enters a digestion period. Understanding market signals will prevent you from being shaken out? Latest market analysis and operation suggestions.
The current price of Bitcoin is 78500. After reaching a high, it enters a phase of consolidation. Many friends are feeling conflicted, fearing missing out yet worrying about buying high and getting trapped. After a big rise, the market will not immediately soar sky-high, nor will it plummet instantly; most of the time it will be back and forth, shaking off the mindset. Many people impulsively go long when they see a small green candle and panic sell when they see a small red candle, getting harvested back and forth. The current position at 78500 happens to be in the central range after the previous significant rise, and the battle between bulls and bears is intensifying.
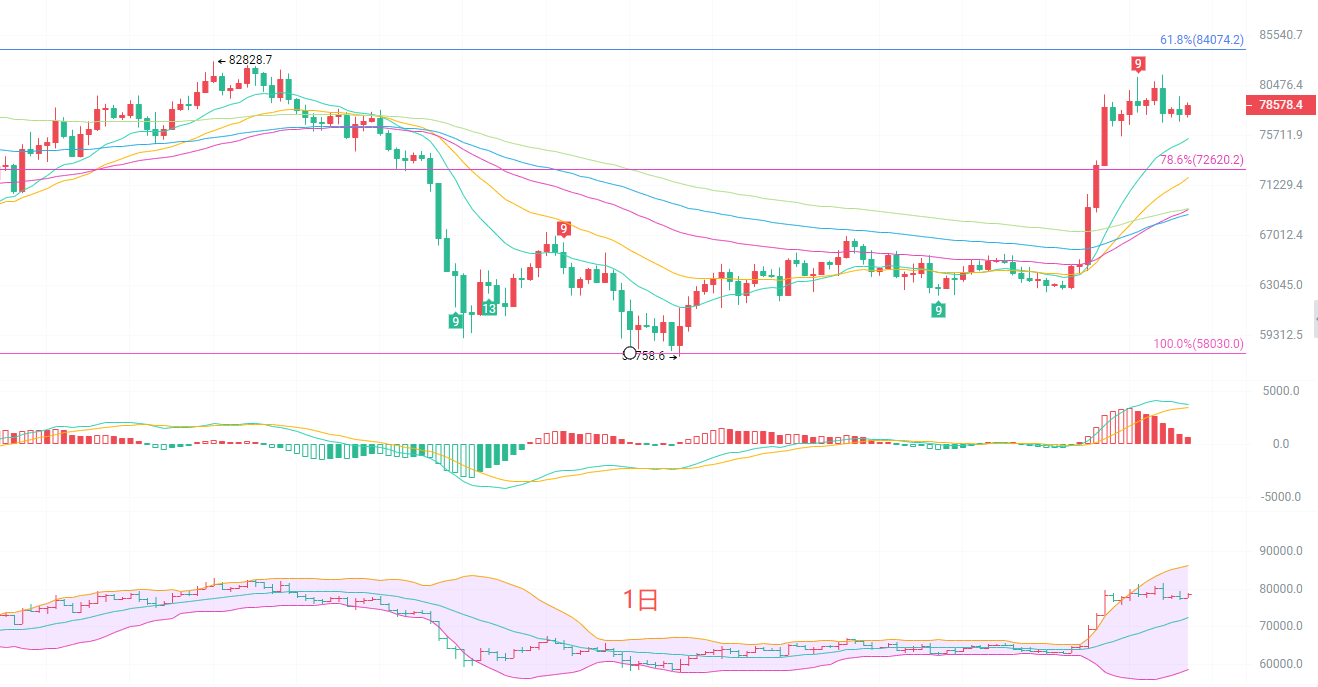
The daily K-line has retreated to around 78500 for consolidation. The EMA moving average system remains in a bullish arrangement, and the short-term moving averages are providing support, but the MACD red bars are clearly shrinking, indicating a weakening of bullish momentum. The upper Bollinger Band is at 86285, and the lower band is at 58643; the current price is operating in the upper half of the Bollinger Band, and the overall trend is still bullish. The key resistance above is the 61.8% Fibonacci level at 84074, which is an important pressure point for this round of rise; below, 72620 is the 78.6% retracement support, and if this position is broken, the bullish structure on the daily level will be damaged. The daily level is a high-level consolidation after an increase, with no clear reversal signal, but the cost-effectiveness of chasing more has already declined.
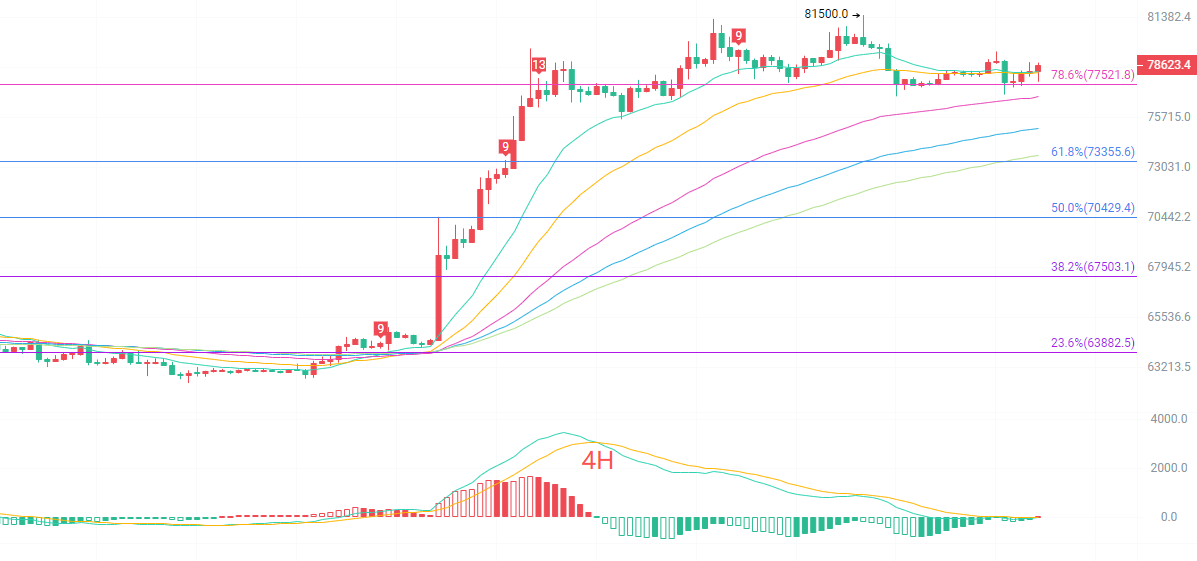
The four-hour K-line has retraced to around the 78.6% Fibonacci level at 77521, and this level has become an important short-term support. The short-term EMA moving averages are intertwined and flattening, and the upward slope is slowing down, leading to box consolidation. The MACD indicator’s DIF and DEA are converging downwards, with green bars being slightly released, indicating short-term bearish strength is being released, but there is no deep sell-off yet. The middle Bollinger Band is at 78115, and the price is repeatedly contested near this mid-band. The upper pressure is at 81500, the previous high, with strong support below at 77521. If this support holds, the four-hour chart will maintain high-level consolidation; if it effectively breaks below, it will further explore the 61.8% retracement at 73355. The four-hour chart is currently in a pattern of balanced oscillation between bulls and bears.
Short-term references:
Go long from 77600 to 77200, with a stop loss of 500 points, targeting 80200 to 81200.
Go short from 81200 to 81600, with a stop loss of 500 points, targeting 80000 to 79000.
Specific operations should be based on real-time market data. For more detailed information, you can consult the author. The article may have delays in publication, and suggestions are for reference only at your own risk.

Warm reminder: The above content is solely created by the author. The advertisements at the end of the article and in the comments section are unrelated to the author. Please be careful when discerning, thank you for reading.
免责声明:本文章仅代表作者个人观点,不代表本平台的立场和观点。本文章仅供信息分享,不构成对任何人的任何投资建议。用户与作者之间的任何争议,与本平台无关。如网页中刊载的文章或图片涉及侵权,请提供相关的权利证明和身份证明发送邮件到support@aicoin.com,本平台相关工作人员将会进行核查。