Today, I will guide everyone step by step to thoroughly understand a highly practical trend trading strategy specifically designed to accurately capture the fluctuations of BTC prices. Old followers should be very familiar with this; it is the EMA Long-Short Arrangement Strategy that I have been using all along. In addition, I will share a few EMA practical tips that are privately kept within our research institute, which are rarely known to the general public and are extremely useful.
Let's interact first; recently, how many friends have been caught in high position short positions? You can put your short opening price in the comments section!
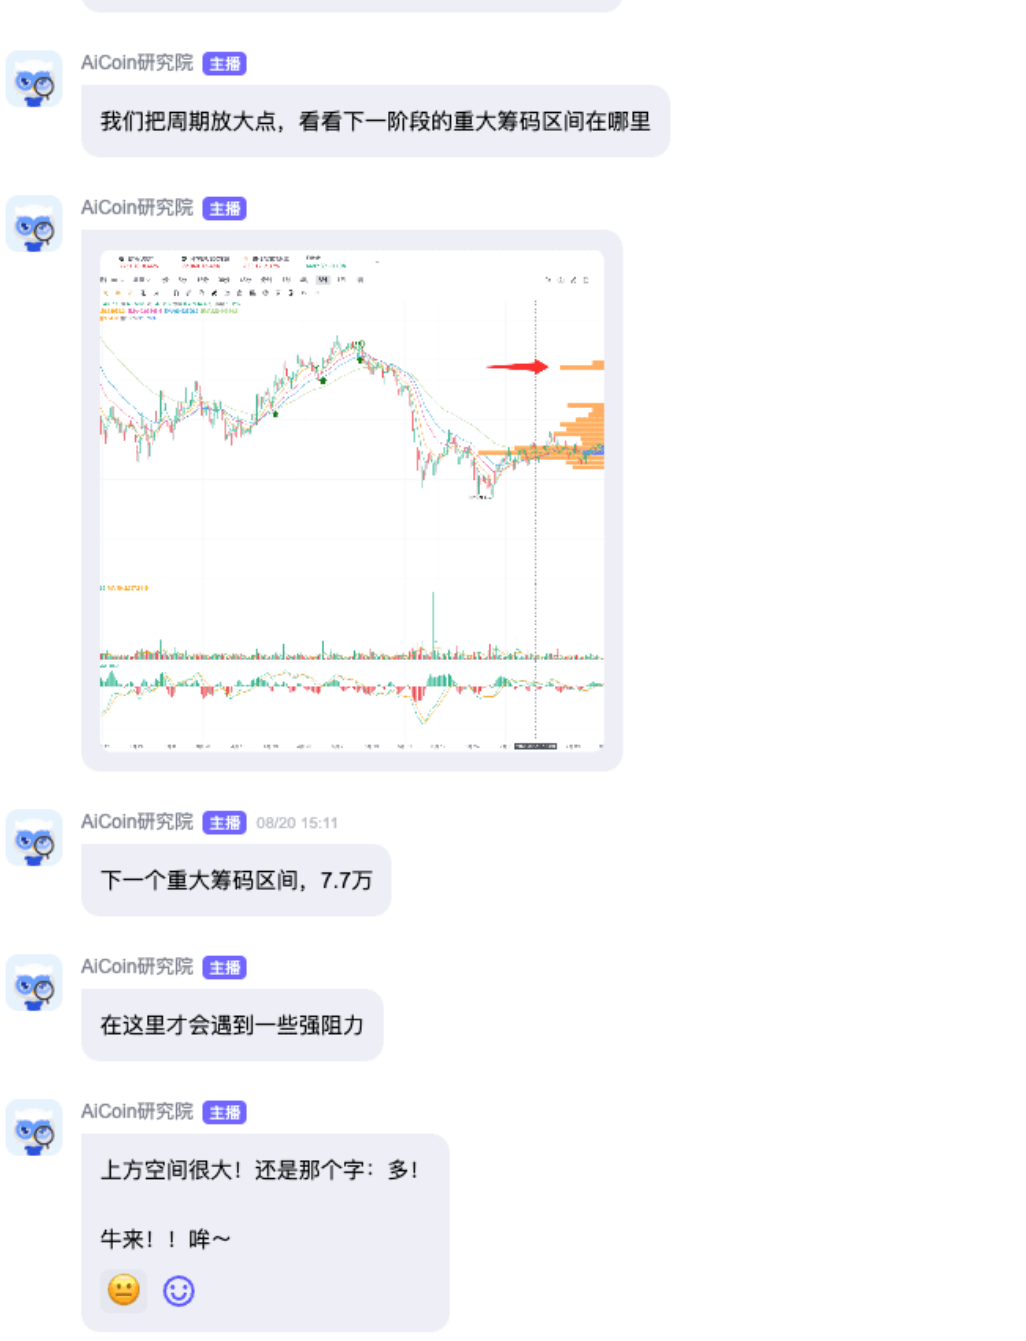
For those following my last live broadcast, this wave of market trend has likely brought you profits. My old followers will remember that during the live broadcast on August 20, when the price of Bitcoin was still at 69,000, I predicted in advance, based on the chip distribution thinking, that the price would break through and rise to above 77,000 in the short term. Ten days have passed, and the market movement completely aligns with this prediction.
Combining this EMA strategy, let’s first state the core conclusion: It is currently not suitable to go short.
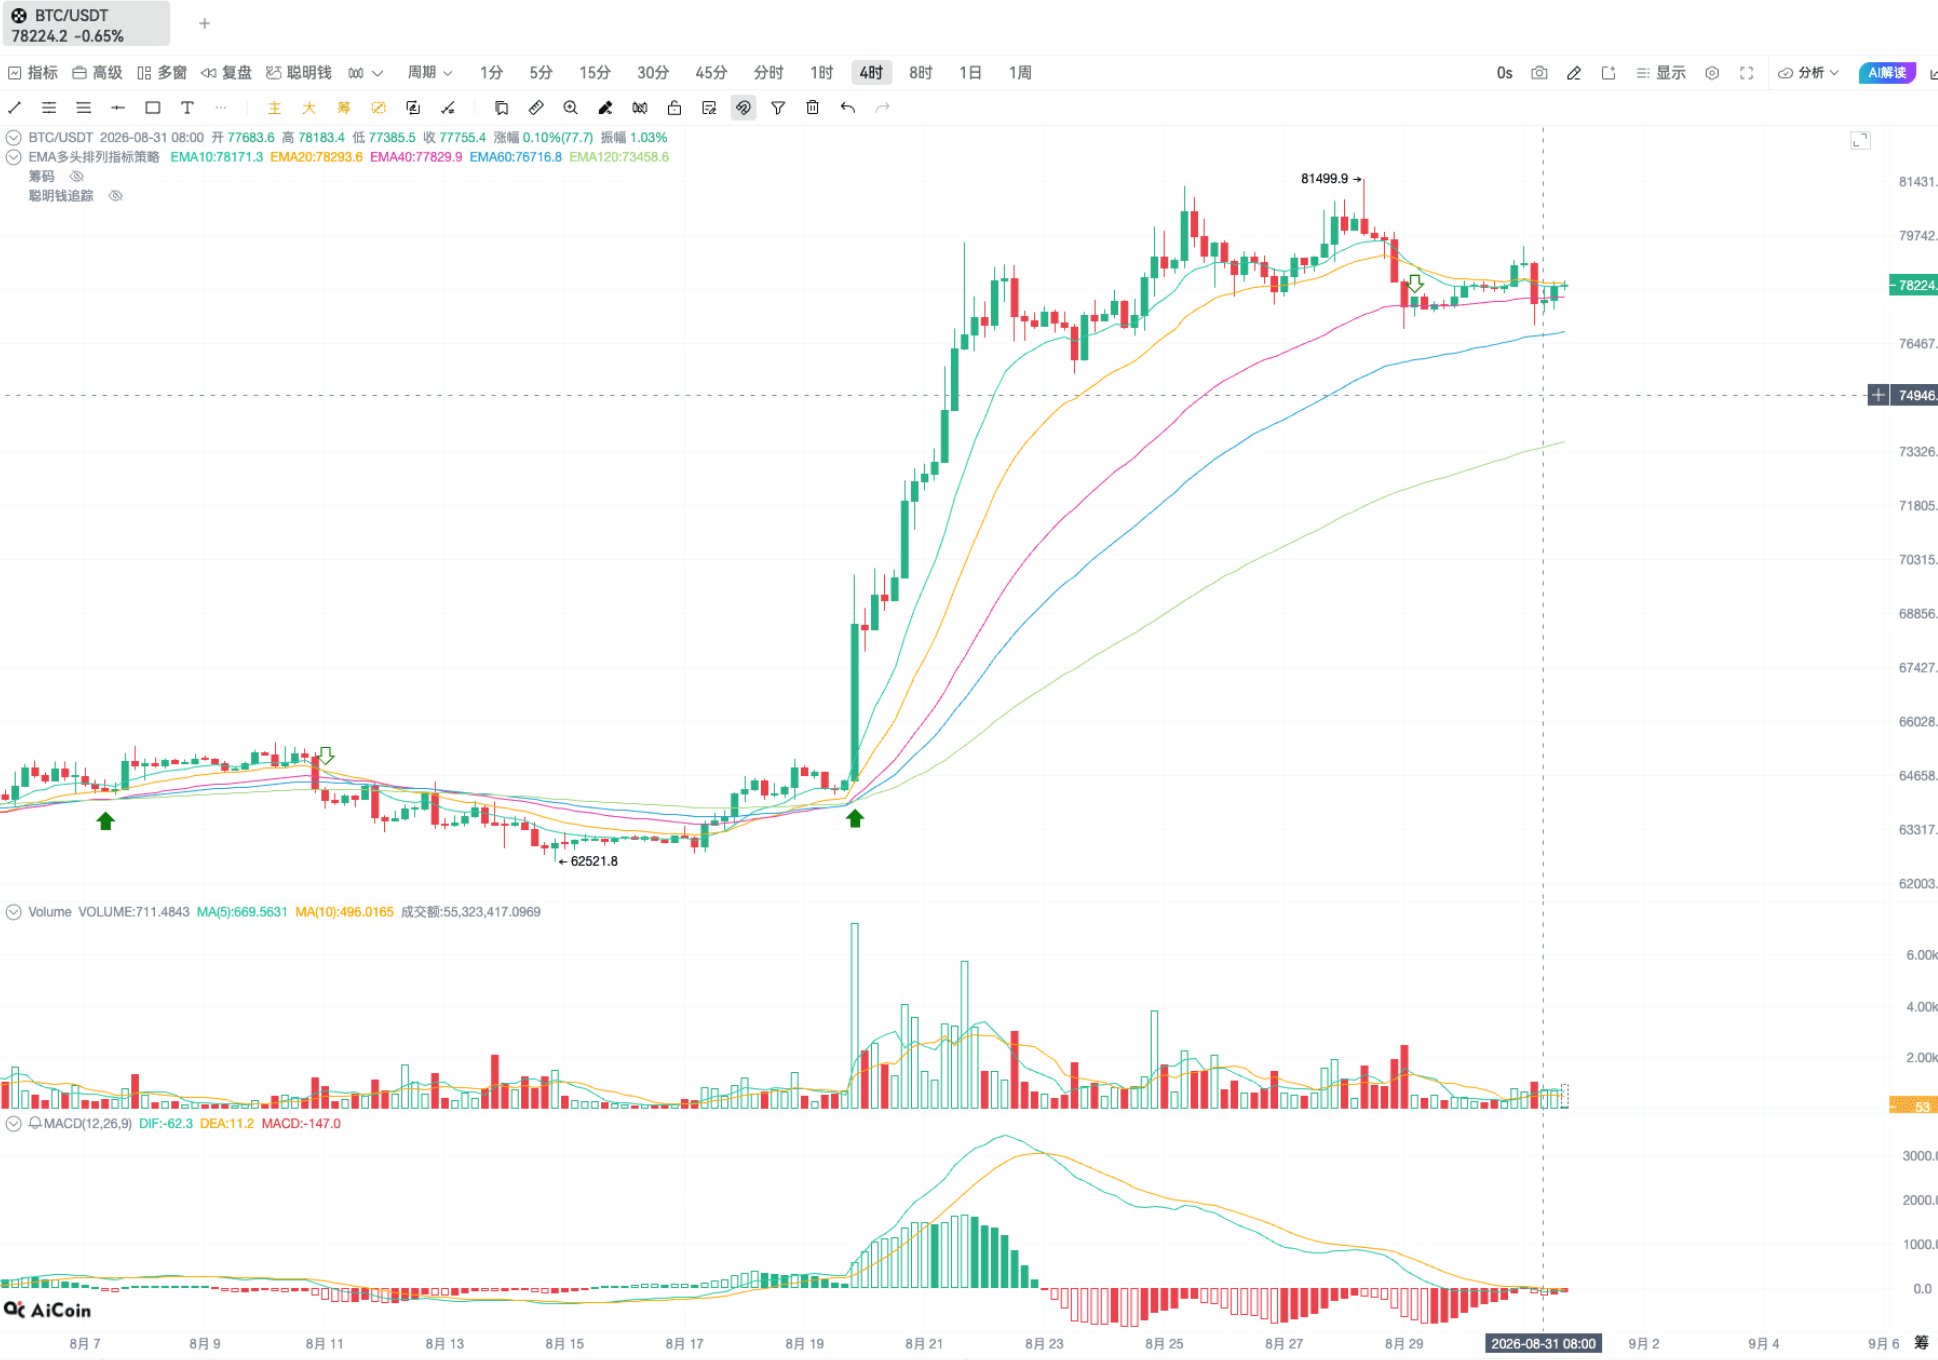
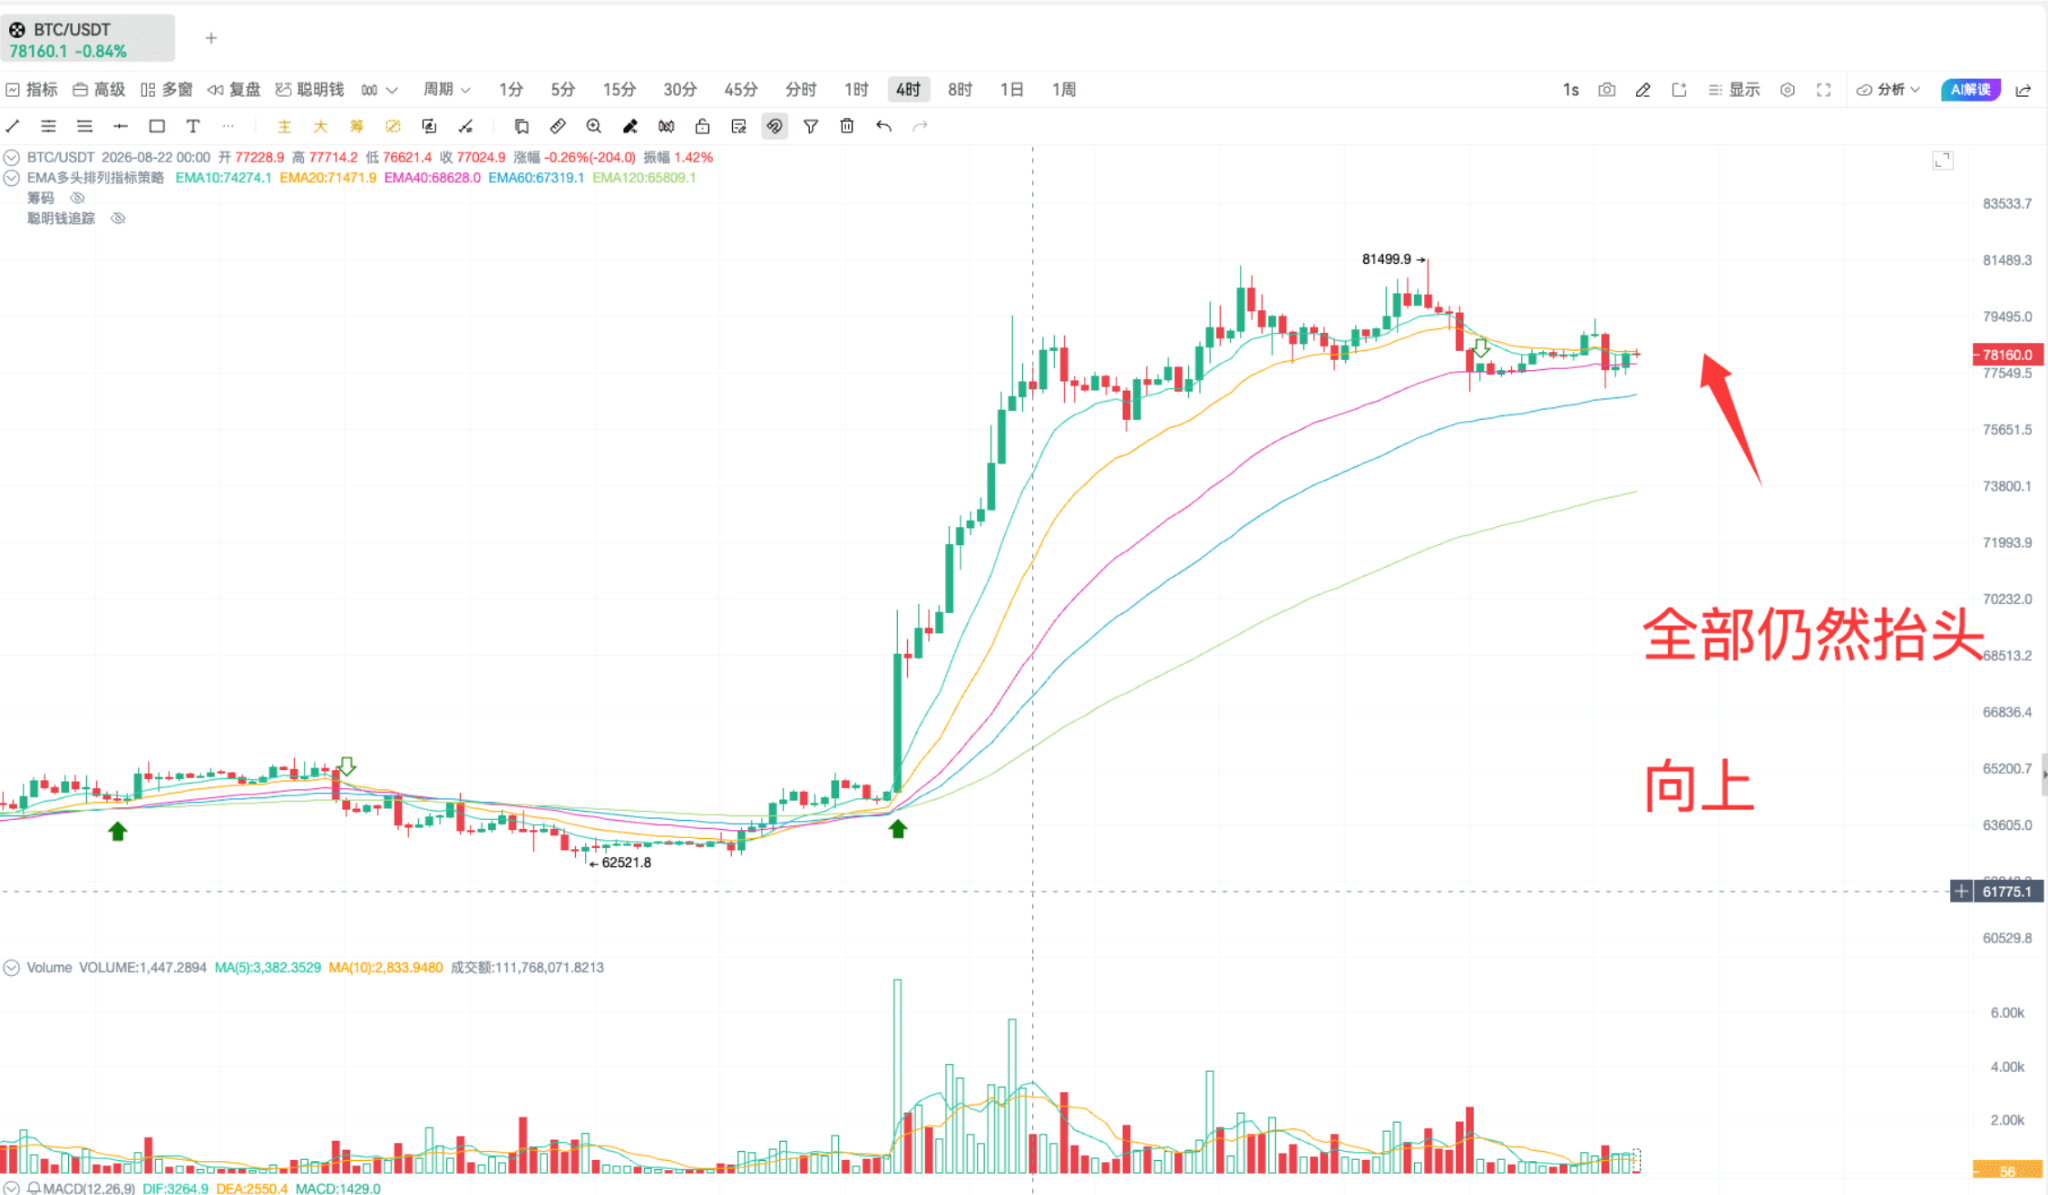
I will break down the market logic step by step. First, let’s look at the fixed EMA moving average parameters we use: 10, 20, 40, 60, 120, covering all short, medium, and long-term cycles. Currently, the price is firmly above all EMA lines, and there are no signals indicating a bearish arrangement.
Many people cannot distinguish when it is most stable to go short; here I will provide clear standards.
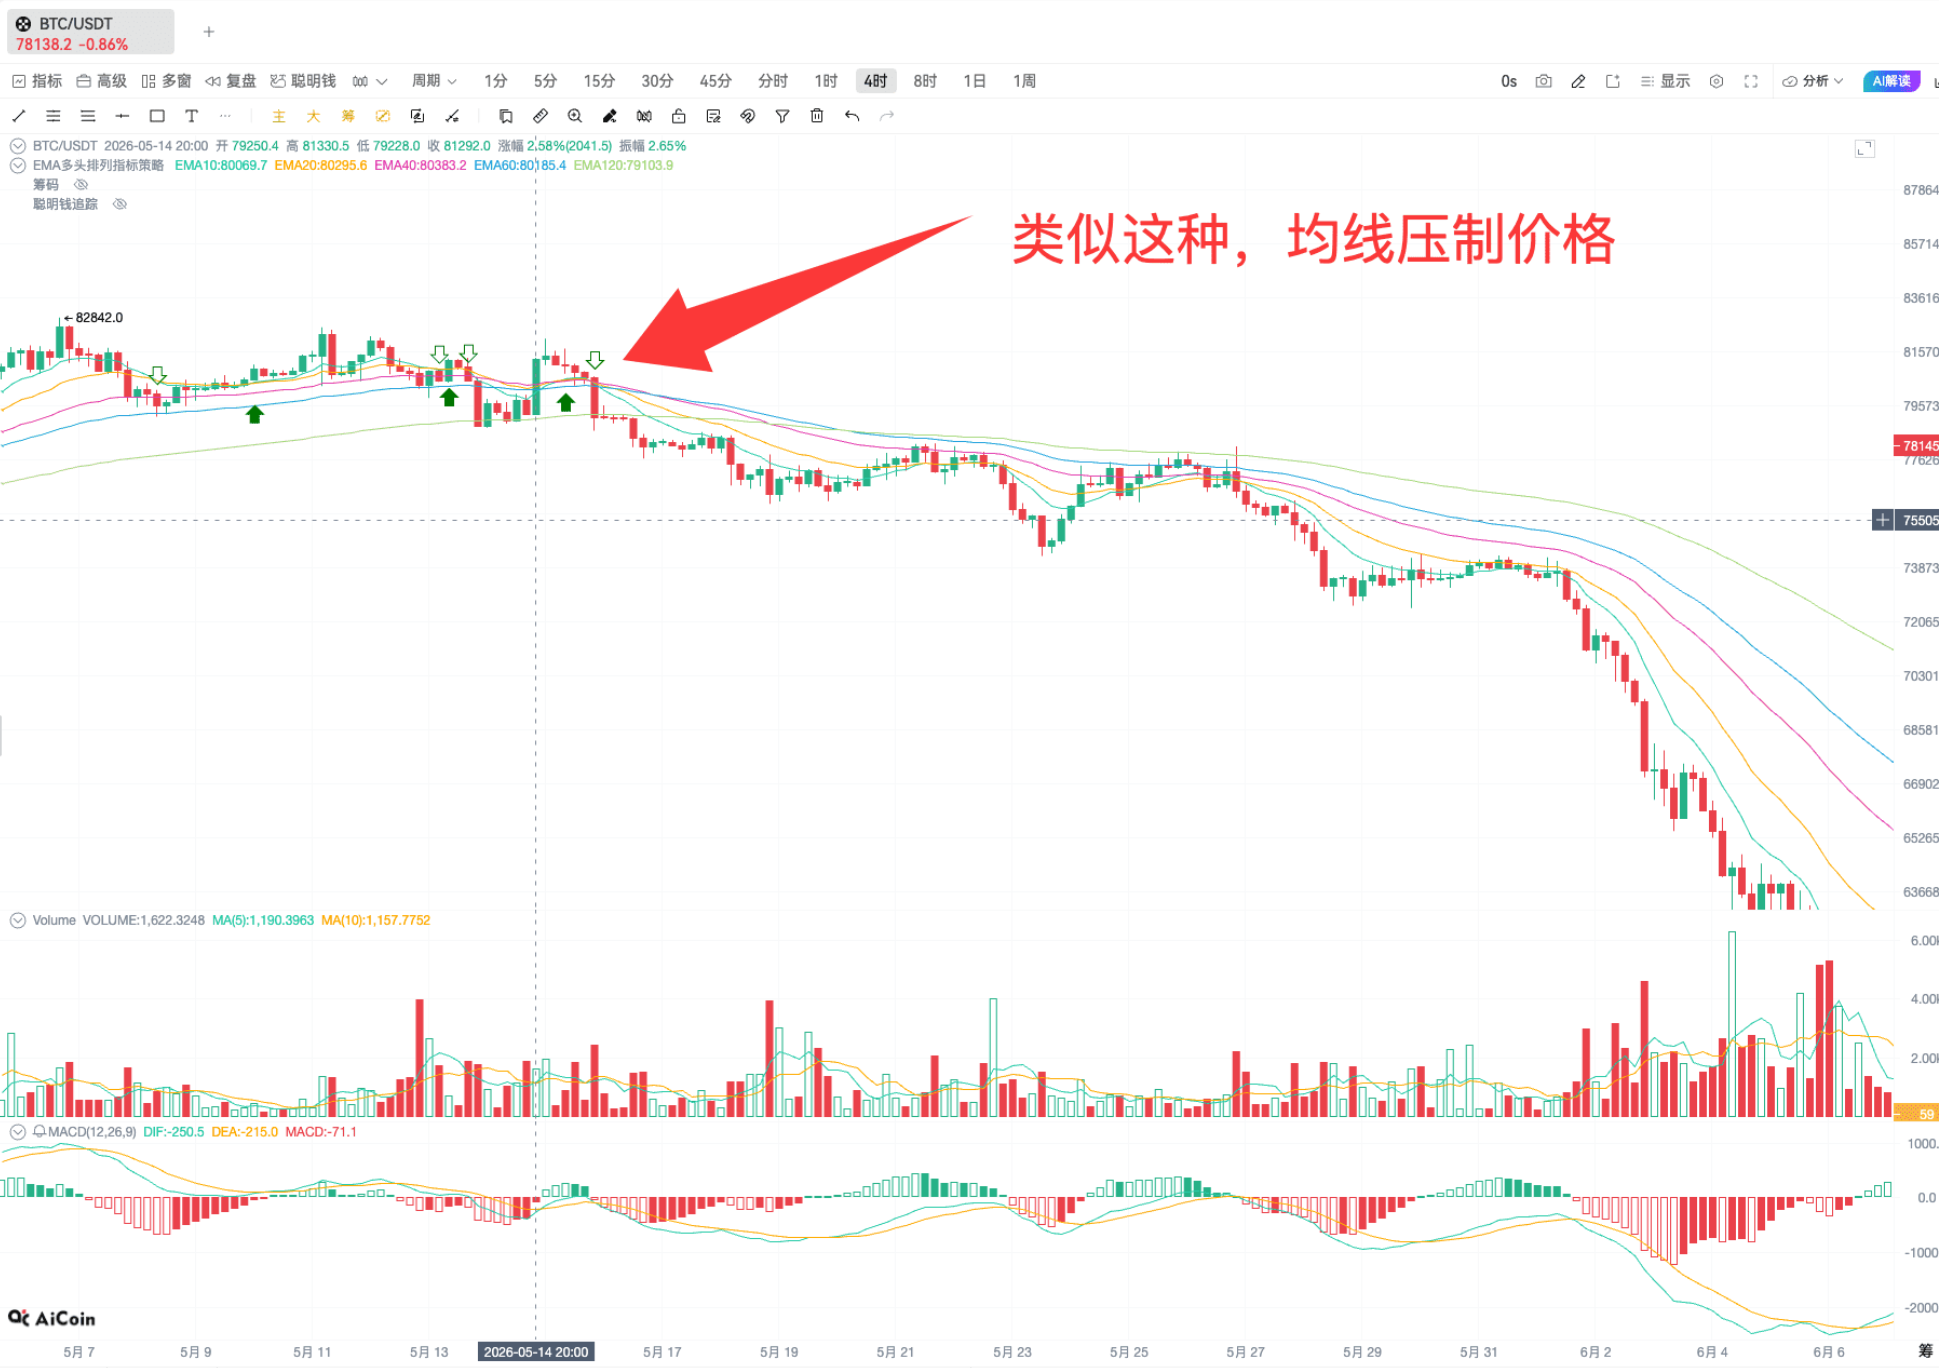
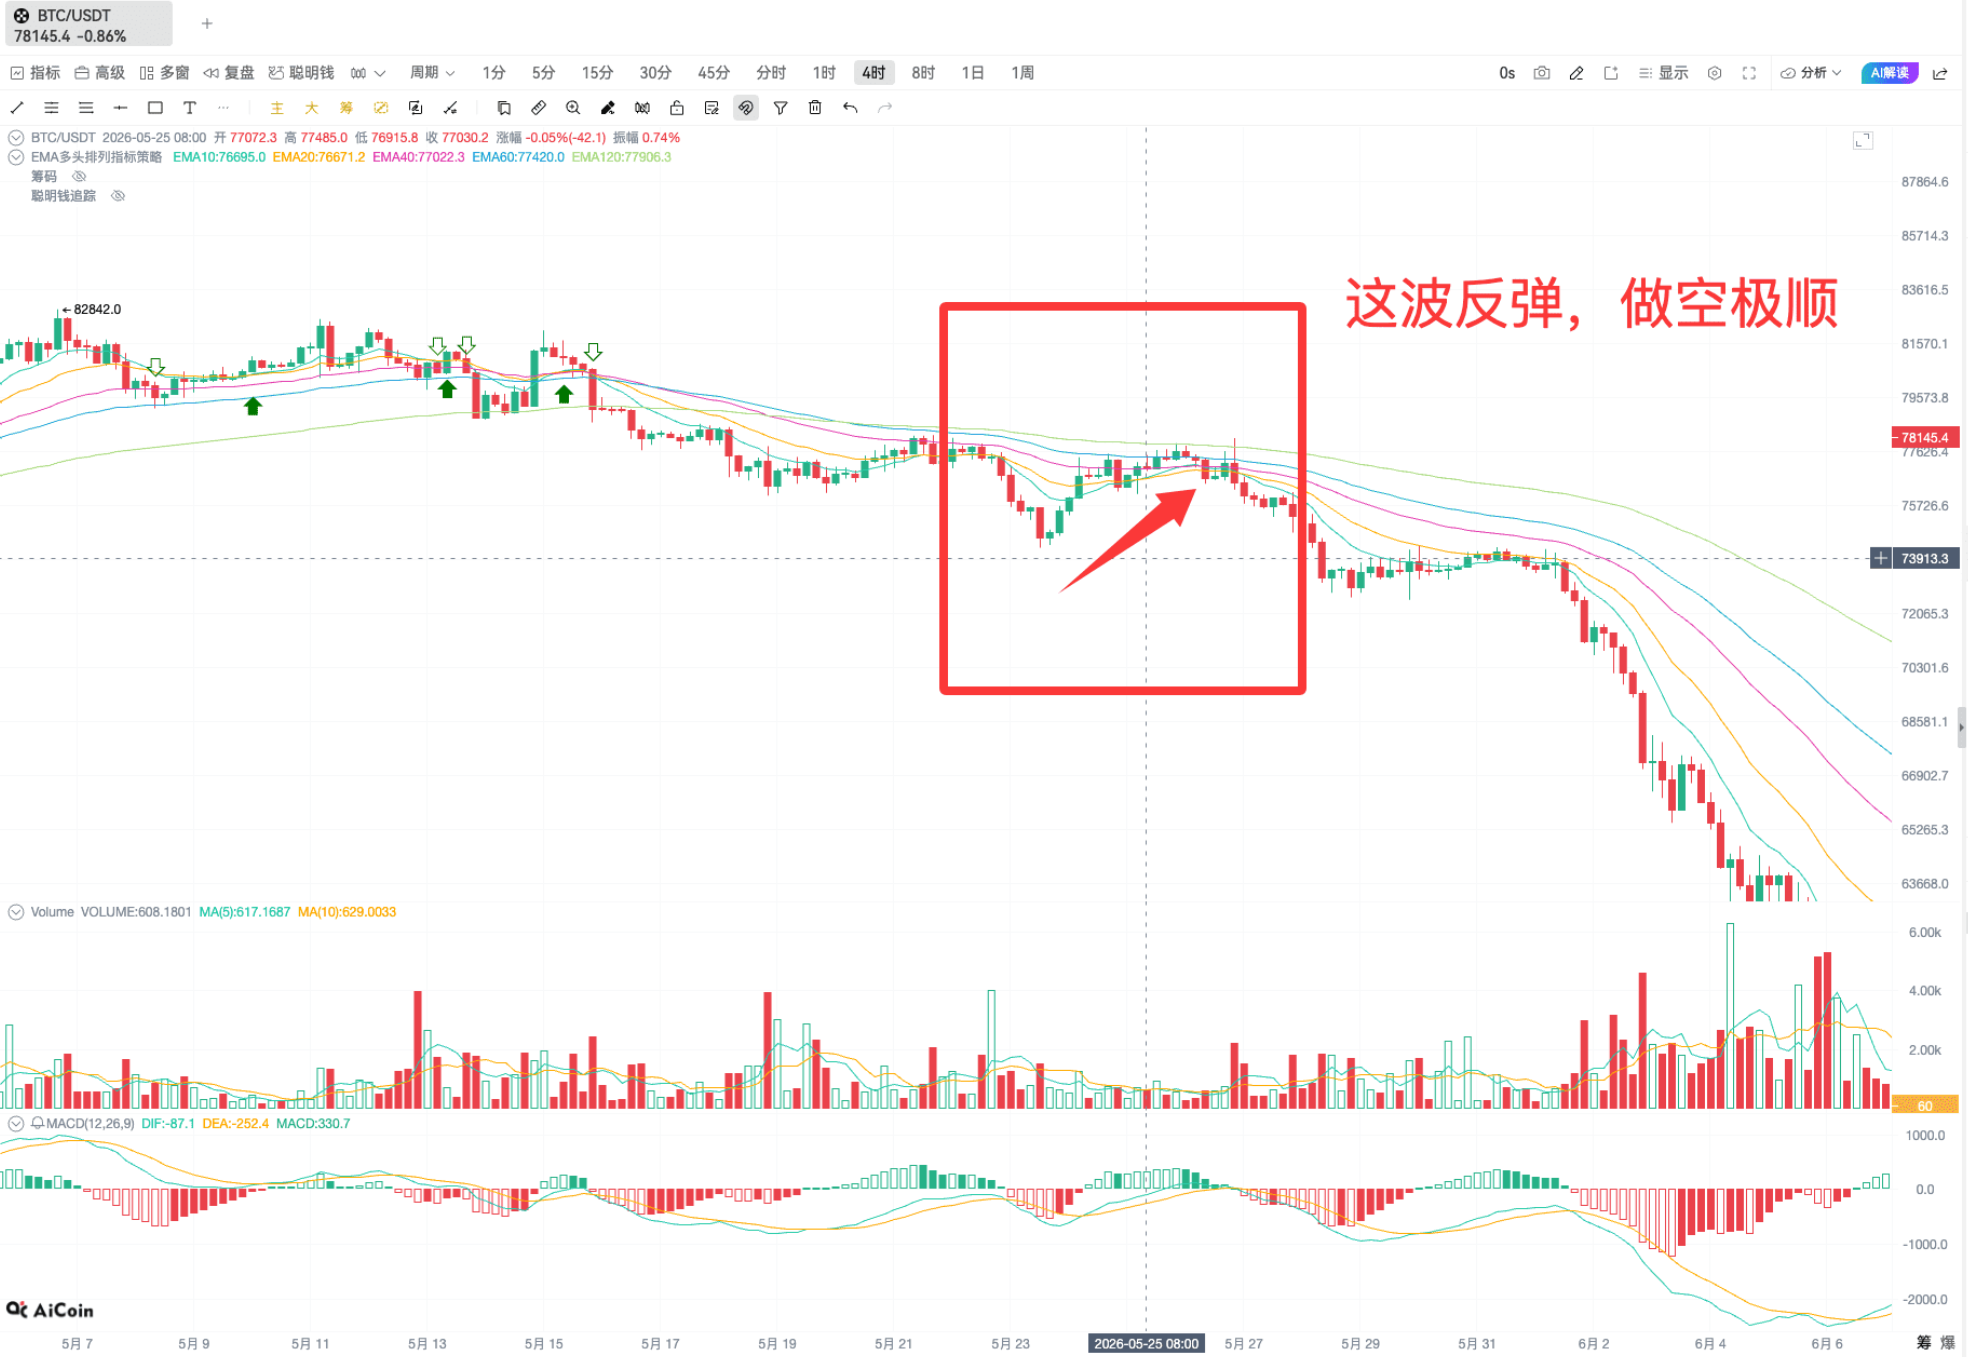
Real opportunities for shorting with high certainty only occur when all moving averages suppress the price from top to bottom, and every rebound meets resistance from the moving averages. Entering a short position under such a trend results in optimal win rates and profit-to-loss ratios. In contrast, based on the current market situation, the bulls still hold an absolute advantage.
We can further validate the market trend by overlaying the Fibonacci indicator. Switching to a 4-hour timeframe, the market has not even broken the key support level of 0.236 during recent pullbacks, indicating a robust bullish pattern. Meanwhile, the MACD indicator has flattened with minimal volume, suggesting that bearish momentum is almost exhausted.
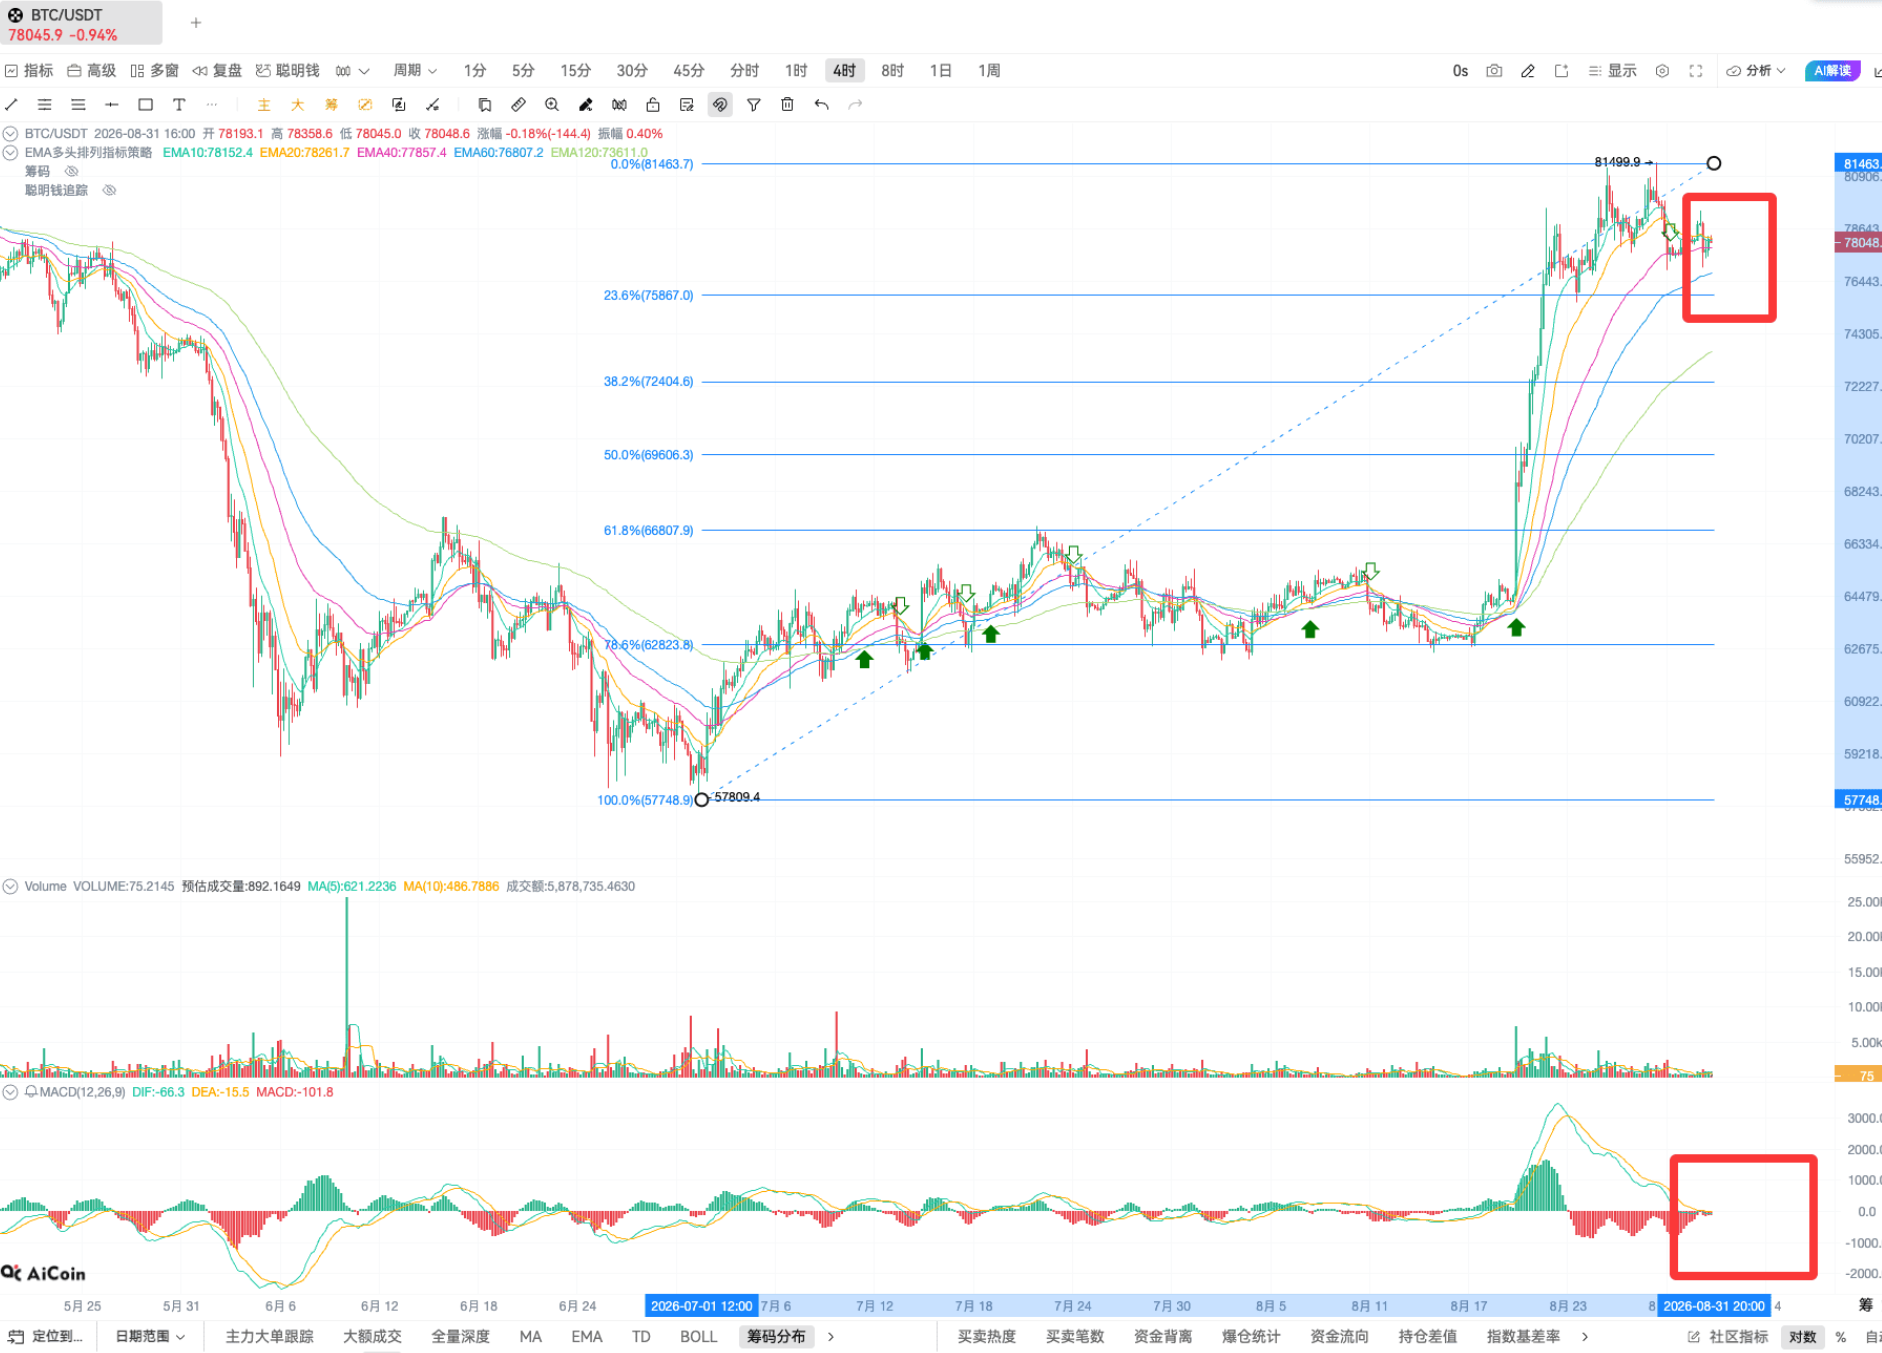
Under the resonance of multiple indicators, our research institute concludes: The current bullish trend of BTC remains solid, with no signs of weakening.
Finally, let’s use chip distribution for the ultimate validation.
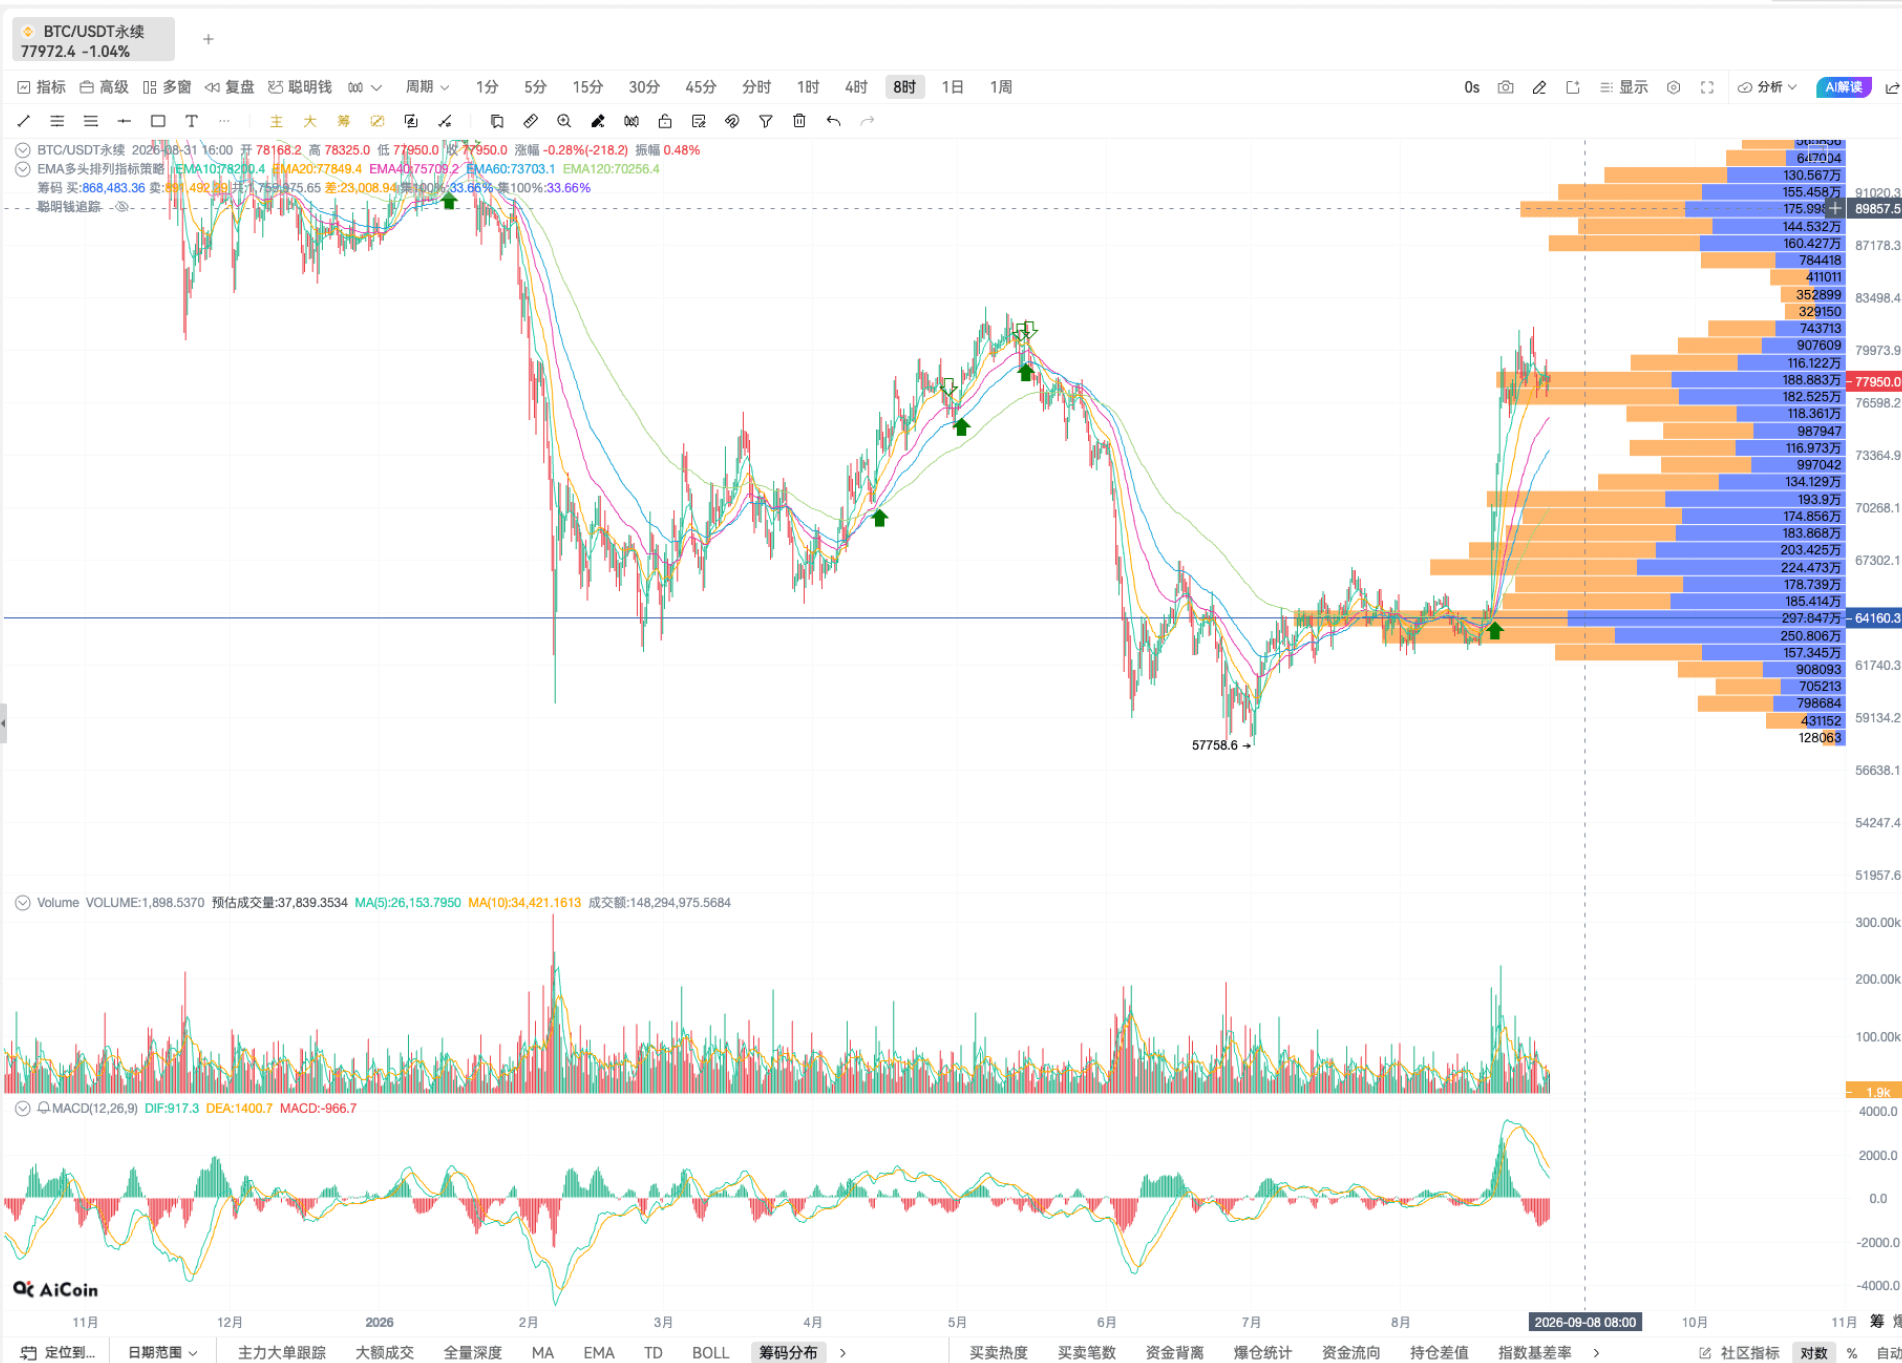
Currently, Bitcoin is stuck at a crucial position in the bull-bear game, with a densely packed strong support area below at 64,000 providing ample support. Considering the four major dimensions of EMA moving averages, Fibonacci, MACD, and chip distribution, the certainty of the bullish trend far exceeds that of the bearish trend.
For friends in different holding states, I will provide targeted practical suggestions.
For those who are optimistic and holding no positions, there’s no need to chase high blindly; patiently wait for the EMA bullish arrangement to show a resonance signal before entering the market to confidently benefit from the trend.
For those who are firmly bearish, do not randomly try to catch bottoms. You can open a membership to view the large order data, waiting for significant short orders from major investors to concentrate before entering; this will greatly reduce trial and error costs.
Many beginners may wonder why the EMA strategy has such a high win rate? Today, I will thoroughly explain the underlying logic, and understanding it will help you truly grasp the core of trend trading.
Firstly, it is due to the consensus among technical traders, leading to a self-fulfilling prophecy. The set of parameters 10, 20, 40, 60, 120 for EMA is a universal standard among global traders, quantitative institutions, and major funds. When the moving averages collectively turn upwards to form a bullish arrangement, massive quantitative trading algorithms will simultaneously trigger buy orders, combined with substantial buying from technical traders across the network, leading to significant buying pressure that will directly push the market higher and create trend resonance.
Secondly, there is the logic of dynamic support, which locks in the real cost of market positions. A standard bullish arrangement has the short-term, medium-term, and long-term moving averages arranged in order from bottom to top, with each moving average corresponding to the average holding cost of market participants in the respective time period. Every slight market pullback will receive strong chip support at key moving average positions such as EMA20 and EMA60, which are also our high win-rate points for secondary absorption and increasing positions.
It must be said that EMA is absolutely one of the few core indicators that are simple, stable, and have a high win rate in the crypto trend trading space.
Many people have asked about the complete form of bullish resonance; to put it simply: all EMA moving averages for short, medium, and long terms are diverging upwards simultaneously.
Many friends in the comments previously wanted my custom EMA indicator formula; today, I will share it with everyone for free, adapted to mainstream trading interfaces and ready to use upon import.
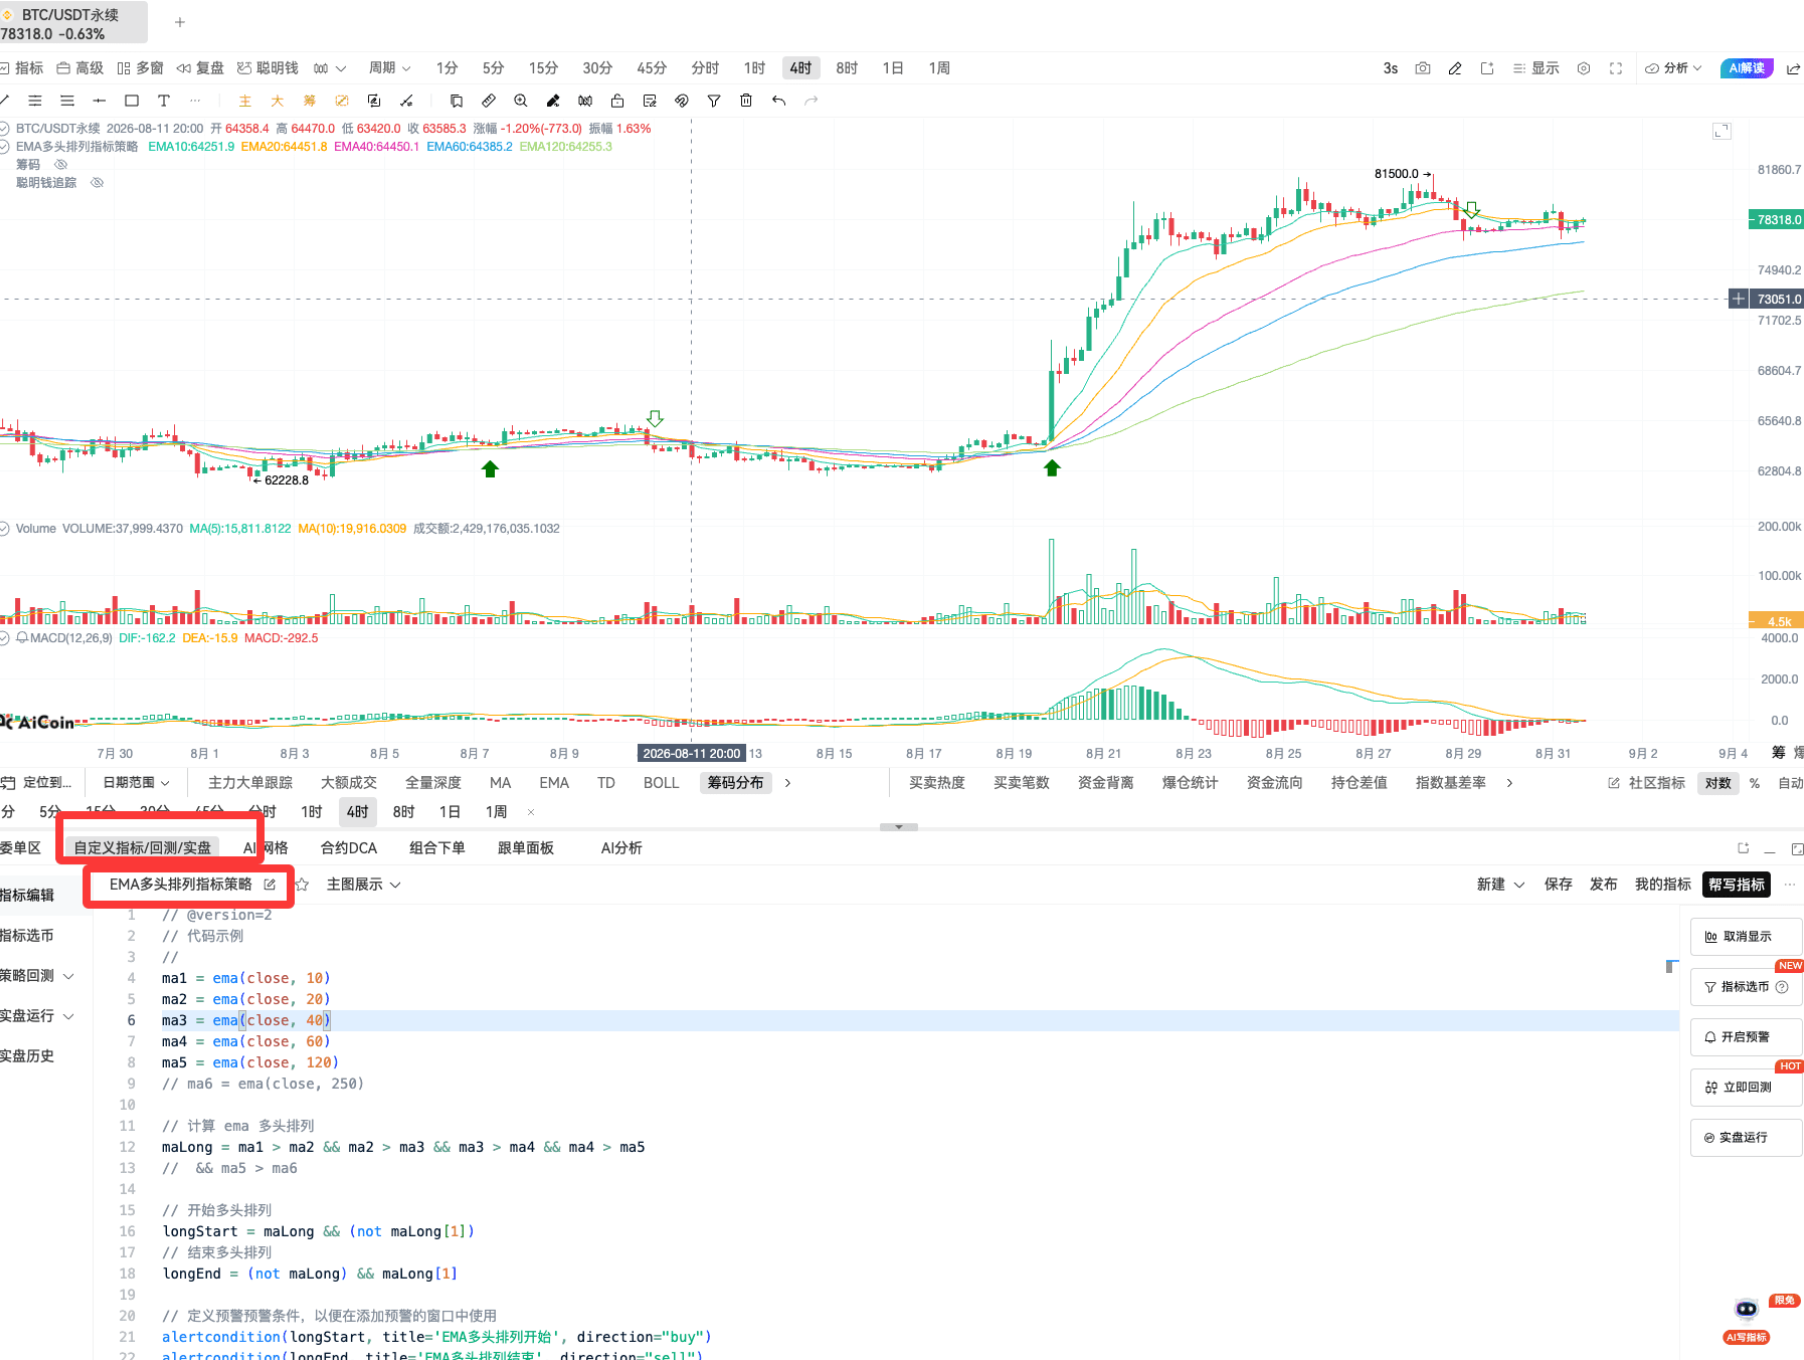
// @version=2
// Code example
//
ma1 = ema(close, 10)
ma2 = ema(close, 20)
ma3 = ema(close, 40)
ma4 = ema(close, 60)
ma5 = ema(close, 120)
// ma6 = ema(close, 250)
// Calculating EMA bullish arrangement
maLong = ma1 > ma2 && ma2 > ma3 && ma3 > ma4 && ma4 > ma5
// && ma5 > ma6
// Starting bullish arrangement
longStart = maLong && (not maLong[1])
// Ending bullish arrangement
longEnd = (not maLong) && maLong[1]
// Defining alert conditions for use in the alert window
alertcondition(longStart, title='EMA Bullish Arrangement Starts', direction="buy")
alertcondition(longEnd, title='EMA Bullish Arrangement Ends', direction="sell")
// Plotting on the chart
plot(ma1, title="EMA10")
plot(ma2, title="EMA20")
plot(ma3, title="EMA40")
plot(ma4, title="EMA60")
plot(ma5, title="EMA120")
// plot(ma6, title="EMA250")
plotShape(longStart, title="EMA Bullish Arrangement Starts", shape='arrowUp', color='green', refSeries=ma3, placement='bottom', fill=true)
plotShape(longEnd, title="EMA Bullish Arrangement Ends", shape='arrowDown', color='green', refSeries=ma3, placement='top', fill=false)
// Enter long and exit long
exitLong(longEnd, price='market', amount=1)
enterLong(longStart, price='market', amount=1)
For those who cannot import or set alerts, feel free to contact customer service for step-by-step guidance to help you adapt it to the AiCoin interface and enable smart signal notifications with a single click.
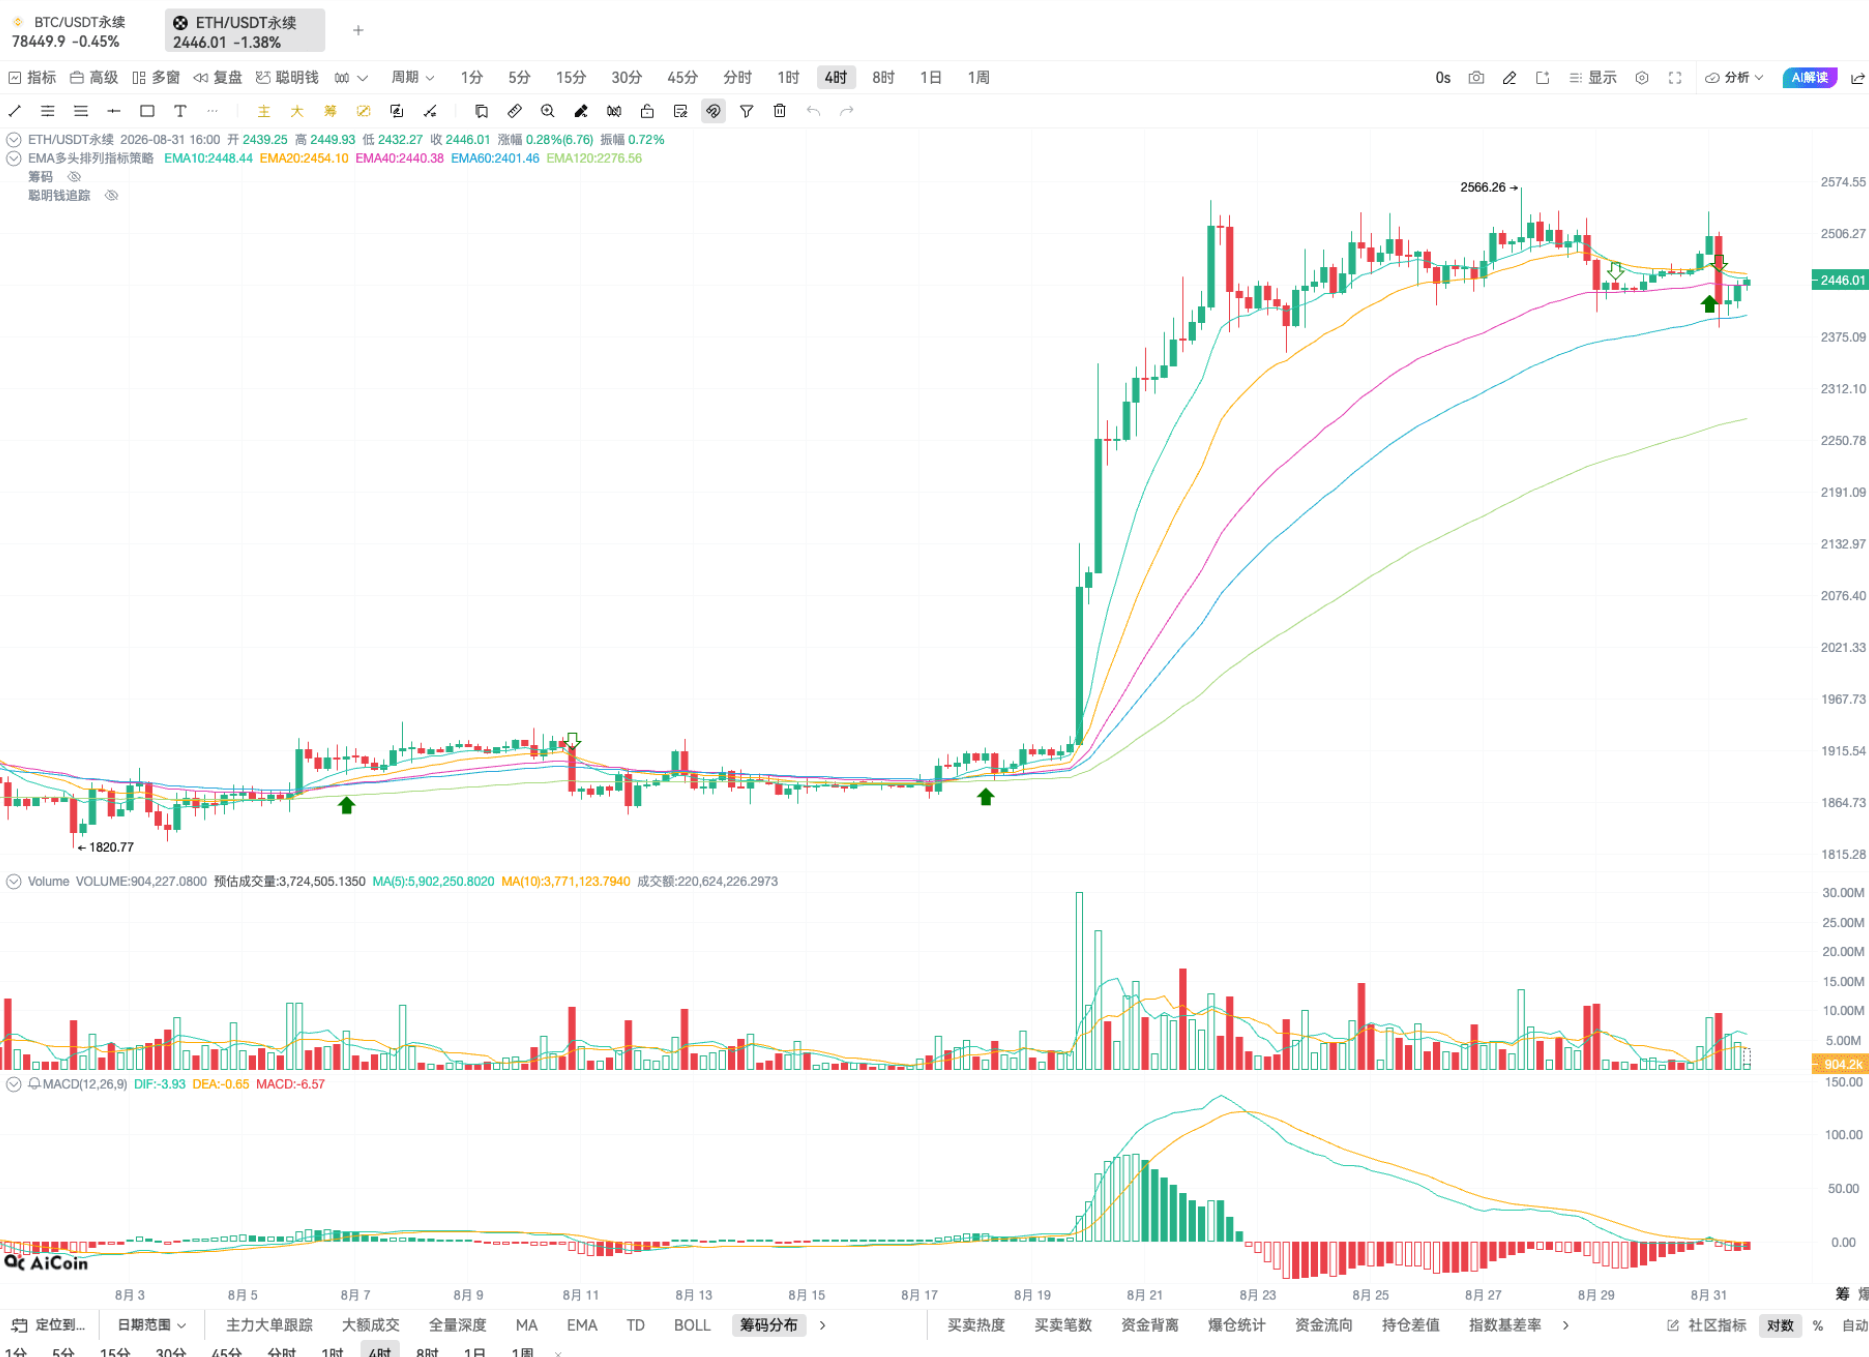
After discussing BTC, let’s also take a look at ETH opportunities. Using this EMA bullish arrangement indicator, ETH is currently also in a strong support zone, and its trend structure is very healthy.
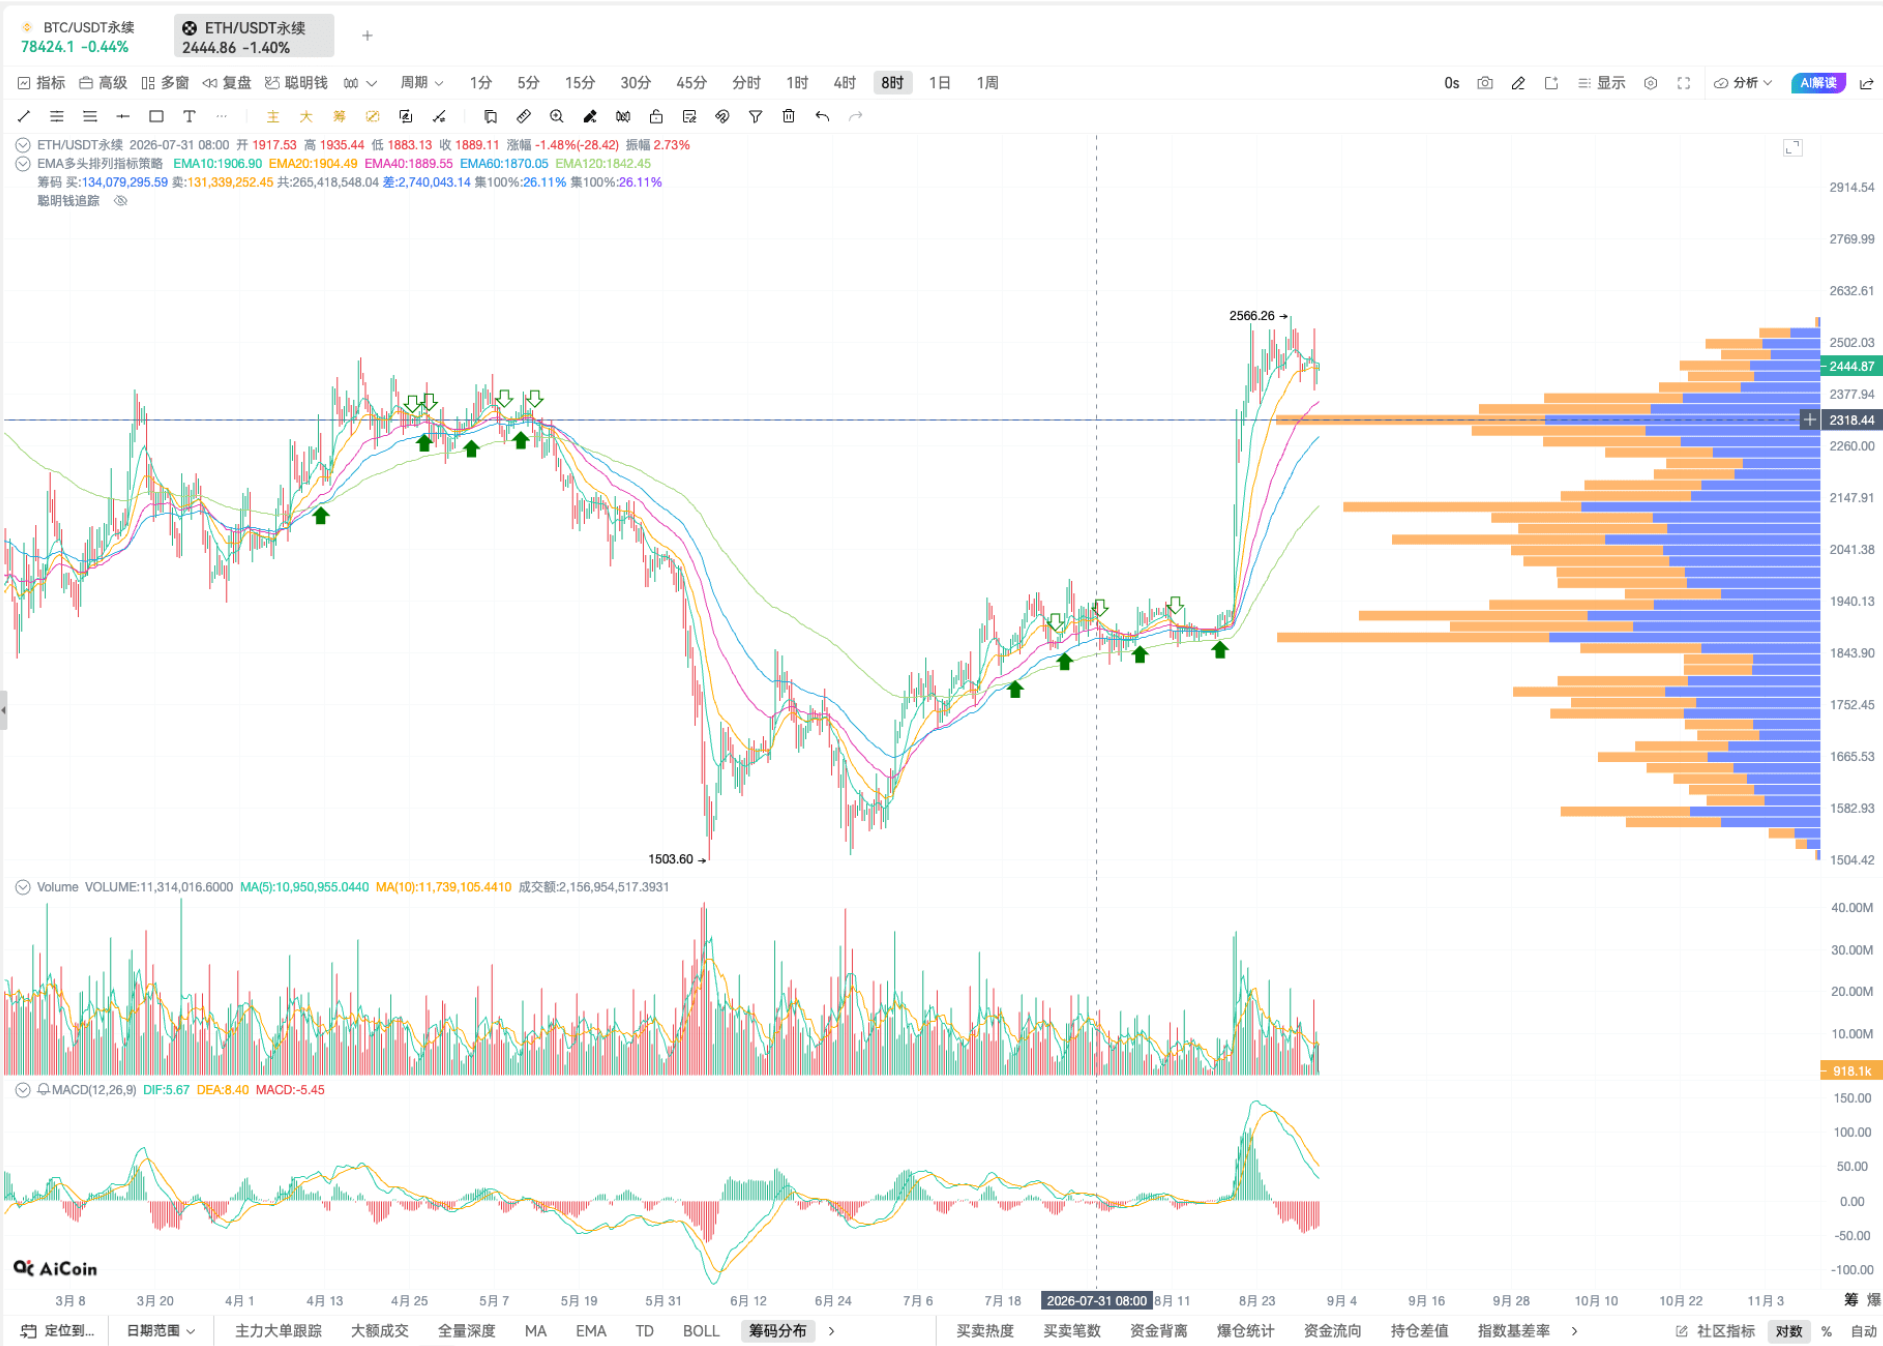
Overlaying chip distribution for further validation, ETH’s core support in the short term is locked at 2318, with an upward target around 2900. In terms of profit-to-loss ratio, the current layout for bullish ETH offers extremely high cost performance, with solid support below, limited pullback space, and ample upward potential, making it a typical quality asset for “low drawdown, high return.”
For friends who often struggle with entry points and cannot understand trends, it is essential to master this EMA bullish resonance strategy, as it can accurately capture trend movements for both BTC and ETH, helping you avoid ineffective fluctuations and seize core profits.
免责声明:本文章仅代表作者个人观点,不代表本平台的立场和观点。本文章仅供信息分享,不构成对任何人的任何投资建议。用户与作者之间的任何争议,与本平台无关。如网页中刊载的文章或图片涉及侵权,请提供相关的权利证明和身份证明发送邮件到support@aicoin.com,本平台相关工作人员将会进行核查。