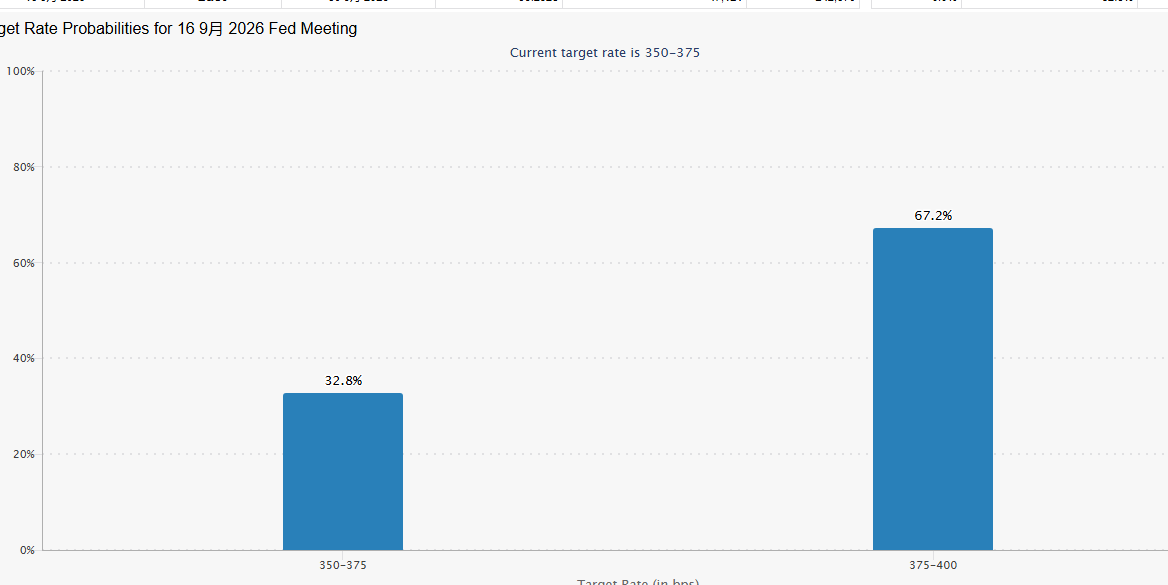
This morning's market, I believe everyone feels the chill. BTC has directly fallen below 77,000 USDT, with a 24-hour decline exceeding 2.46%. The trigger behind this is the soaring US treasury yield reaching 4.81%, setting a new high for the year, drastically increasing expectations for interest rate hikes, which directly suppresses the valuations of global risk assets. Coupled with the escalating conflict between the US and Iran, with US military strikes targeting Iran, the deterioration of geopolitical conflicts has sharply heightened risk-averse sentiment. Under this dual negative pressure, the crypto market has experienced panic selling, with liquidations across the network reaching as high as 110 million USDT within 4 hours, showing a clear effect of forced liquidation in concentrated long positions. This is what I often say, when the macro environment resonates with the technical aspects, the intensity of the decline often exceeds most people's expectations.
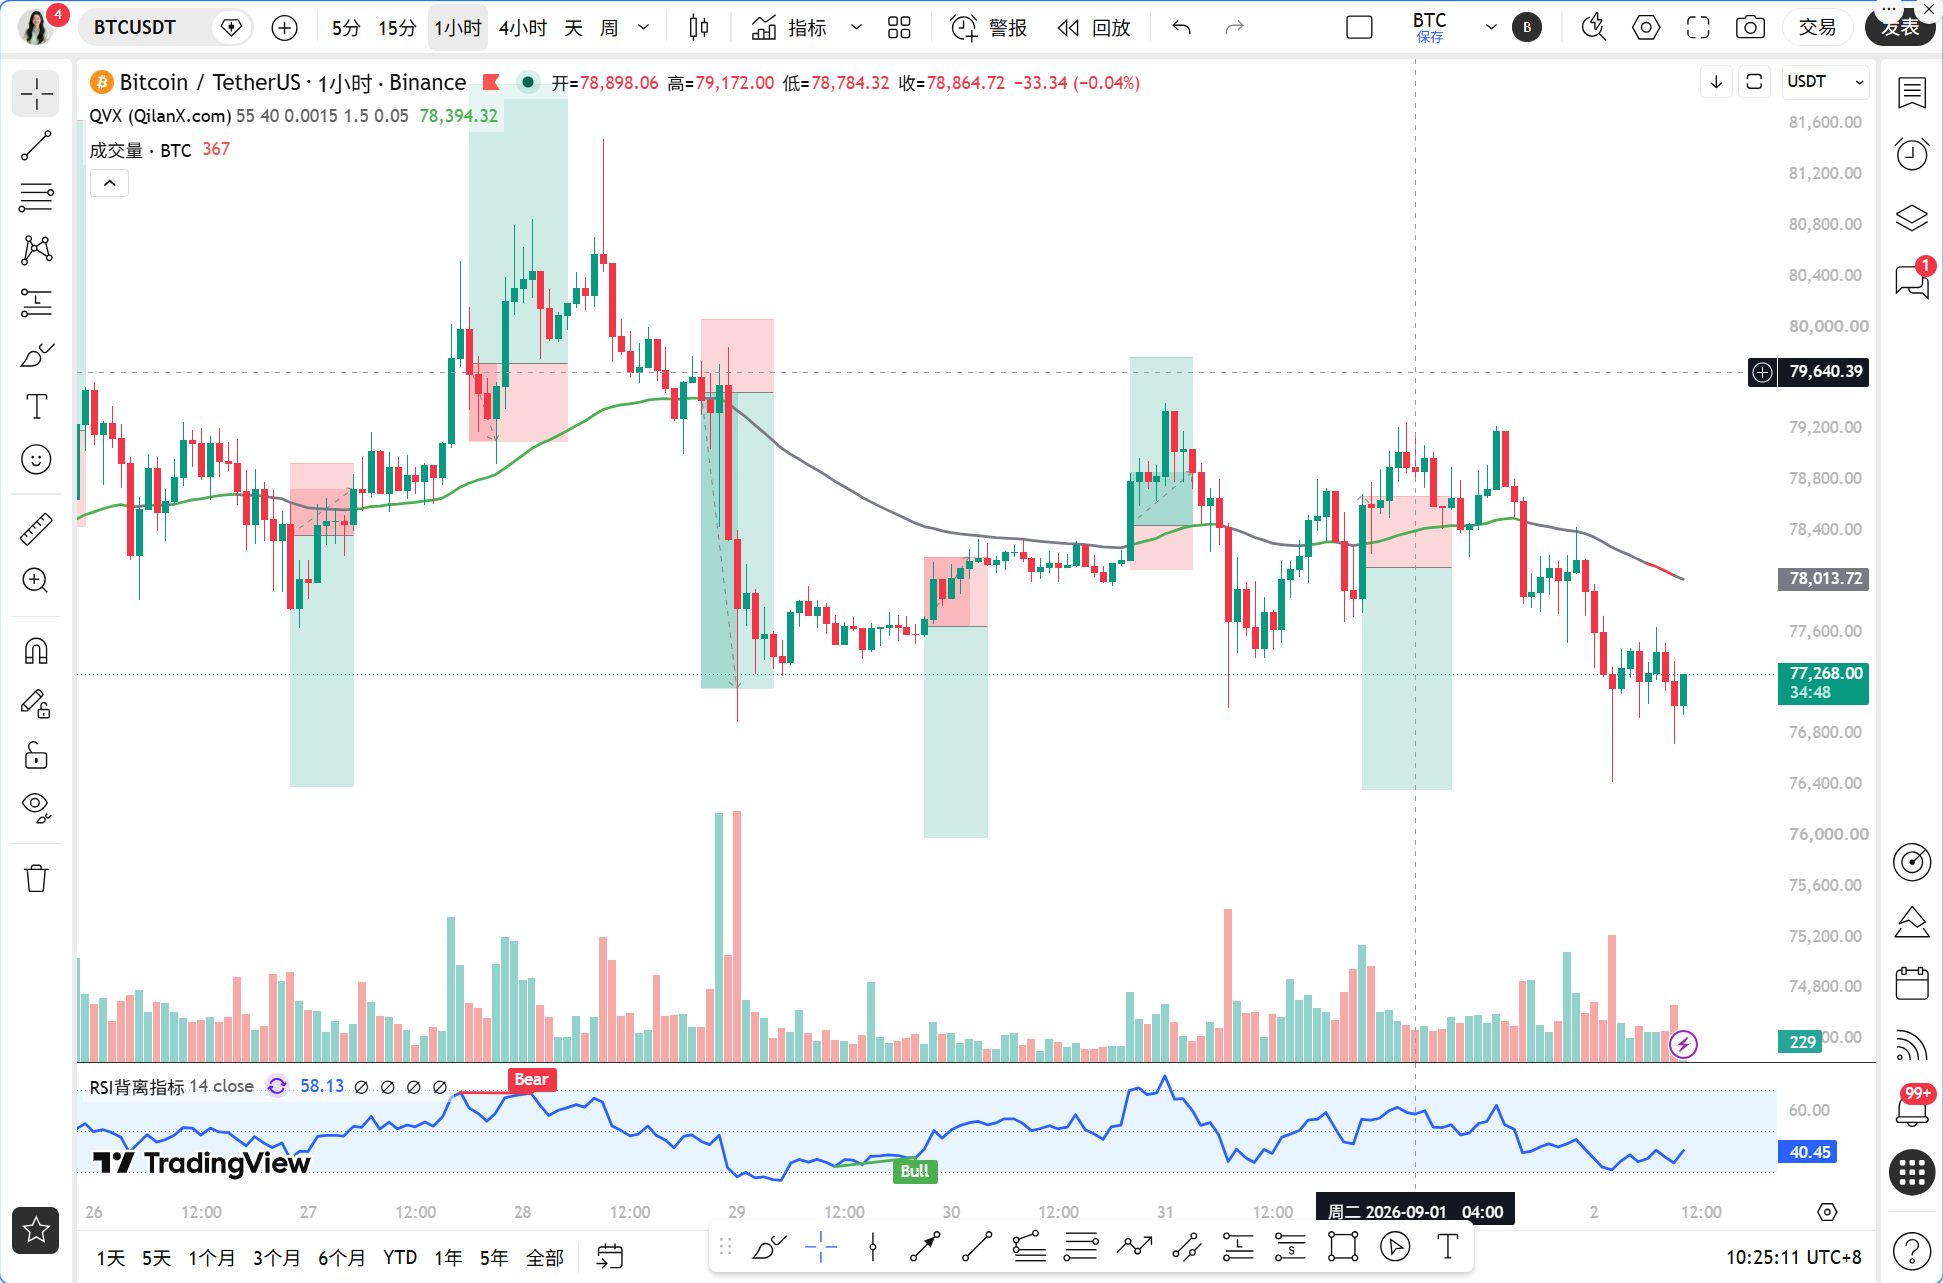
The current time is September 2, 10:25 AM, and the BTC price is 77,238 USDT. This position is very subtle, just slightly above the 77,000 integer level. From the market perspective, both long and short sides are fiercely contending for this position, but the overall center of gravity is clearly moving downwards. If you are still fantasizing about a V-shaped reversal, I suggest you calm down and take a look at the real status of various cycles below.
First, look at the daily level. The MACD has just formed a death cross, which is the first clear signal of a weakening trend. Although the RSI is still at a high level of 69.83, note that the daily MA5 has crossed below MA10, and the short-term moving average system has started to deteriorate. More critically, the daily MACD histogram has turned green, indicating that medium-term momentum is fading. Looking at the 4-hour level, the situation is even less optimistic. The MACD histogram has reached negative 130.38, with bearish momentum continuously amplifying, and the RSI is only 32.02, having entered the weak zone. All three moving averages MA5, MA10, and MA30 on the 4-hour chart are diverging downward, showing a typical bearish arrangement. The 1-hour level is similarly under pressure, with the MACD histogram at negative 33.04, and the RSI hovering around 35.12, with very limited rebound strength. Although the RSI on the 15-minute level has returned to 48.86, this is just a technical repair after overselling and does not change the overall weak pattern.
Now let’s verify the current signal using the Qinglan TPV system. First, look at the trend positioning; the current price is 77,238 USDT, while the 1-hour EMA55 is at 78,002.78 USDT. The price is clearly running below the EMA55, confirming the bearish trend area without a doubt. Next, look at the oscillation auxiliary data; in the past 8 1-hour candlesticks, the number of times the closing price was greater than EMA55 is 0, and the number of crossings is also 0. What does this indicate? It indicates that the market is completely under the control of bears, without a single decent retracement. The absolute distance of the current price from EMA55 is 0.98%, and although it has not reached the extreme oversold area of 3%, it has already exited the oscillation range and is in a one-sided downward trend. In terms of short conditions, the price has had consecutive closing prices below EMA55, satisfying condition one. In terms of formation, the 4-hour level has seen consecutive bearish candles without any long lower shadows or bottom formation stabilization signals, meeting the condition for pressure resistance. In terms of momentum, the MACD histogram remains negative and continues to expand, with the RSI falling back from high levels, showing no signs of exhaustion in downward momentum. All three short conditions are met, which constitutes a standard bearish trend market.
On-chain data also corroborates this judgment. The fear and greed index is at 63; although it is still in the greed zone, it has clearly retreated compared to before. The BTC market dominance is 59.1%, indicating that funds have not massively flowed into Bitcoin as a safe haven, and the overall risk appetite of the market has declined. A noteworthy headline is that BlackRock's IBIT has increased its holdings by 1,404 Bitcoins, worth 109 million US dollars. This signals that institutions are gradually building positions during the decline, but it is difficult to counter macro negative factors in the short term. Additionally, a certain institution sold 109,800 ETH in three days, realizing profits of 122 million US dollars; such whale profit-taking actions have a tangible negative impact on market sentiment. As long as the core contradiction of rising US treasury yields is not resolved, risk assets will struggle to have any decent rebounds.
Next, let’s examine the key attack and defense levels. The first resistance level above is near 78,000 USDT where the 1-hour EMA55 is located; this was also the starting point of this morning's decline. The second resistance level is in the area of 77,600 USDT where the 4-hour MA5 is located, and a short-term rebound to this level will encounter significant selling pressure. The first support level below is at the 77,000 USDT integer level; if this level is lost, it will open up downward space. The second support level looks at 76,000 USDT, which is the lower edge of the previously dense transaction area. If 77,000 fails, the bear target will directly aim at 75,000 USDT or even lower.
In terms of trading strategy, the direction is very clear: short on rebounds. Specifically, if the price rebounds to the range of 77,600 to 78,000 USDT and shows signs of stagnation at the 1-hour level, such as a long upper shadow or a top formation, one can cautiously enter a short position. The stop-loss should be set above 78,400 USDT, which is about 50 points above EMA55, to prevent false breakouts. The first target is at 77,000 USDT, and if broken, look to 76,000 USDT. If the price directly breaks below 77,000 USDT without a quick recovery, one can chase the short, with a stop-loss set at 77,400 USDT, targeting 76,000 USDT. On the long side, currently, there is no reason to go long unless the price stabilizes above the 1-hour EMA55 and confirms with two consecutive candlesticks. Otherwise, refrain from participating in any rebounds.
Risk warning: Geopolitical events carry high uncertainty; if there are signs of easing in the Middle East situation, it may trigger a retaliatory rebound, so short positions must strictly set stop losses.
Follow Qinglan Crypto Classroom for more trading opportunities! Welcome to visit the official website www.qinglan.org
📊 Qinglan TPV trading strategy backtest reference
🕒 Last backtest time 09-02 07:00:02
Total analysis: 3807 Backtests: 3800 Accuracy: 79.3% (3015/3800)
免责声明:本文章仅代表作者个人观点,不代表本平台的立场和观点。本文章仅供信息分享,不构成对任何人的任何投资建议。用户与作者之间的任何争议,与本平台无关。如网页中刊载的文章或图片涉及侵权,请提供相关的权利证明和身份证明发送邮件到support@aicoin.com,本平台相关工作人员将会进行核查。