Brothers, in the journey of the rivers and lakes, we do not fear distance; on the path of gambling, we meet confidants. Hello everyone, I am Jiang Ye.
⚠️ The following is only a technical logical deduction of the market, for exchange reference only, and does not constitute any investment advice. Market fluctuations are severe; contracts must strictly control positions and set stop losses.
Today, let's talk about a question many family members are asking: ETF funds are continuously flowing in; why can't the price just rise?
The latest data is here: The US spot Bitcoin ETF has clearly seen a significant inflow of capital again, with IBIT under BlackRock contributing notably, pushing the overall daily net inflow to about 217 million dollars, directly reversing the previous phase of capital outflow. The Ethereum spot ETF is even more aggressive, having maintained net inflow for 11 consecutive trading days, with relevant funds for XRP and Solana also buying.
Logically, continuous institutional buying should push BTC up. Yet the market's response is rather counterintuitive: Bitcoin fluctuates repeatedly around 77,000 to 78,000 but does not break through. After rising 25% in August, the ETF funds returned in September, but the price is stuck.
Thus, the question arises: Who is selling? What are the institutions waiting for?
1. Institutions have not left the market; money is indeed coming in
First, let's clarify a fact: the demand for institutional allocation has not disappeared.
This time, it's not just Bitcoin being bought; the Ethereum ETF has seen net inflow for over 10 days consecutively, and the products related to XRP and Solana are also continuously attracting funds. Funding is shifting from a sole BTC focus to a wider array of crypto assets.
ETFs are a compliant channel for traditional capital to enter the crypto market, and their continuous inflow indicates a core issue: The market does not lack buyers.
So the question becomes—if there are buyers, why can't the price rise?
2. The most concerning signal: Capital and price are "diverging"
Under normal logic, continuous net inflows of ETFs = incremental buying pressure = upward price movement. However, the current market is clearly different: ETFs are buying, but BTC is not rising.
This does not imply that ETF funds are ineffective; a more likely explanation is: Institutional buying is being absorbed by other selling.
To put it bluntly, it is not that no one is buying; rather, there are many buyers, but there are also quite a few sellers.
This stage often appears after a significant increase, during a period of rebalancing: earlier low-position holders are cashing in profits, while new funds are stepping in at higher levels. The final manifestation is a sideways price movement, with funds continuing to flow in.
3. Who is selling? Four forces are offsetting institutional buying
First force: Early profit-takers are cashing in. In August, BTC rose nearly 25%, peaking above 81,000 dollars. For funds that held at lower positions earlier, cashing in profits at this level is quite normal. Medium to long-term holders, short-term traders, and those who positioned at lower levels may all gradually cash out in the 78,000 to 81,000 zone. Thus, what you see is: ETFs are receiving goods, while old funds are selling goods; the two forces offset each other, making it naturally difficult for the price to break through.
Second force: Periodic supplies from whales and miners. After BTC rises, large-scale address funding on the chain becomes more active. Whales might cash in some profits, and miners could also use the price rebound to improve cash flow. These funds may not necessarily indicate a long-term bearish outlook but rather complete a cyclical position adjustment. However, for short-term pricing, these chips ultimately become selling pressure.
Third force: Leverage capital makes the market more sensitive. The spot ETF buys BTC, but the market also has large-scale futures and perpetual contracts. When prices are fluctuating at key positions, both longs and shorts continuously adjust their leverage positions. After a breakout failure, shorts add positions; if a sudden drop occurs, longs are forced to close out. Therefore, even if spot funds are flowing in, changes in leverage in the derivatives market may lead to cases of "funds flowing in but prices not rising, or even temporarily declining." This is why one cannot rely solely on ETF data for trading.
Fourth force: Macro conditions continue to suppress risk appetite. Federal Reserve policy expectations, dollar movements, oil prices, and geopolitical issues in the Middle East are all affecting institutions' risk appetite. Particularly with the market reconvening to trade under the conditions of "high interest rates maintaining for longer," even if institutions are willing to allocate BTC, they may not be eager to aggressively increase positions in the short term. Hence, ETF fund inflows resemble slow accumulation rather than immediate price boosts.
4. ETF inflow does not equal BTC soaring
This is the most easily misunderstood point in the current market. ETF net inflow is merely one necessary condition for a rise, not a sufficient one. Whether BTC can truly launch depends on three variables:
First, watch when selling pressure weakens. If profit-takers continue to release, ETF funds will need to continuously absorb these chips. Only when selling pressure clearly decreases can new funds more easily convert to real price increases.
Second, watch if leverage positions are cleared. If high leverage positions are not fully digested, BTC will likely experience fake breakouts and breakdowns at key positions. Once the leverage bubble is cleaned out, the market conditions will be cleaner.
Third, watch if macro liquidity can improve. This is key to determining whether institutions dare to further increase their risk exposure. Only when interest rates and dollar pressure ease can the marginal impact of ETF funds significantly strengthen.
In simple terms: Institutions are already buying, but there isn't enough reason yet to go on a buying spree.
5. What exactly are institutions waiting for?
The answer may not be a specific price but three signals emerging simultaneously:
① Easing macro pressure. A clearer Federal Reserve policy path, declining interest rates and dollar pressure, and a renewed rise in risk appetite.
② BTC breaking key resistance. Currently, the 80,000 dollar mark remains an important psychological barrier. If BTC can break out significantly and stabilize above 80,000, it will indicate that the market is beginning to digest the prior profit-takers.
③ ETF funds shifting from "daily inflow" to "sustained inflow." A daily inflow of 200 million dollars does not determine a trend; what truly matters is whether institutional funds continue to maintain net inflow in the coming week or two. Continuous increases in funds + prices starting to break through will officially end the "funds - prices" divergence.
6. Given the current technical perspective, the state of the market and capital perfectly align
Returning to the market, the current technical and capital perspectives are highly aligned: Funds flowing in indicate support below while stagnant prices indicate selling pressure above; in essence, it is range-bound trading.
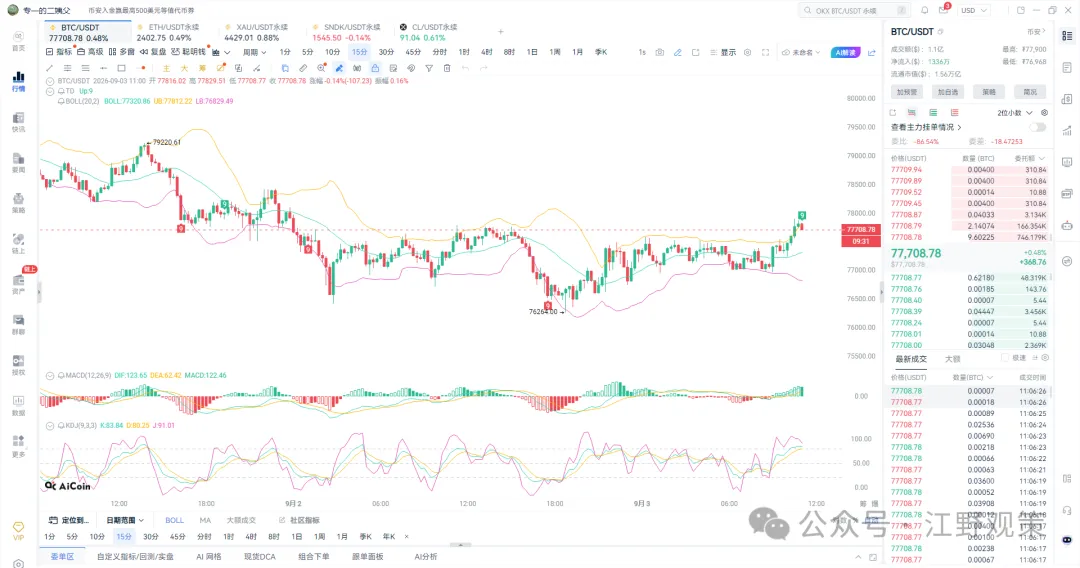
BTC (Bitcoin)
15 minutes
: TD Up:6, starting a rebound from the low of 76264, the price breaks through the Bollinger upper band at 77249, running at 77600; MACD golden cross with red bars expanding to 84.73, bullish momentum is strong; however, KDJ J value at 106.53 is extremely overbought, indicating a short-term need for a pullback.
1 hour
: TD Up:2, the upward count has just begun, the price breaks through the Bollinger upper band at 77153, currently testing the mid-band at 77704 resistance; MACD DIF-33.11 crosses above DEA-95.47 golden cross, red bars expand to 124.72, hourly bearish momentum is officially converging.
Conclusion
: A short-term rebound pattern is established, with first resistance above at 77704, second resistance at 78500, and strong resistance at 79700; support below at 76918, strong support at 76264. However, the 4-hour major trend remains a bearish structure, and this rebound is a correction rather than a reversal; it is likely to encounter resistance and fall back at the pressure points.
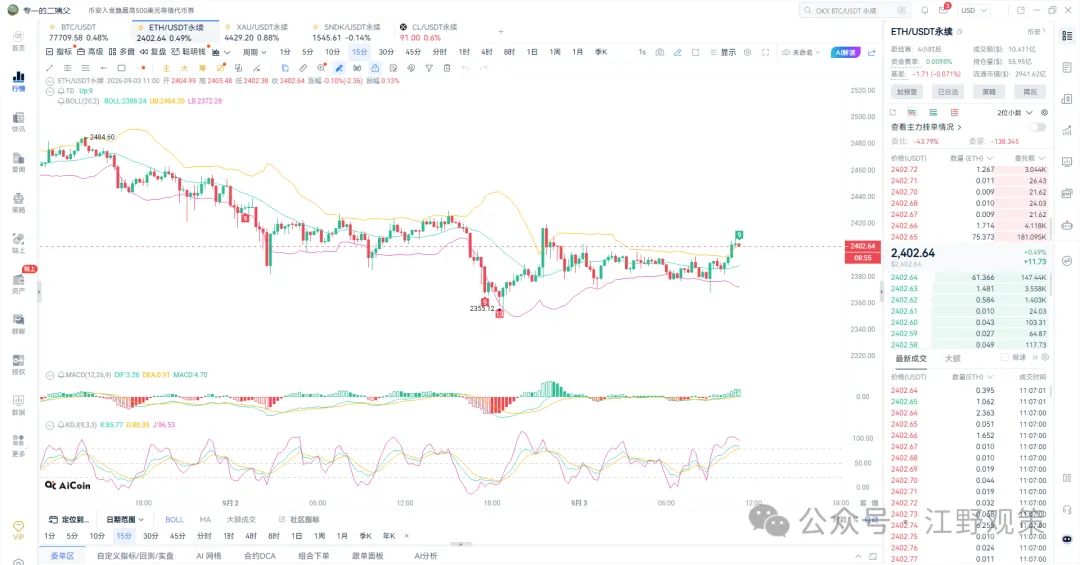
ETH (Ethereum)
15 minutes
: TD Up:6, initiating a rebound from the low of 2355 in sync with Bitcoin, the price breaks through the Bollinger upper band at 2385.96, currently running at 2394, testing the mid-band at 2395 resistance; MACD golden cross with red bar at 2.26, KDJ J value at 102.45 is overbought.
1 hour
: TD Up:1, the upward count has just started, price breaks through the Bollinger upper band at 2388.86, with first resistance above at 2409 (Bollinger mid-band); MACD DIF-7.38 crosses above DEA-9.55 golden cross, red bar at 4.35, and bearish momentum converges.
Conclusion
: The 4-hour TD bearish count reaches 9, the downward cycle approaches its time window, and downward momentum is significantly exhausted, forming dual support at 2355-2365. The 1-hour pullback to 2355 completes a bottoming, with MACD divergence below zero axis + rising red bars indicating a short-term start of bottom recovery. First resistance at 2409, second resistance at 2414, strong resistance at 2429. As long as it breaks and stabilizes above 2429 with volume, the 4-hour medium-term downward trend will be broken. As long as 2355 is not effectively broken down, a phase bottom may be established.
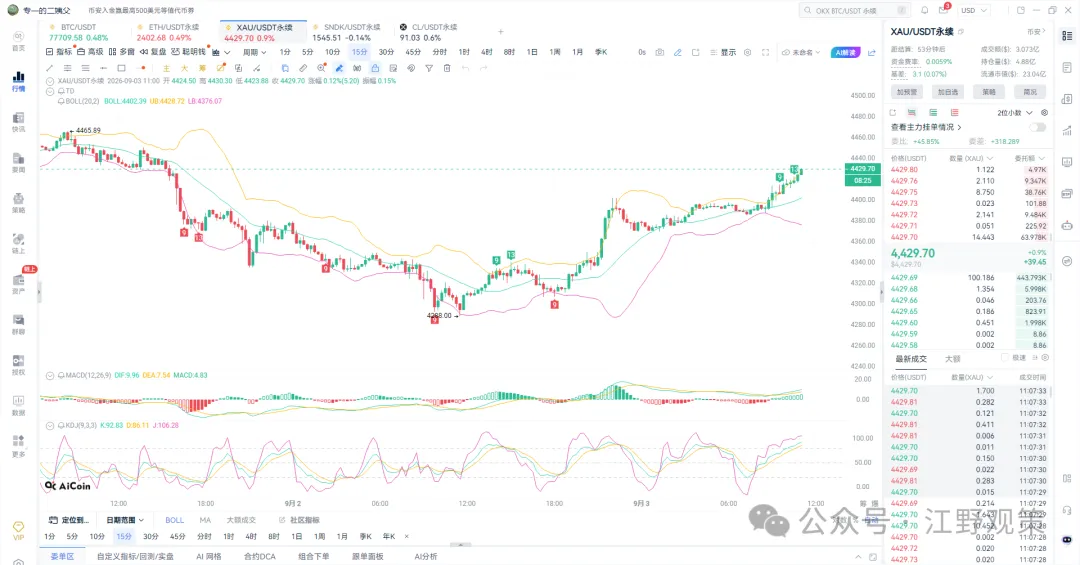
XAU Gold
15 minutes
: TD Up:13, an extended upward sequence, starting a consecutive rise of 13 candles from a low of 4306, price running at 4417 testing the mid-band resistance at 4419; KDJ J value at 100.96 is overbought.
1 hour
: TD Up:3, rebounding from a low of 4288, price breaks through the Bollinger upper band at 4371.82 running at 4421, with first resistance above at 4437 (Bollinger mid-band); MACD golden cross red bars expand to 12.13, bullish momentum is strong; KDJ K90.66, J101.77 is extremely overbought.
Conclusion
: Gold has launched a strong rebound from the 4288 low, but the current market pattern is an oversold rebound, and has not escaped the bearish structure; thus it indicates a bearish fluctuation. Resistance above at 4437, strong resistance at 4480. If tomorrow's non-farm payroll meets or exceeds expectations, interest rate repricing will continue, placing gold under further pressure. Prior to the data release, selling at high points is the decision with the highest probability of success.
7. Comprehensive conclusion of the three varieties resonance
Variety | 15 minutes TD | 1 hour TD | 1 hour MACD | 1 hour Bollinger Band | Short-term judgment |
|---|---|---|---|---|---|
BTC | Up6 | Up2 | Golden cross with expanding red bars | Breaking the upper band, testing the mid-band at 77704 | Short-term rebound, major cycle not reversed |
ETH | Up6 | Up1 | Golden cross with red bars | Breaking the upper band, testing the mid-band at 2409 | Bottom recovery, 2355 is key |
Gold | Up13 | Up3 | Golden cross with expanding red bars | Breaking the upper band, testing the mid-band at 4437 | Oversold rebound, generally bearish fluctuation |
Core conclusion:
Short-term (1-4 hours)
: All three varieties are synchronously rebounding and repairing; the 1-hour MACD has all golden crosses, bullish momentum is released, with short-term upward space remaining.
Medium-term (over 4 hours)
: The major cycle bearish structure has not been broken; this round of rebounds belongs to a repair after an oversold condition, not a trend reversal. BTC needs to stabilize above 79700, ETH above 2429, and Gold above 4480 to confirm a medium-term reversal.
The big non-farm payroll tomorrow night is a decisive event.
Before the data is released, the market will likely maintain range-bound fluctuations, and it won't show a clean one-sided trend. After the data is released, a direction will be chosen.
Capital and technical resonance
: ETF inflows show support below; do not blindly pursue short positions; stagnant prices indicate selling pressure above; do not blindly pursue long positions. It's a range-bound market, high short and low buy.
8. Daily practical operation strategy
BTC Operation
Low long (short-term repair, light positions before non-farm)
After a pullback, stabilize in the 76900-77300 range, take light long positions, stop loss at 76500, target 77700→78500
Deep pullback to 76500-76000 is a stronger support; if it stabilizes, one can increase long positions, stop loss at 75700, target 79100→79300
Note: This is a short-term repair long position; when reaching 78500-79700 pressure zone, positions must be reduced, do not be stubborn.
High short (major trend, primary thought before non-farm)
When rebounding to the 78500-79700 range with stagnation, if a long upper shadow / engulfing bearish candle appears, take light short positions, stop loss at 80000, target 77000→75500
Aggressive traders can take light short positions if encountering resistance near 77700, stop loss at 78200, target 76500→75000
Emphasis: Before non-farm data is released, high shorts are the decision with the highest success rate, but positions must remain light.
ETH Operation
Low long (bottom repair, one of the main thoughts)
In the 2383-2390 range
lightly long as a position, leaving some for later, stop loss at 2330, target 2450→2465
Pull back to the 2355-2350 range (dual support) is a better low entry point; if stabilized, increase long positions, stop loss at 2330, target 2414→2429
Short-term reference: Directly long at 2386, target 2416, set defense at 20 points
Note: As long as 2355 is not effectively broken down, a phase bottom may be established; if it breaks below 2355, abandon long positions.
High short (major trend, light positions at resistance)
Rebound to the 2450-2465 range with stagnation, take light short positions, stop loss at 2480, target 2400→2355
Strong resistance at 2530; if encountering resistance at this point, one can increase short positions, stop loss at 2560, target 2450→2400
Gold XAU Operation
High short (main thought, highest success rate before non-farm)
Rebound to near 4480, take light short positions, stop loss at 4510, target 4400→4350
If non-farm data meets or exceeds expectations, gold may come under pressure again, allowing short positions to be held for deeper targets.
Low long (only support level in the very short term)
Pull back to the 4400-4410 range stabilizing, can lightly bet on a rebound, stop loss at 4380, target 4450→4480, quick in-and-out.
The major cycle is bearish, and long positions should not be held on too long.
9. Key signals to watch next
Combining capital and technical perspectives, keep an eye on three signals:
ETF should focus on sustainability, not just daily figures.
A single day's inflow only indicates that funds have returned; a continuous inflow over multiple days or even weeks is needed to prove that institutional allocation demand is strengthening.
BTC must establish a true foothold above 80,000 dollars.
A breakout is just the first step; what matters is whether a new support can form afterward. Repeated rising and falling indicate significant selling pressure above.
ETH, SOL, XRP indicate whether funds are broadly spreading.
If funds are migrating from BTC towards higher volatility assets, it indicates an increase in risk appetite; if ETF funds for multiple assets are simultaneously cooling down, then be cautious of macro factors reasserting dominance.
10. Price stagnation is not necessarily a bad thing
Continual ETF inflows but temporary stagnation in BTC price seems contradictory at first glance. However, from another perspective, it may indicate that the market is completing a round of chip exchanges: institutional funds are continuously being absorbed while earlier profit-takers gradually exit.
If subsequent selling pressure is sufficiently digested and ETF funds can maintain continuous inflows, the current "stagnation" might actually become a period of accumulation before the next rally.
Of course, another possibility also exists: if ETF funds start to weaken and BTC breaks down critical support, then the current divergence between funds and prices may evolve from "accumulating momentum" to a genuine weakening trend.
Thus, rather than fixating on "If ETFs are buying, why isn’t BTC rising?" it is better to focus on three critical questions that determine the trend: Will ETFs continue to buy? Can the 80,000 dollar mark hold steady? When will selling pressure truly dissipate?
When answers emerge, the market will likely also provide direction for the next phase.
⚠️ Risk Warning: The above content is merely a technical logical deduction of the market, intended for reference and exchange only, and does not constitute any investment advice. The financial market is highly volatile; contract trading carries significant risks. Please trade rationally, strictly control positions, use stop losses, and take responsibility for gains and losses.
Thank you all for your trust and companionship. The market changes rapidly; a stable compounding strategy is the way to longevity. I am Jiang Ye; see you next time.
For real-time point changes during trading, you can follow along and communicate. Three lines jyx9188

免责声明:本文章仅代表作者个人观点,不代表本平台的立场和观点。本文章仅供信息分享,不构成对任何人的任何投资建议。用户与作者之间的任何争议,与本平台无关。如网页中刊载的文章或图片涉及侵权,请提供相关的权利证明和身份证明发送邮件到support@aicoin.com,本平台相关工作人员将会进行核查。