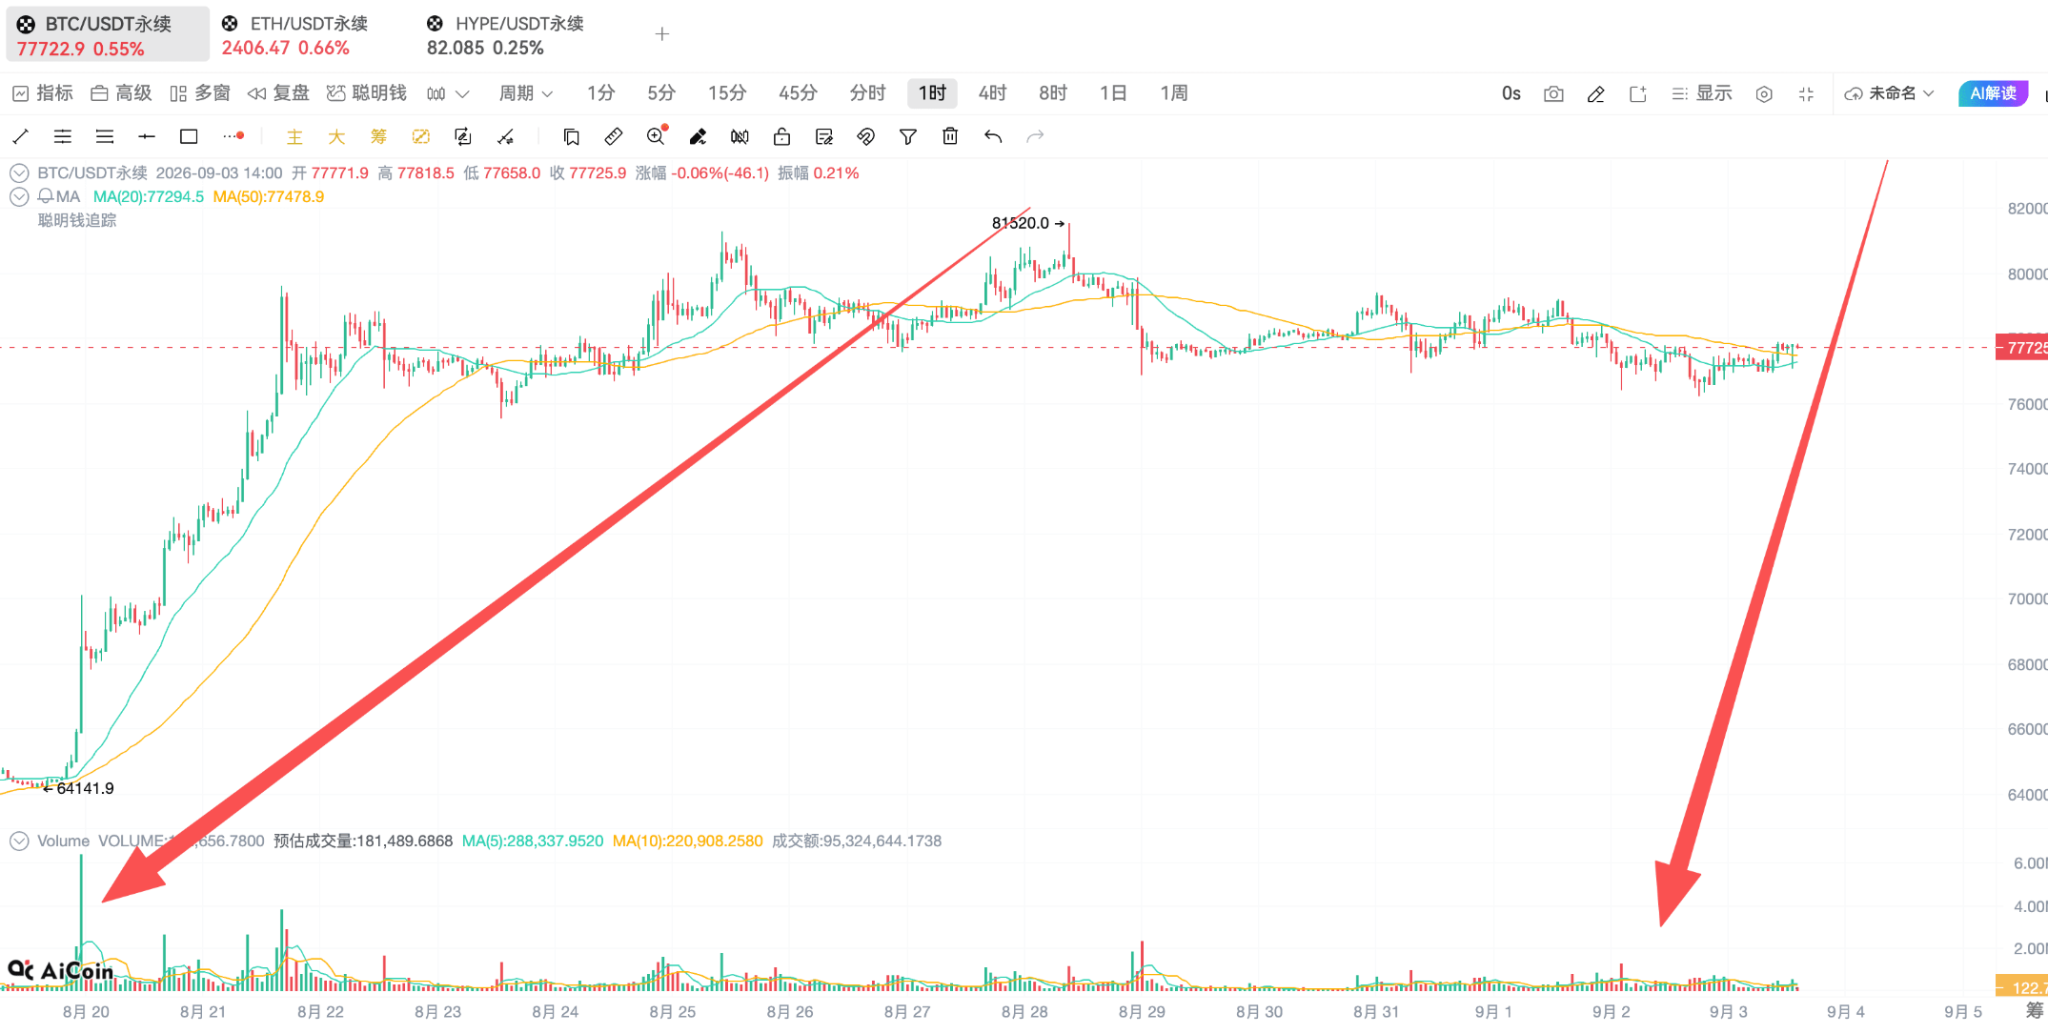
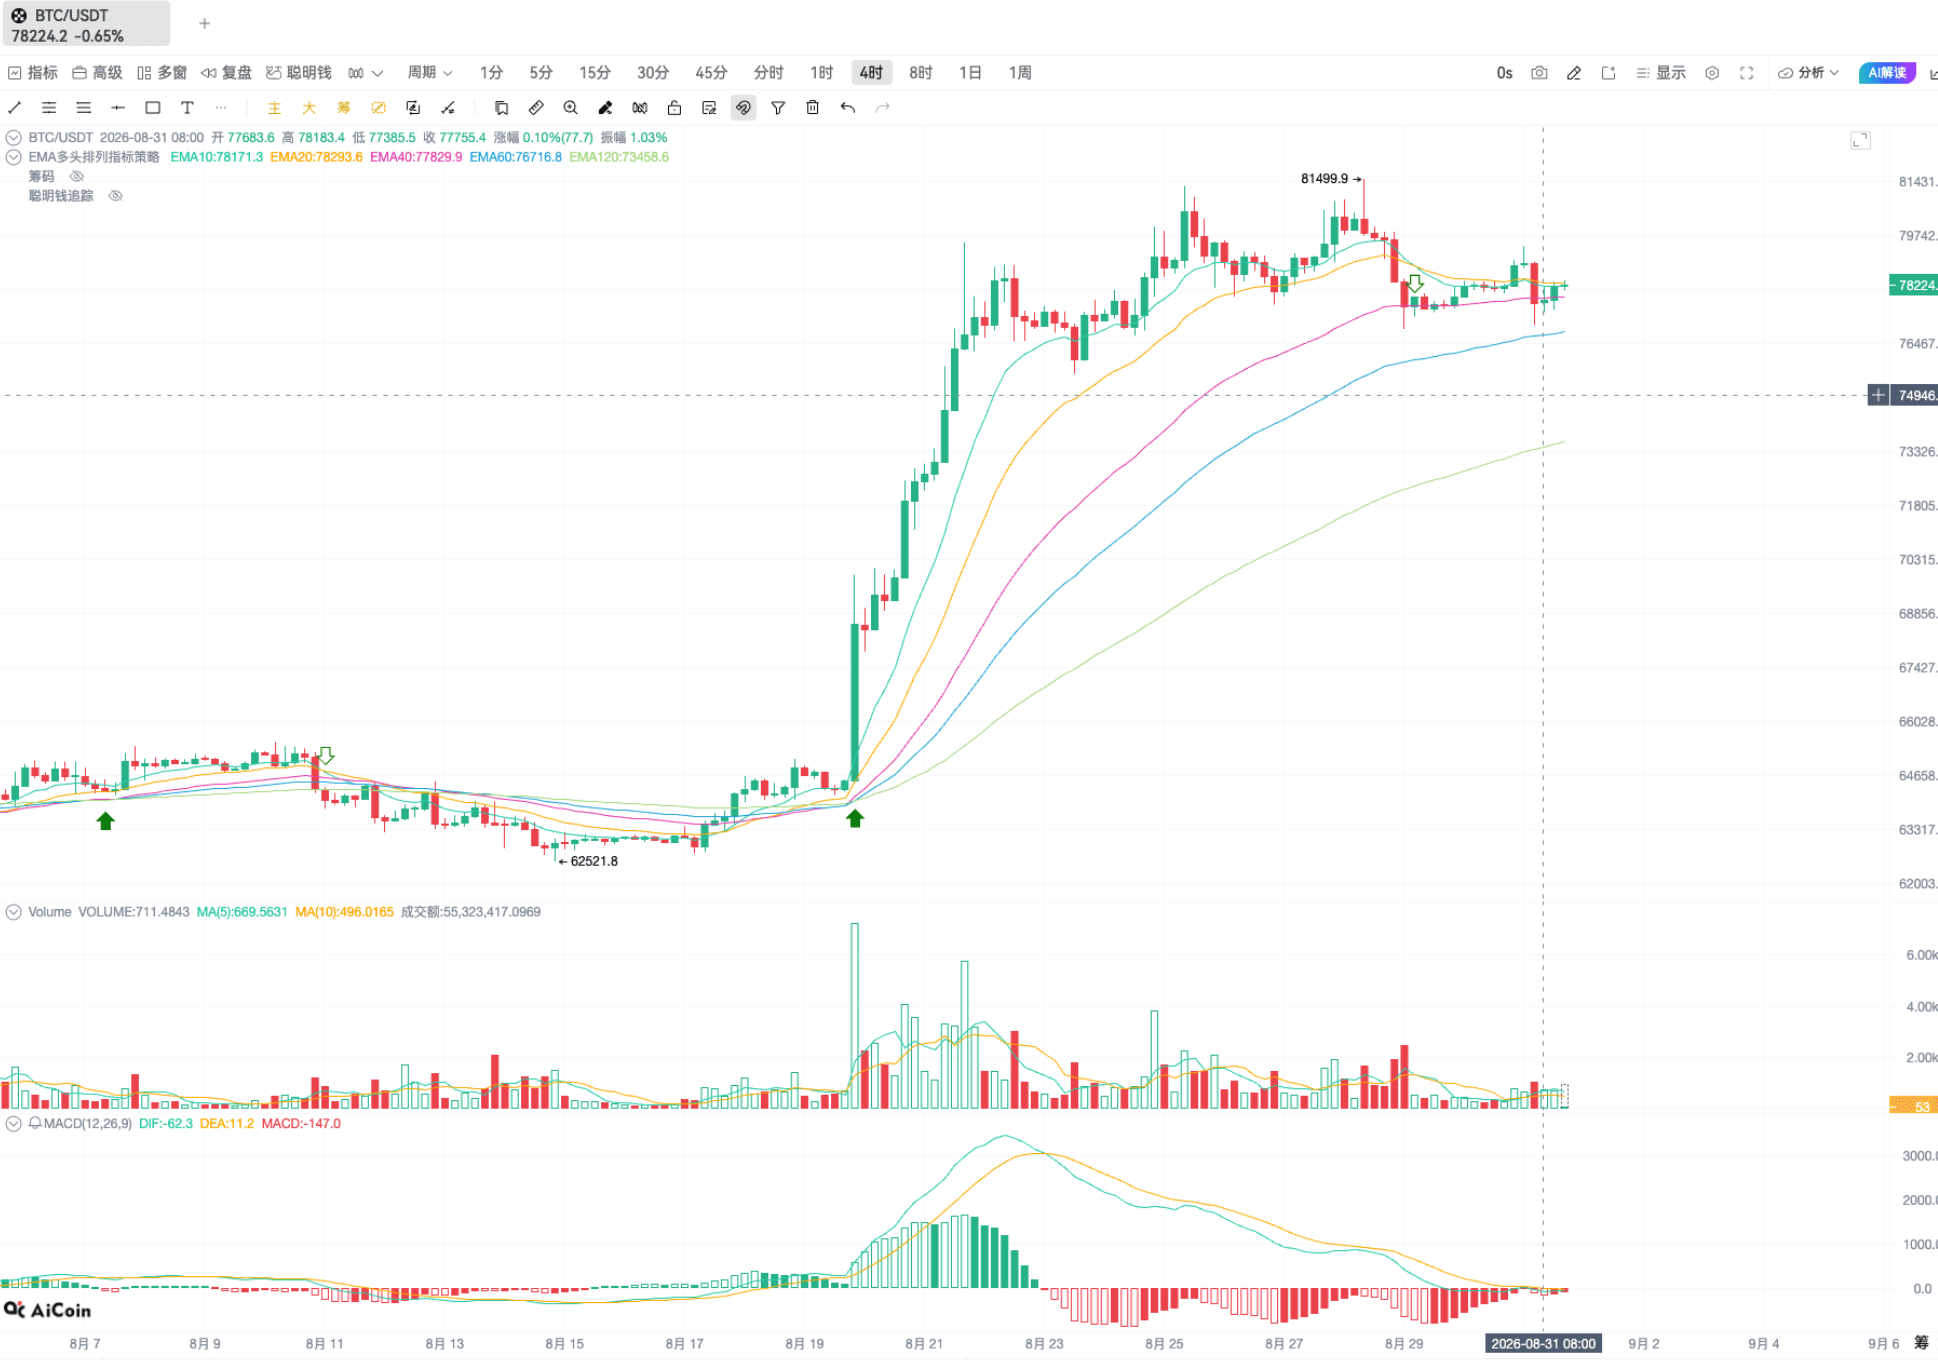
Here comes the brothers, today let's talk about some real cash-making insights. First, here's the big direction: view short-term movements as sideways, the long-term logic hasn't changed, BTC will eventually aim for ATH, just not right now.
Friends who followed the short position last week should have made a profit. This week, there's a critical observation to focus on: the previously mentioned "three lines coming together" seems to be losing its rhythm. Right now, we are in a phase of sideways movement, and when we surged to 81,000 last week, those who chased the rise mostly got wrecked, and now we're descending slowly, leaving the long positions with little strength.
Stop shouting about rushing to ATH; it's really not the time yet. I've told everyone before, you can build positions in the 40,000, 50,000, and 60,000 ranges gradually, slowly laying out your strategy, mainly focusing on spot trading without fear of being stuck.
Essentially, the "three lines coming together" represents the timeline of the traditional four-year bull-bear cycle. If this rhythm is disrupted, it means the long-held "four-year cycle theory" may truly need to be rewritten.
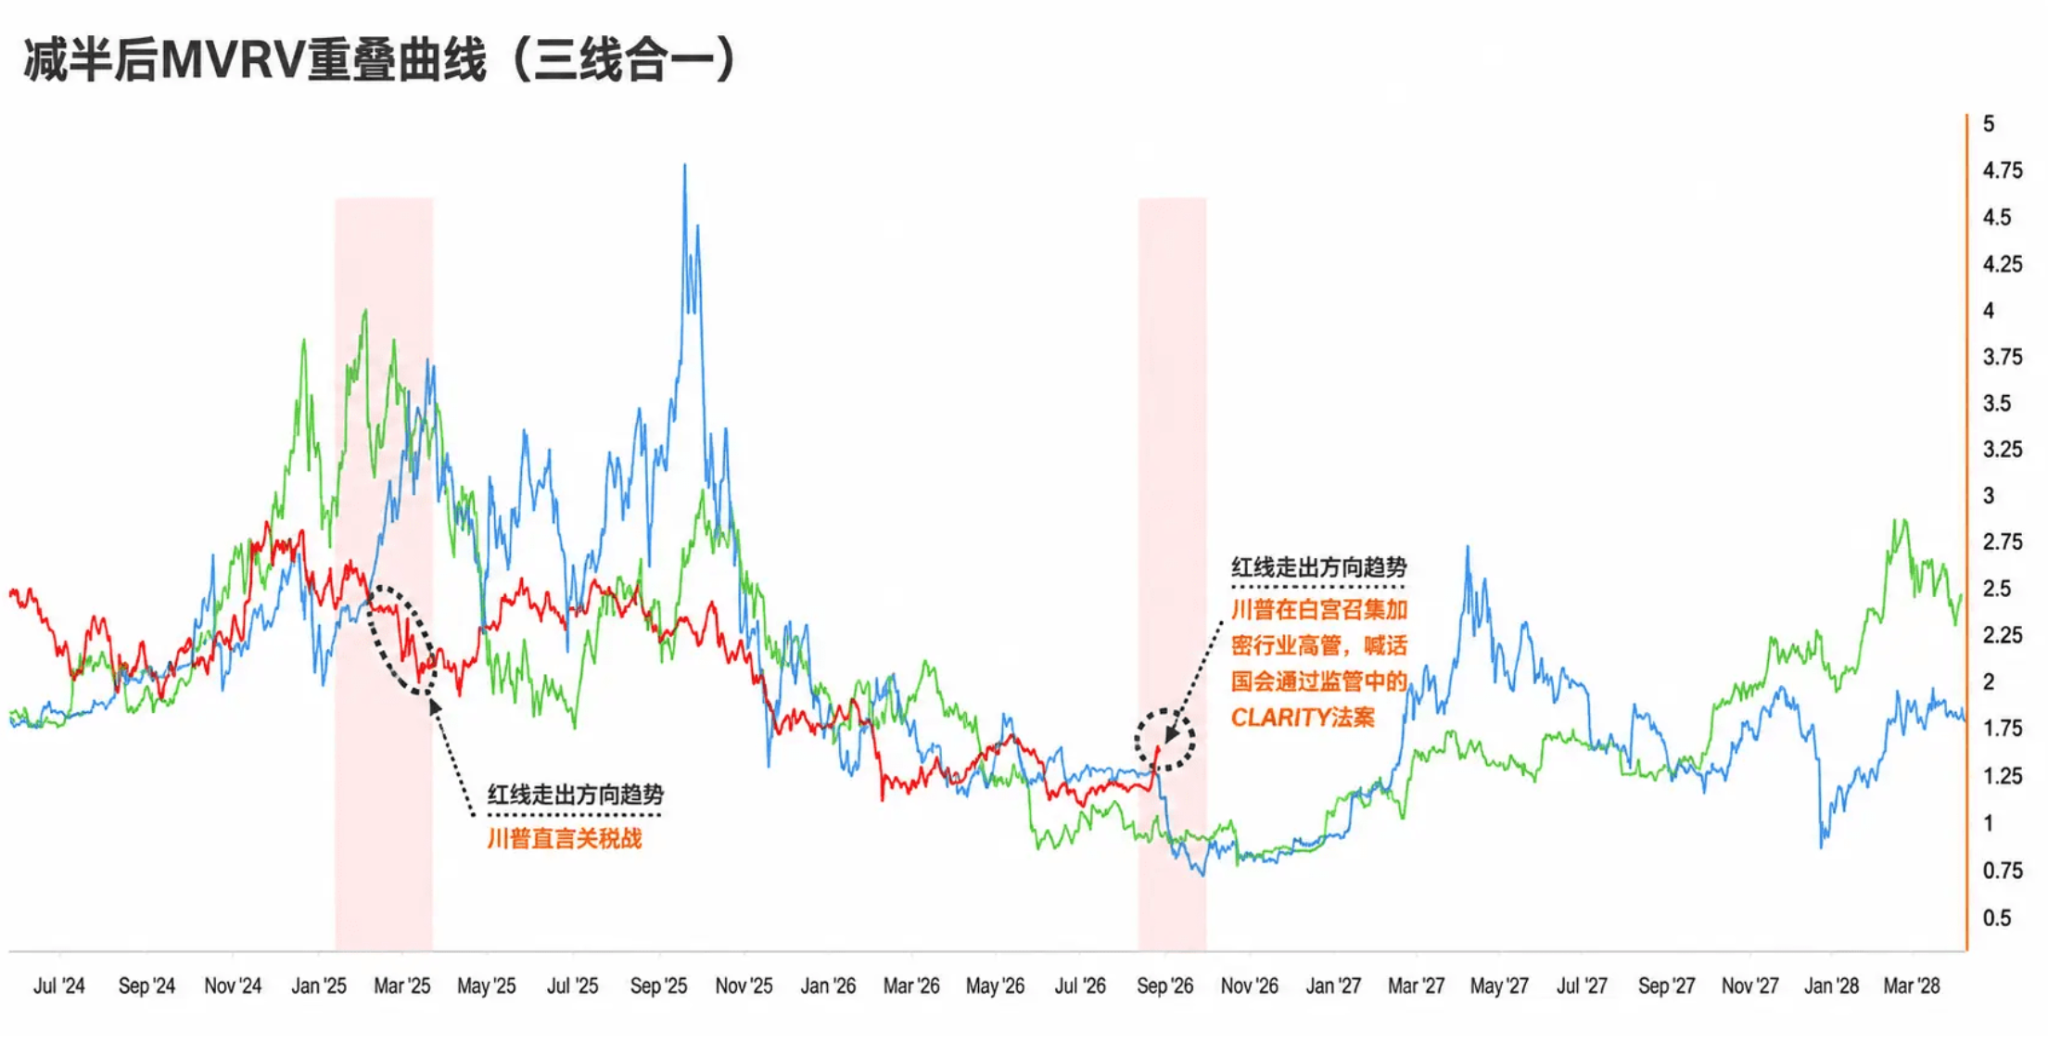
Currently, in the market, the red line is moving in a completely opposite trend to the blue and green lines. The last time we saw such divergence was in March-April 2025, when Trump restarted the tariff war, causing a collective retreat in risk assets, including US stocks.
Those investing regularly can rest assured; for contracts, I really don't recommend opening them casually. If you want to wait for a high cost-performance time for contracts, consider it after falling into the 40,000 range; at other times, just focus on spot trading.
This time, it was Trump who stirred up the rhythm. The White House gathered executives from the cryptocurrency industry for a meeting and openly urged Congress to advance the stalled CLARITY bill, clearly signaling to the market: I support crypto and want to embrace this industry. No matter how the market fluctuates afterwards, the probability of directly falling back to the cycle's bottom, following the blue and green lines, is significantly reduced.
By the way, regarding Ethereum, I see the trend shaping up like an M head, which might not fare well later.
Everyone can think about it, what is Trump aiming for by hosting a crypto summit at this time? One is fundraising, while also painting a K-line to pull votes; the other is paving the way for the implementation of RWA, allowing US stocks and crypto to completely integrate.
This is also why I have always mentioned the logic of Robin Hood's bear market cycle: every round of rebound peaks will not exceed the previous peak, which is the most intuitive manifestation of BTC's downward trend. Only when chips are fully rotated and the overall holding cost has significantly dropped can the price rise lightly. Let me show you some data: back in May when BTC was 82,000 dollars, PSIP was 65%; now at 80,000 dollars, the PSIP has instead risen to 70%. Compared to price fluctuations, this is the leading signal on a trend level.
The core reason behind this wave is US debt; gold, BTC, US stocks are essentially tools used by capital to resist currency devaluation. Don't chase up easily, just regular investing, friends.
This summit indirectly confirmed that the period between June and August is the bottom structure zone, also increasing the probability of "this is a reversal, not just a rebound." If the market indeed enters a bull-bear transition period, it is unlikely to return to levels below 50%—of course, excluding super black swan events like 312.
Everyone must remember, all data and indicators can only tell you roughly where the cycle is, but will not accurately tell you which day to buy and which day to sell.
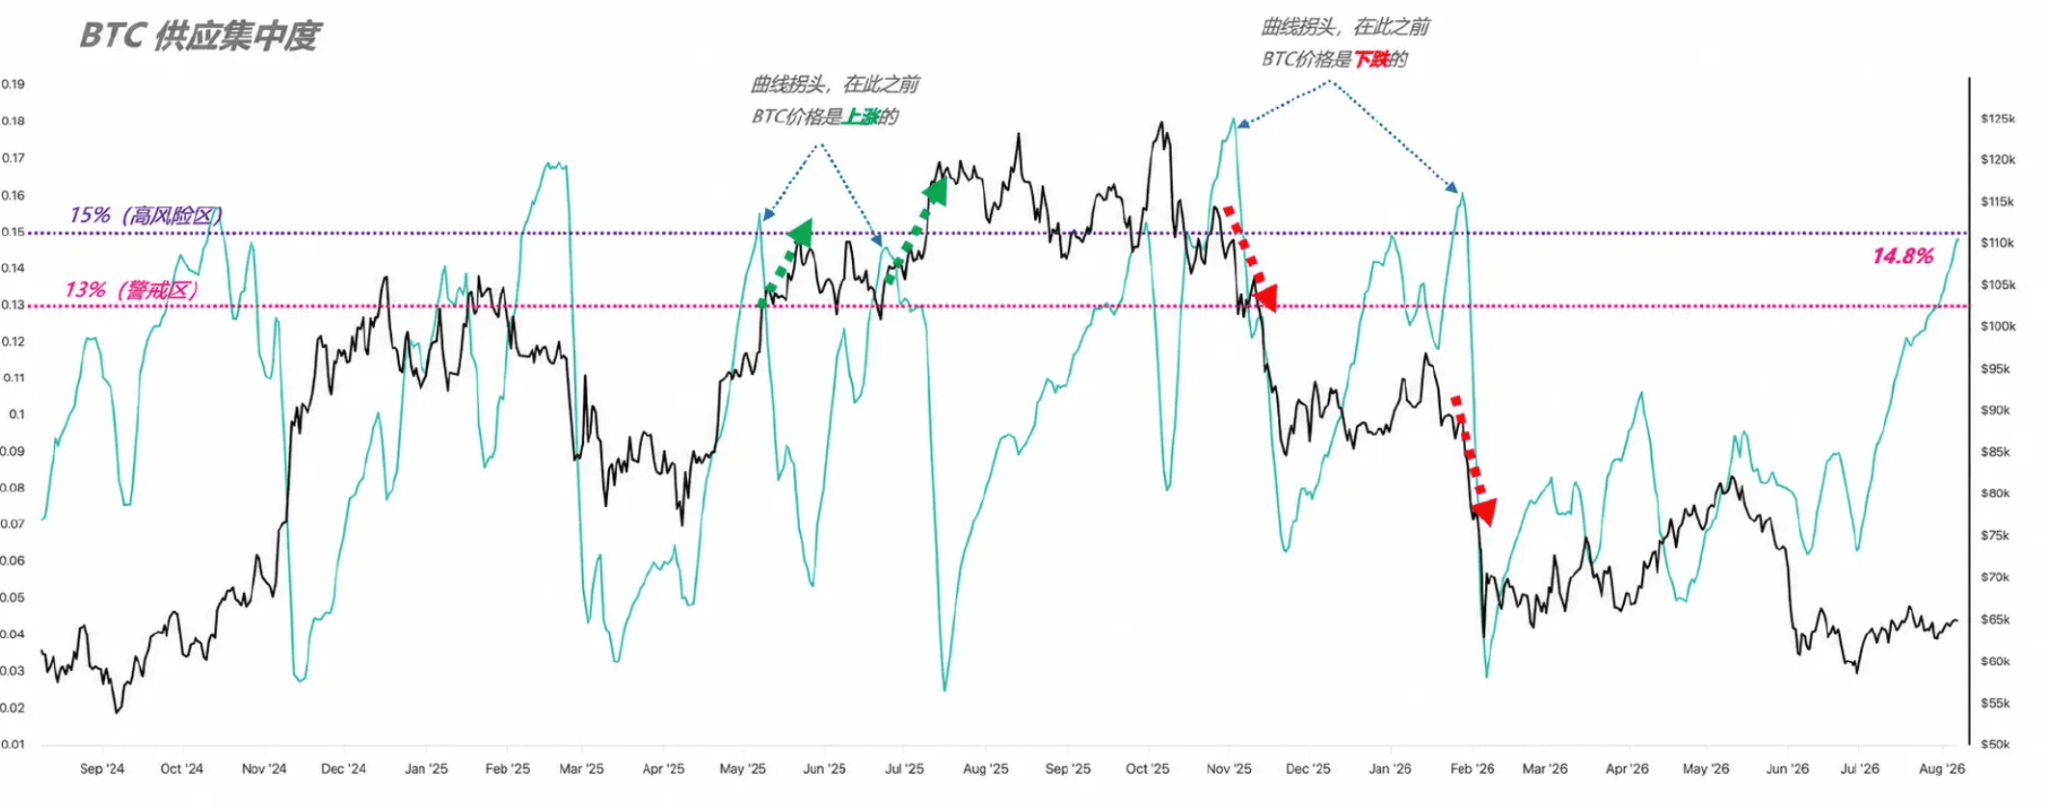
The transition from bear to bull will have a long "transition period," ranging from six months to over a year, with ups and downs testing human nature. Short-term trading is really tiring; I don't suggest everyone mess around with short-term trades daily, or you will end up working for the exchanges.
The market is like this now: when it falls, everyone starts shouting about 40,000 to 50,000; when it rises, everyone is yelling about a raging bull market. That's why you need to have your own judgment, see through the essence, and filter out the noise. Opportunities are always reserved for those who are prepared. For friends who missed the initial rise, make good use of the bull-bear transition period; there will be chances to enter before the real bull market starts.
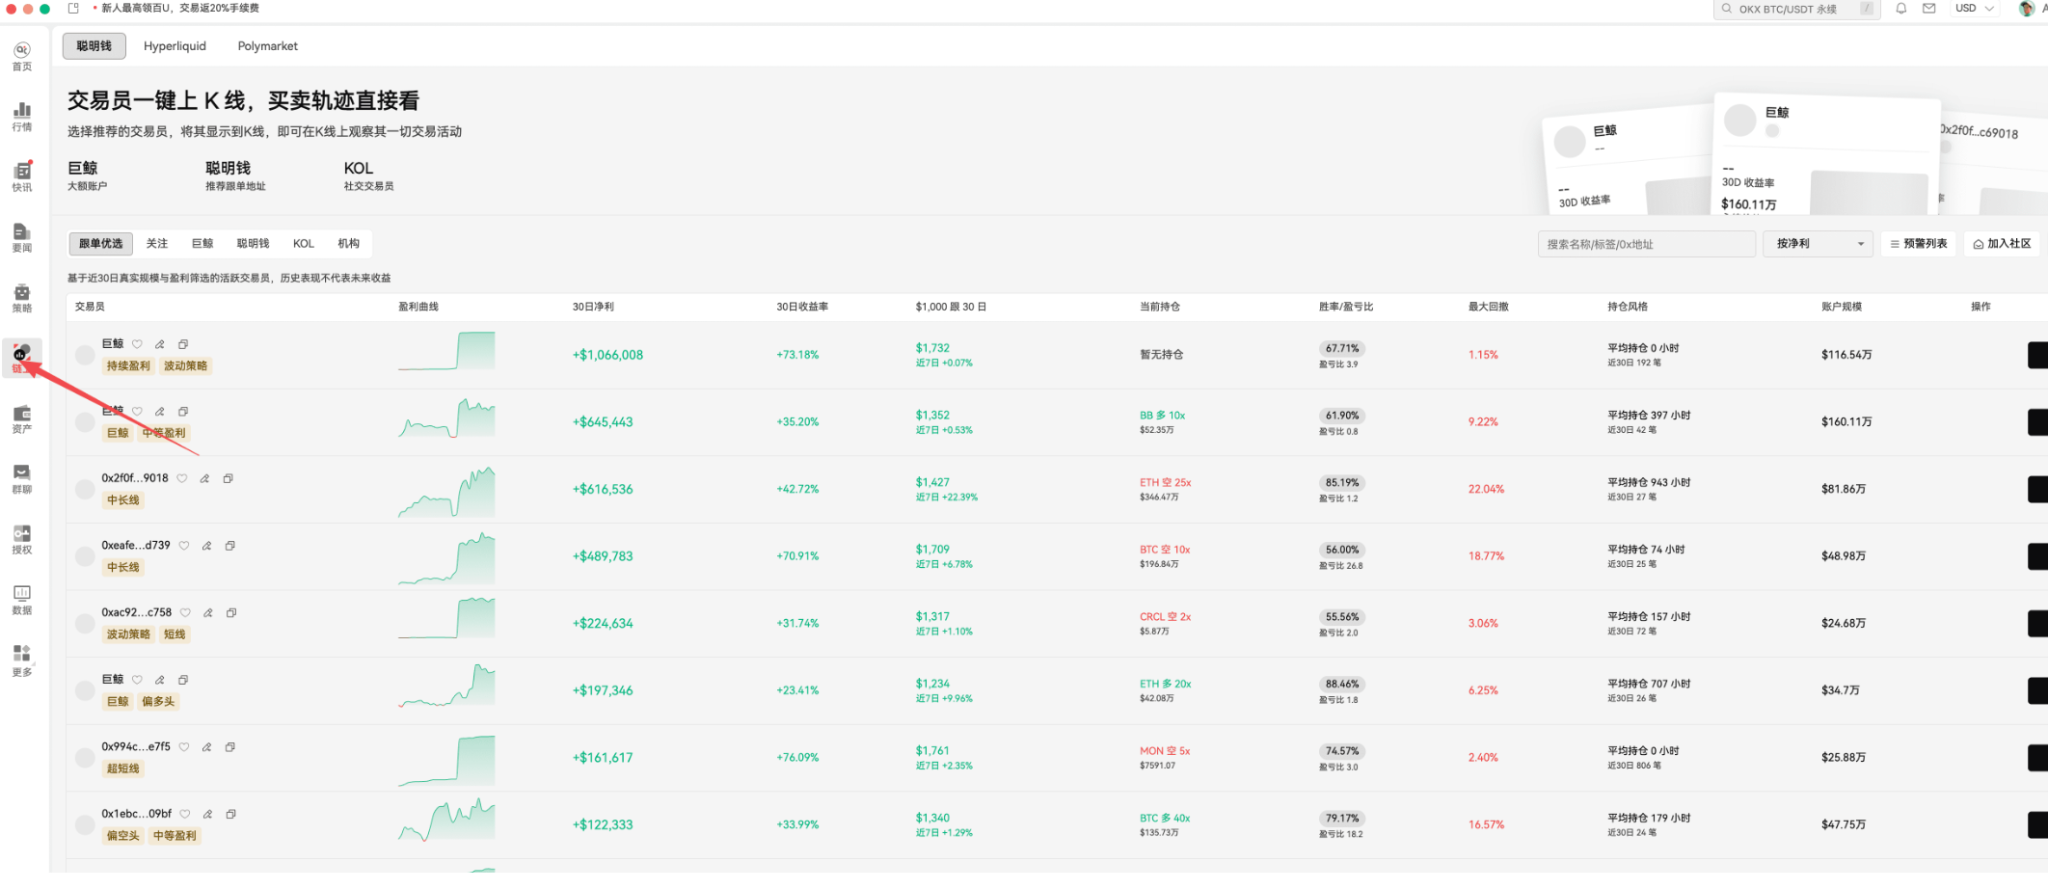
Last week I shared a website about Trump's positions; I want to mention it again this week. Many friends said they didn't know how to find the direction of big funds; here's a reference tool. https://quiverquant.com This is a data source organized by on-chain players; you can reference it, and we also have data on smart money on-chain; those interested in mid-term trends can take a look.
Taking Trump's trading history as an example: TEAM's holdings rose about 102%, ELF rose about 100%, and EAT also increased by 80% after buying; these are all substantial market behaviors driven by big funds.
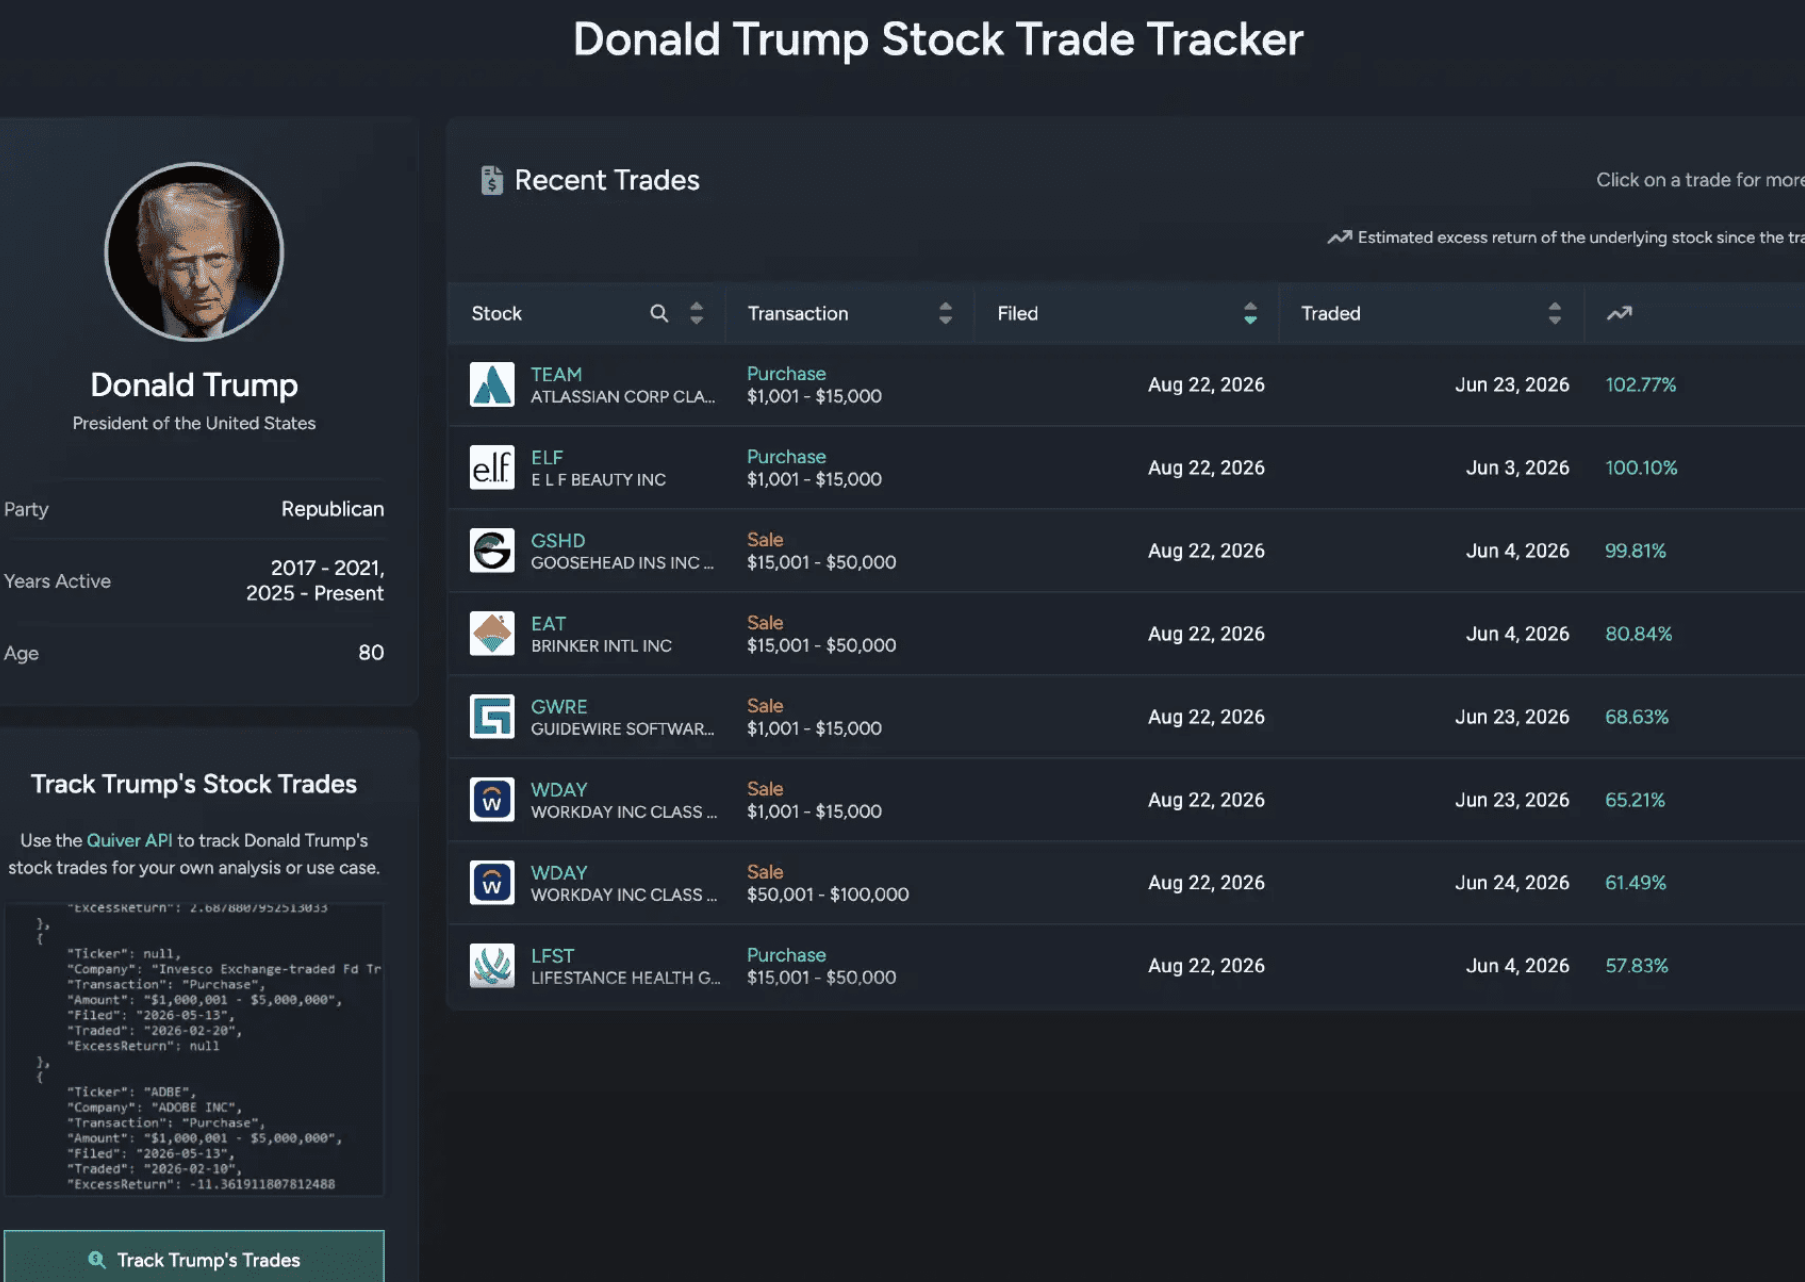
Sharing the thought process of using this tool: analyze industries where he has long-term heavy positions and buys and sells repeatedly, such as technology, military, energy, and healthcare, which are often highly tied to his policy direction. Align trading times with his public statements, executive orders, tariffs, and contracts; for instance, if a stock is bought before favorable policy and sold before the benefit materializes, or if his position shifts after he publicly names a company, you can understand where the information asymmetry lies. Of course, that doesn’t mean replicating every time. The key is to look at the green excess return rates on the page and see how much individual stocks outperform the market after his trades. If certain stocks repeatedly show excess returns after trading, they can be placed in an observation pool for mid to long-term references.
We operate major contracts by following the information aspect, the general direction won't be wrong.
Now, let’s talk about the precious metals market. Last week we were still discussing institutional entrance and KOL recommendations, and suddenly gold broke below 4,500, now it's around 4,400. Powell's remarks were very firm, but at the end of the day, Trump doesn't want to raise interest rates; he would much prefer to lower them. After all, midterm elections are coming up in November, and the US interest rate hikes focus on inflation and employment, with inflation being the core, and employment data can be adjusted. I recall last month there was a meme coin he dumped a lot of goods into, and KOLs chased him and cursed; those who understand, understand.
Returning to the market itself, gold and BTC are now two conflicting forces pulling back and forth. The overall trend of gold remains in a downward channel, with Powell steadfast on the 2% PCE inflation target, and there is a 60% market prediction for a rate hike at the September Federal Reserve meeting. After the September FOMC, inflation and employment data will be key catalysts. If inflation remains stubborn and the Federal Reserve continues with hawkish policies, gold prices may continue to face pressure and fluctuate; if data deteriorates and expectations for easing policies rise, only then will it turn upward again.
Excess investment returns never come from chasing up or down: others look at surface prices, while if you can identify hidden variables in advance, you can redefine the asset's value.
In the crypto circle, to find opportunities, you have to grasp the main line. Right now, the sustainability of the widespread rise will not be very strong because it is fueled by expectations of liquidity, without real incremental funds flowing in, mostly driven by emotional explosive speculative behavior.
The Robin Hood ecosystem has recently started to heat up, KOLs are all shouting, saying it's the highest momentum they've seen in three years. Robinhood's RWA and Meme are likely about to see a wave of market activity. RWA tokenization could very well be the innovative main theme of this cycle. I predict that the upcoming main battlefield on-chain will be Robinhood Chain and BSC: one playing the RWA card, the other playing the token card.
In the past 48 hours, the heat around the Robinhood chain has clearly increased, with the number of addresses holding tokenized stocks reaching 203,000, skyrocketing 46% in three days, indicating a user explosion point for tokenized stocks. Some say that Robinhood has integrated the stock pool and Meme gameplay, filling the past shortcomings of Meme being "without real value," allowing the true value of RWA to flow into Meme, directly calling it "Meme 2.0." Tokenized stocks provide exposure to real assets, while Meme provides spread and speculative sentiment; both layered on the same chain can easily generate heat.
Robinhood is still in its early stages now; if it is indeed the beginning of a bull market, holding some platform tokens is fine. What’s truly worth watching is the concurrent occurrence of two things: RWA bringing real stock exposure on-chain, and Meme introducing liquidity and sentiment.
Currently, there are live broadcasts every day; welcome to continuously follow our AiCoin buddies! Reserve in advance👇
https://www.aicoin.com/zh-Hans/live/list?tab=upcoming
Join our community, let's discuss and become stronger together!
Official Telegram community:
AiCoin Chinese Twitter:
Aster rebate:
https://www.asterdex.com/zh-CN/referral/9C50e2
Hype rebate:
https://app.hyperliquid.xyz/join/AICOIN88
Binance rebate:
https://jump.do/zh-Hans/xlink-proxy?id=3 invitation code: aicoin668
Coinbase rebate:
https://jump.do/xlink?checkProxy=true&proxyId=25 invitation code: Y8L23JL
免责声明:本文章仅代表作者个人观点,不代表本平台的立场和观点。本文章仅供信息分享,不构成对任何人的任何投资建议。用户与作者之间的任何争议,与本平台无关。如网页中刊载的文章或图片涉及侵权,请提供相关的权利证明和身份证明发送邮件到support@aicoin.com,本平台相关工作人员将会进行核查。