Cryptocurrency Academy: The 9.4 Bitcoin (BTC) range breakout is not a certainty. What is the true color of this market cycle? Latest market analysis and operational advice explained
Bitcoin's current price is 80850, once again displaying a strong bullish candlestick. Is this rebound the start of a new upward trend or a high-level trap to bait buyers? During the day on the 3rd, I mentioned the arc bottom and head-and-shoulders bottom rebound pattern in my intraday short positions, which has now completed. Those who like to trade intraday should take profits. The previous few days have seen back-and-forth volatility, with many short positions hit stop-loss orders; aside from us, not many have maintained their positions and most are bearish. Market sentiment is always polarized; understanding support and resistance, and waiting for the right moment to act is far more important than blindly following the trend.
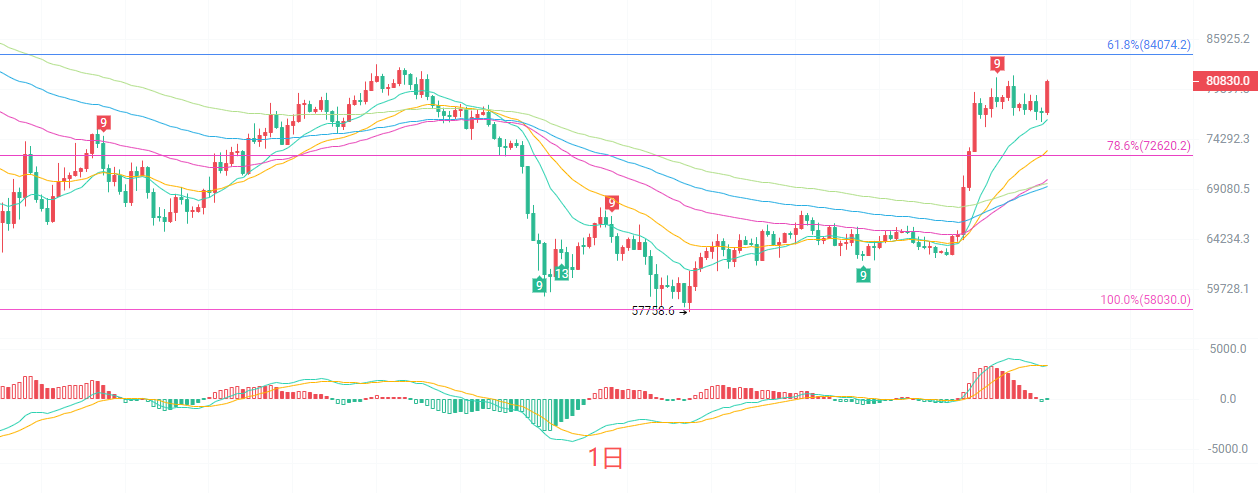
The daily K-line has re-established itself above multiple EMA moving averages, with short-term moving averages turning upwards, forming a support structure. According to the Fibonacci indicator, the primary resistance above is 84074, with the historical high of 87000 serving as strong resistance; the key support below is 72620, which is the 78.6% retracement point of this rebound and the core defense line for bulls. The daily MACD indicator's DIF and DEA maintain a position above the zero axis, with the red histogram slightly contracting before expanding again, and bullish momentum is being released once more. The Bollinger Bands are opening up again, with the price operating near the upper Bollinger Band. The overall trend on the daily chart is bullish, but since we are approaching a historical resistance area, a direct breakout is difficult, and it is likely that it will test support after a high, so chasing upwards at these levels is not advisable.
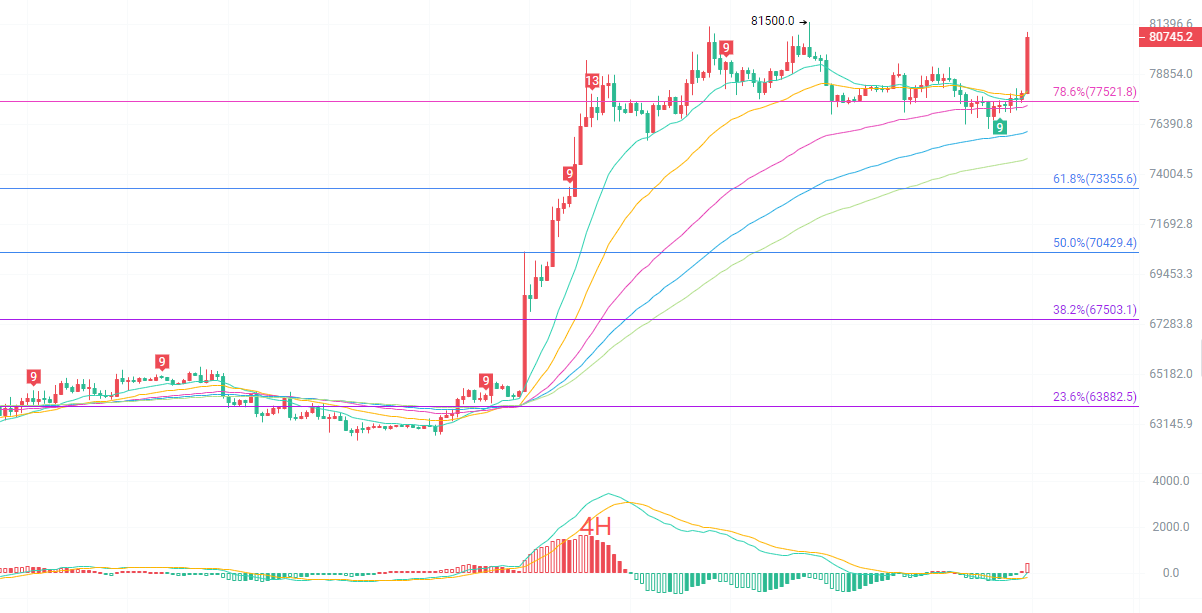
The four-hour K-line has stabilized at the Fibonacci 78.6% resistance level of 77521, which has shifted from resistance to significant support. All cycle EMA moving averages are diverging upwards, indicating a bullish arrangement, providing continuous support for the price. The 4-hour MACD golden cross has restarted, with the green histogram disappearing and turning into a red histogram that is expanding, indicating a return of short-term bullish strength. The Bollinger Bands are opening upwards, and the K-line has touched the upper Bollinger Band, suggesting a need for a short-term overbought correction. The previous high of 81500 is right ahead, which will create direct pressure. Although bulls dominate in the four-hour timeframe, after a rapid surge, a pullback for consolidation could occur at any time, so it's advised not to aggressively chase long positions at the upper Bollinger Band; wait for a pullback to support before participating, as it will have a higher margin for error.
Short-term reference:
Go long between 77400 and 77800, with a stop loss of 500 points and a target of 81400 to 83800.
Go short between 83800 and 84100, with a stop loss of 500 points and a target of 81200 to 78600.
Specific operations should be based on real-time market data. For more detailed information, you can consult the author. The article may have delays in publication; it is advised for reference only and the risk is self-borne.

Warm reminder: The above content is solely created by the author of the public account. The advertisements at the end of the article and in the comments section are unrelated to the author. Please discern carefully, and thank you for reading.
免责声明:本文章仅代表作者个人观点,不代表本平台的立场和观点。本文章仅供信息分享,不构成对任何人的任何投资建议。用户与作者之间的任何争议,与本平台无关。如网页中刊载的文章或图片涉及侵权,请提供相关的权利证明和身份证明发送邮件到support@aicoin.com,本平台相关工作人员将会进行核查。