Crypto Circle Scholar: The 9.5 Bitcoin (BTC) bull market is not just mindlessly bullish; what are the survival rules during the high volatility phase? Latest market analysis and trading advice breakdown
The current price of Bitcoin is 79500, and a new round of adjustment is coming. The previous wave of strong rally directly heated up market sentiment, many people chased at high levels, causing anxiety with the back-and-forth fluctuations. When the price goes up, they fear missing out, and when it drops, they fear being trapped; this is the norm for most traders. Now the price is stuck around 79500, having just touched the resistance point at 82282 before retreating, and the bull-bear game has reached a critical watershed. Do not be blinded by short-term big bullish candles, nor should you turn bearish just because of a few bearish candles
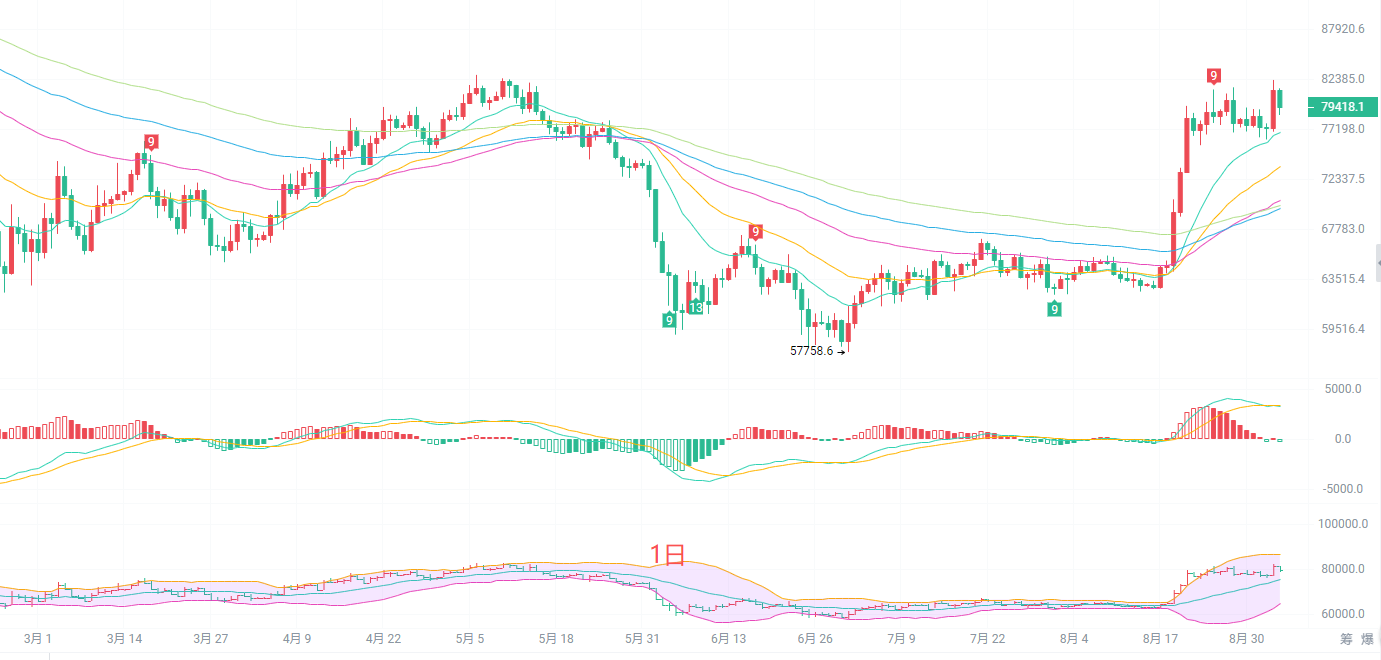
The daily K-line moving average system is fully in bullish alignment, with short-term EMA15 and EMA30 firmly supporting the price, while medium-term moving averages are still trending upwards, and the overall bullish structure remains intact. The MACD indicator shows that the red bars are starting to shrink, and there are signs that the DIF is turning down and getting close to the DEA, suggesting a decrease in upward momentum. Currently, the price is operating between the upper and middle bands of the Bollinger Bands, with upper resistance at 86485 and middle support at 75586. As long as the middle band is not effectively broken downward, the larger trend remains slightly bullish, but after continuous upward moves, the demand for a correction is accumulating. If the key support at 75586 is lost, it will open up deeper retracement space, and the upper 82282 becomes a critical resistance point in the short term
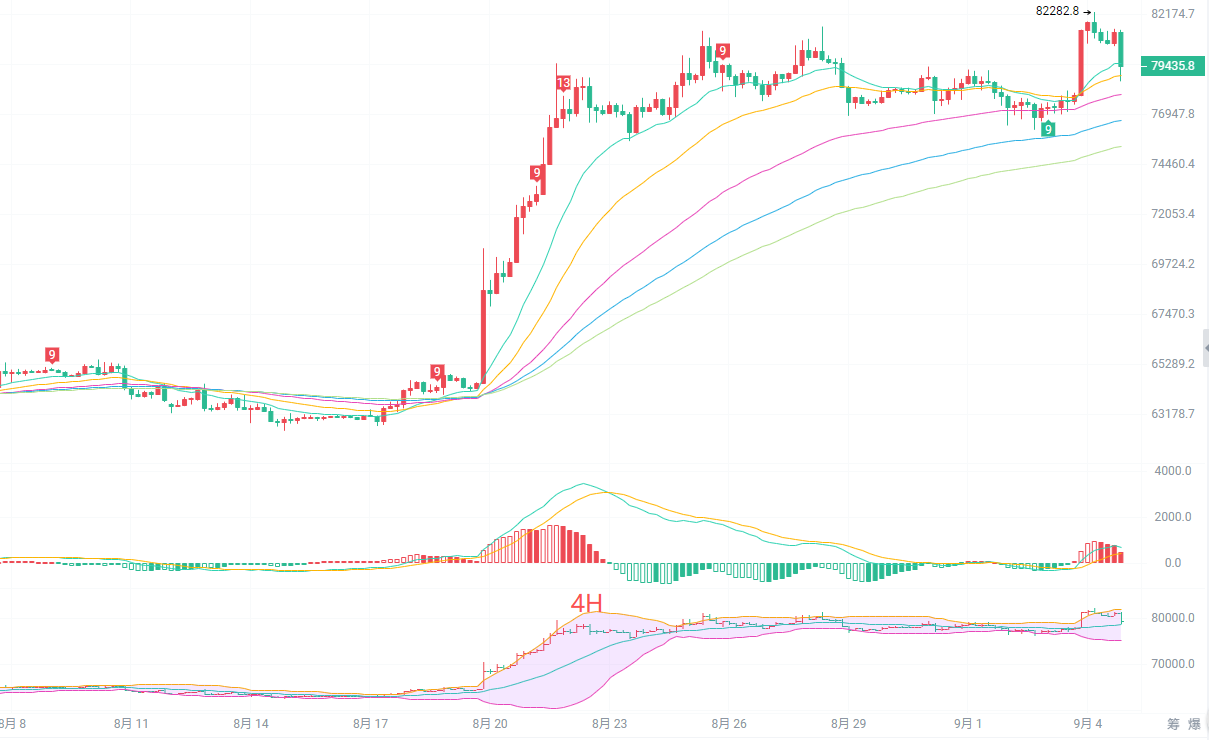
The four-hour K-line is oscillating near multiple EMA moving averages. The short-term EMA15 and EMA30 are entangled, with both bullish and bearish forces tugging at each other, while the long-term EMA60 and EMA90 are still trending upwards, maintaining a mid-term upward trend. The 4-hour MACD DIF has retreated from a high position, with alternating red and green bars, and the energy is being tugged repeatedly, without forming a unilateral trend. The Bollinger Bands are slightly constricting, with upper band pressure at 82083 and lower band at 75297, which is an important defensive support. After the price pulls back, there has been no rapid breaking down, indicating that the lower levels are still being accepted, but multiple failed attempts to break higher have weakened the bullish momentum. The 4-hour chart is currently in a high-level oscillating consolidation phase, likely moving within a range to wash out positions, waiting for the indicators to stabilize before choosing a new directional breakout
Short-term reference:
Buy around 77400 to 77800, stop loss at 500 points, target at 81400 to 83800
Sell around 81600 to 82000, stop loss at 500 points, target at 80500 to 79500
Specific operations should be based on real-time data from the market; for more detailed information, you can inquire with the author. There may be delays in the article publication, and this is suggested for reference only; risk is on your own shoulders

Kind reminder: The above content is only created by the author on the public account. The advertisements at the end of the article and in the comments section are not related to the author; please carefully discern, thank you for reading
免责声明:本文章仅代表作者个人观点,不代表本平台的立场和观点。本文章仅供信息分享,不构成对任何人的任何投资建议。用户与作者之间的任何争议,与本平台无关。如网页中刊载的文章或图片涉及侵权,请提供相关的权利证明和身份证明发送邮件到support@aicoin.com,本平台相关工作人员将会进行核查。