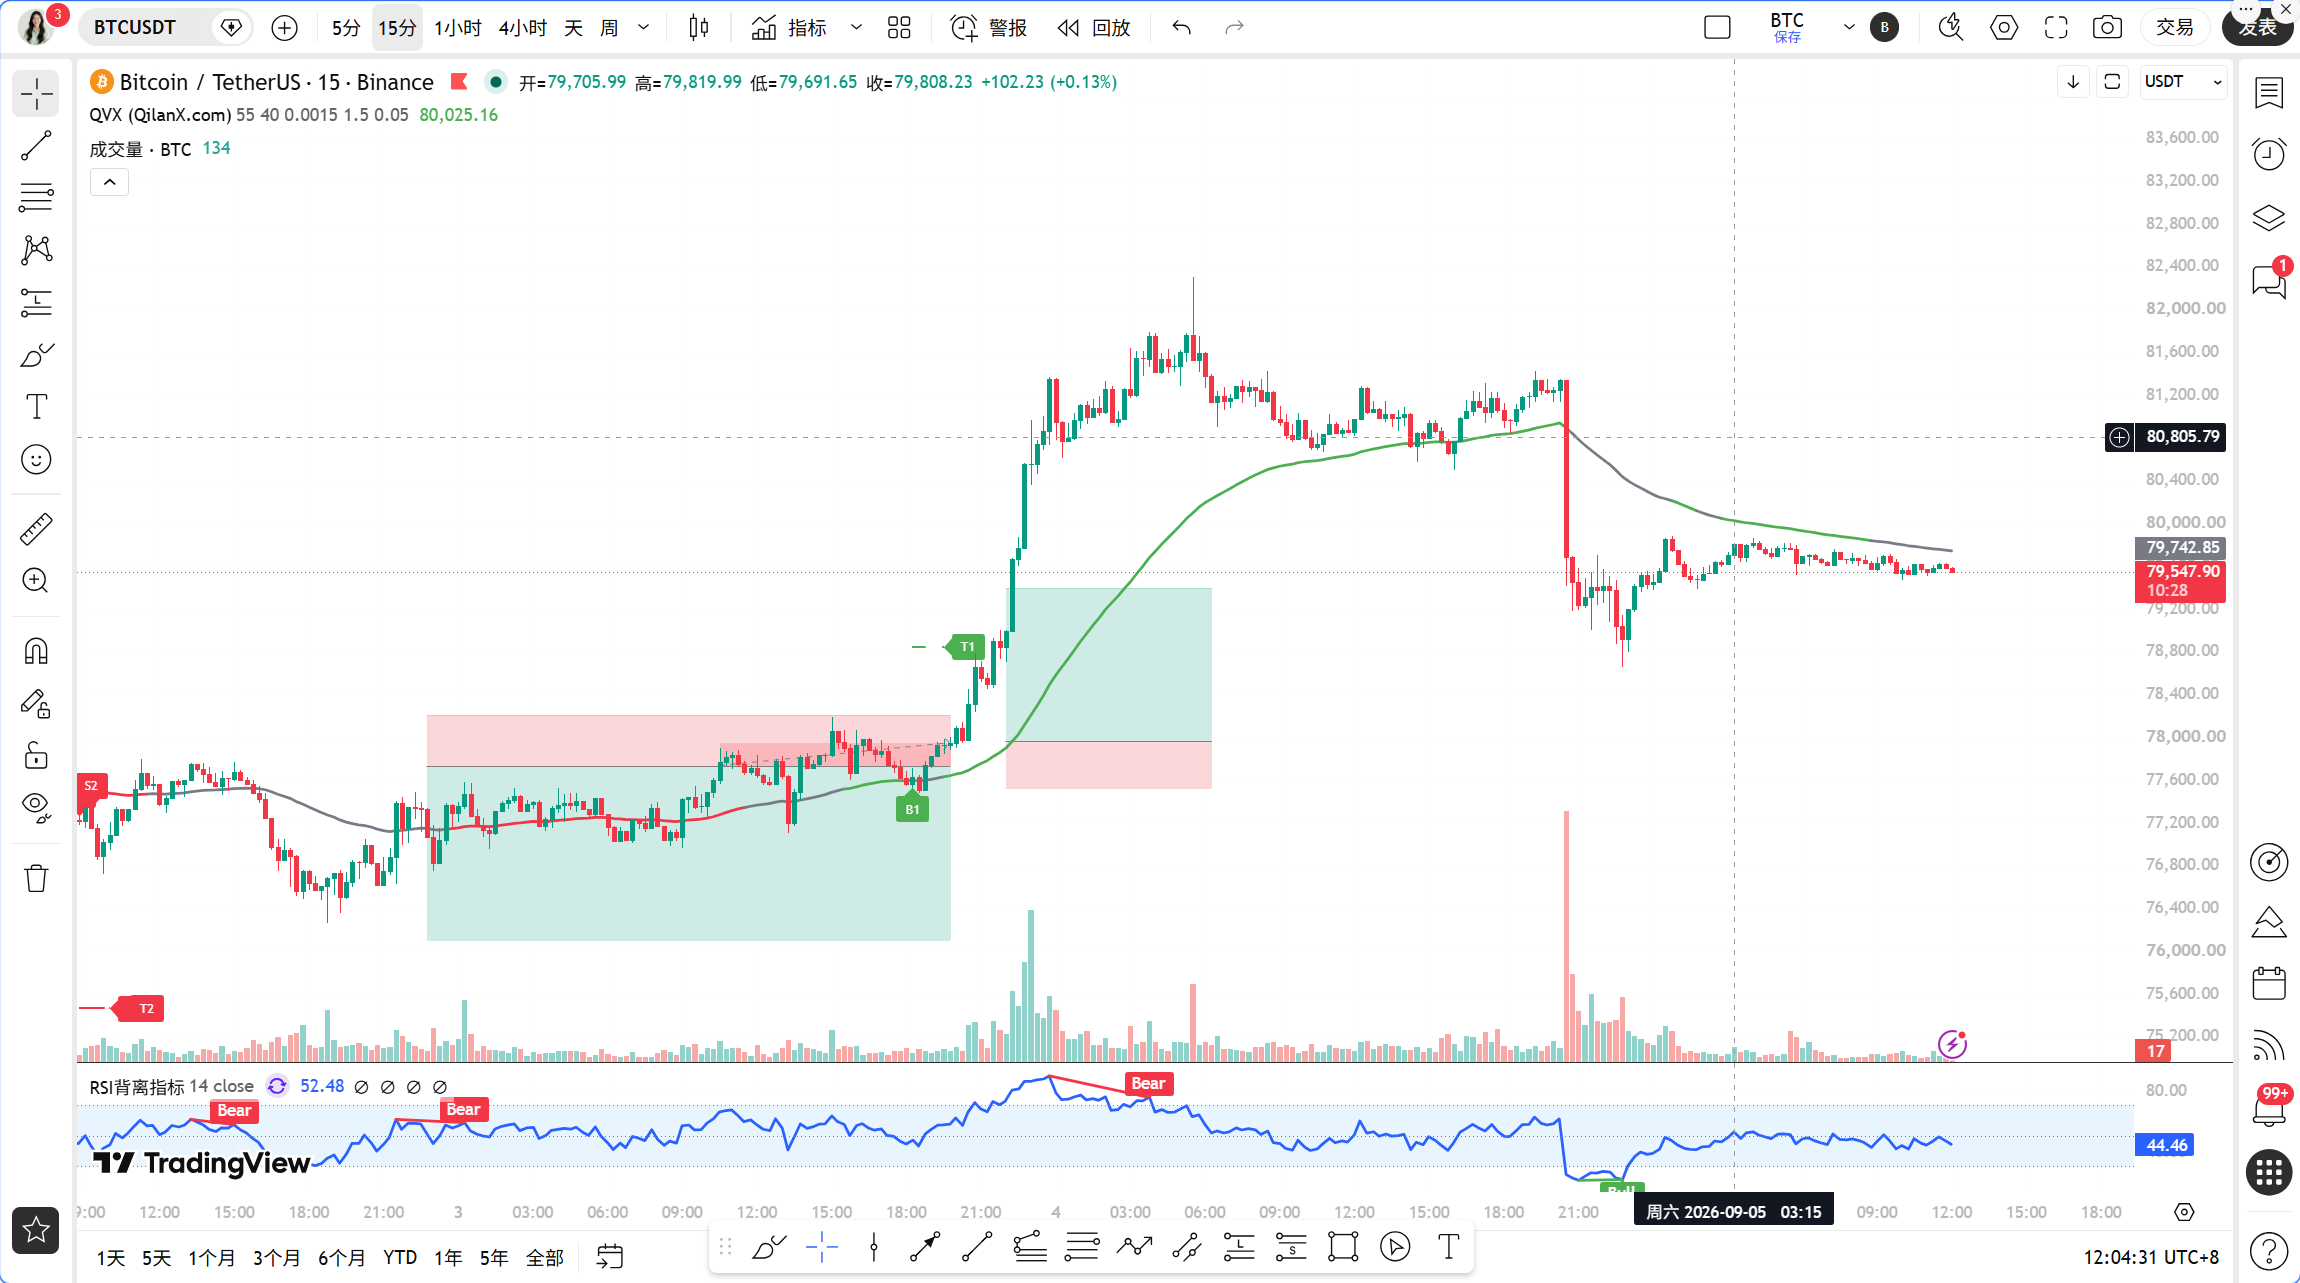
Last night, the opening of the U.S. stock market saw Bitcoin directly lose the $79,000 level, which made many friends who had chased the rise feel uneasy. Following that, Citibank released a significant forecast, pushing the expectation for the Federal Reserve to cut interest rates to mid-2027, essentially informing the market that the tightening cycle will last a long time. On the other hand, Strive's fund bought more than 1,000 Bitcoins this week, and OpenReserve also received preliminary approval for a banking license in the U.S. One side faces the hammer of macro liquidity tightening, while the other side sees institutions continuously increasing their holdings, reflecting the true state of the current market’s fragmentation.
The current time is September 5th, 12:05 PM, with Bitcoin priced at 79,583 USDT, a 24-hour decline of 1.56%. The Fear and Greed Index is at 73, still in the greedy range, indicating that market sentiment has not completely turned cold, but short-term price behavior has already given a clear warning signal.
First, let's look at the daily level. The MA5 is at 79,058, and the MA10 is at 78,788. The price barely stands above the short-term moving averages, but the MACD histogram has been continuously negative, and the divergence pattern formed after the cross of DIF and DEA at a high level has not been repaired. The RSI reads 58.26; although not overbought, momentum has visibly weakened. The issue with the daily level is that after a prior large increase, the price needs time to digest, and the current position seems more like a continuation of the rise or a head structure, requiring smaller levels to confirm.
Switching to the 4-hour chart, the situation is clearer. The MA5 is at 79,609, and the MA10 is at 80,380. The price has fallen below the MA10, and the MACD shows a death cross above the zero line, with a histogram of -28.57, indicating that the 4-hour level adjustment is in progress. However, note that the MA30 is at 78,825, which is some distance from the current price. If the adjustment deepens, the 78,000 to 78,500 range will be the first truly meaningful support area.
The 1-hour level is currently the most critical battlefield. The EMA55 is at 79,508, with the current price at 79,583, just touching this line of demarcation. The MA5 and MA10 are tangled around 79,568 and 79,625. The MACD's DIF is at -142, DEA at -108, and the histogram at -34.62 is expanding, indicating that the bearish momentum at the 1-hour level has not exhausted. The RSI reads 68.46, a high value for the 1-hour level, suggesting a short-term need for a rebound, but the strength is questionable.
The 15-minute level shows some weak signs of stabilization. The MACD histogram has turned positive to 3.41, with the DIF and DEA sticking together below the zero line, and the RSI returning to 46.87, indicating that the short-term selling pressure has eased somewhat. However, the MA30 is at 79,640, and the price has not returned to it, so the rebound at the 15-minute level can only be defined as weak repair.
Now, using the Qinglan TPV system for signal verification. The core rule is that the 1-hour EMA55 serves as the demarcation line. The current EMA55 is at 79,508, with the current price at 79,583, above this line. But note that the past 8 1-hour candlestick close prices over EMA55 are 8 versus 8, with zero crossings, indicating a seemingly unilateral bullish structure. The problem is that the current price is only 0.09% away from EMA55, and this level of proximity has triggered the system's volatility warning. In other words, although the structure is slightly bullish, the price is rubbing against the boundary line, which could change direction at any moment.
Next, let's look at the conditions for going long. The first condition is for the price to stabilize above EMA55, with two consecutive hourly close prices greater than EMA55; this condition is currently barely met. The second condition for support stabilization requires a long lower shadow, a bottom formation, or a volume spike, but last night's sharp drop below $79,000 did not leave a significant long lower shadow at the hourly level; the candlestick pattern leans more towards weak consolidation after a bearish body. The third condition is for bearish momentum to exhaust, with the MACD histogram expanding in the negative range at the 1-hour level, and although the RSI is recovering from a low, the strength is insufficient. Out of the three conditions, only the first is barely qualified, and the long signal is not established.
As for the conditions for going short, the first condition is for the price to be under pressure below EMA55, with two consecutive hourly close prices less than EMA55. The current price is above EMA55, so this does not meet the requirement. Thus, the current conclusion given by the TPV system is that both long and short signals are incomplete, sitting at a critical state. In this scenario, the worst thing is to make heavy bets based on feeling; it’s best to wait for the price to make a clear directional choice against EMA55.
Regarding on-chain data, the Fear and Greed Index is 73, indicating that greedy sentiment is still high. Historically, this position tends to see sharp drops for shakeouts. The Bitcoin market share is at 59.13%, suggesting that capital is still rotating within BTC, without large-scale inflows into altcoins. BitMine has transferred 25,000 ETH to a new wallet, worth $61.51 million; such movements by large holders need attention, although it does not directly affect BTC, it may imply some funds are adjusting positions.
Key attack and defense levels must be clarified. The first resistance above is between 79,650 and 79,800, which is a dense zone of the 15-minute MA30 and the 1-hour MA10; breaking and stabilizing above this will lead to the 80,300 to 80,500 region of the 4-hour MA10. The first support below is at 79,500, which is the position of the 1-hour EMA55. If this level is lost, the next defense line will see the 78,800 to 78,500 region of the 4-hour MA30. If 78,500 cannot be held either, the adjustment at the daily level will be officially opened, looking down to 77,000 to 76,000.
In terms of trading strategy, Qinglan recommends two plans. The first plan is a breakout to chase long setup; it requires waiting for two consecutive hourly close prices to rise above 79,800, accompanied by a significant shortening of the MACD histogram below the zero line. You can enter long positions within the range of 79,850 to 79,950 with a small amount, setting a stop loss at 79,300, with the first target at 80,500 and the second at 81,200. The second plan is a short setup upon breaking down; if two consecutive hourly close prices fall below 79,350, which is more than 50 points below EMA55, you can short within the range of 79,300 to 79,200, setting a stop loss at 79,850, with the first target at 78,500 and the second at 77,800. If the price oscillates between 79,500 and 79,800 without choosing a direction, then hold cash and wait; do not engage in this war of attrition.
Regarding risk warnings, the current macro news environment is volatile, and the aftermath of the non-farm payrolls is not yet settled; any sudden news could cause the price to instantaneously cross key levels, so be sure to strictly execute stop losses and avoid holding positions.
Follow Qinglan Crypto Class to grasp more trading opportunities! Welcome to visit the official website www.qinglan.org
📊 Qinglan TPV Trading Strategy Backtesting Reference
🕒 Last Backtesting Time 09-05 07:00:02
Total Analysis: 3843 Backtesting: 3842 Accuracy Rate: 79.3% (3047/3842)
免责声明:本文章仅代表作者个人观点,不代表本平台的立场和观点。本文章仅供信息分享,不构成对任何人的任何投资建议。用户与作者之间的任何争议,与本平台无关。如网页中刊载的文章或图片涉及侵权,请提供相关的权利证明和身份证明发送邮件到support@aicoin.com,本平台相关工作人员将会进行核查。