On September 7 (Monday), the US stock market was closed due to Labor Day, with no trading and no economic data throughout the day, meaning this article is about the preview for this week, not the market conditions of that evening. The last trading day was September 4 (Friday), and among the four indices, only the Russell 2000 rose by 0.25%, while the Dow Jones Industrial Average fell by 0.51%, the S&P 500 fell by 0.38%, and the Nasdaq Composite fell by 0.29%. The star of the day was KLA Corp (KLAC), which rose by 7.32% to close at $185.60—yet on that day, KLA Corp (KLAC) did not release any company announcements. Today's US stock class supplements last weekend's lesson: on the same day, in the same apparel sector, Lululemon (LULU) fell by 17.4%, while Abercrombie & Fitch (ANF) rose by 4.3%, with the differences not reflected in last quarter's performance. The macro focus this week is Friday's August CPI at 12:30 UTC. This article's data is based on the US stock market close on September 4, 2026.
1. September 4 Close: Only Small Caps Rose
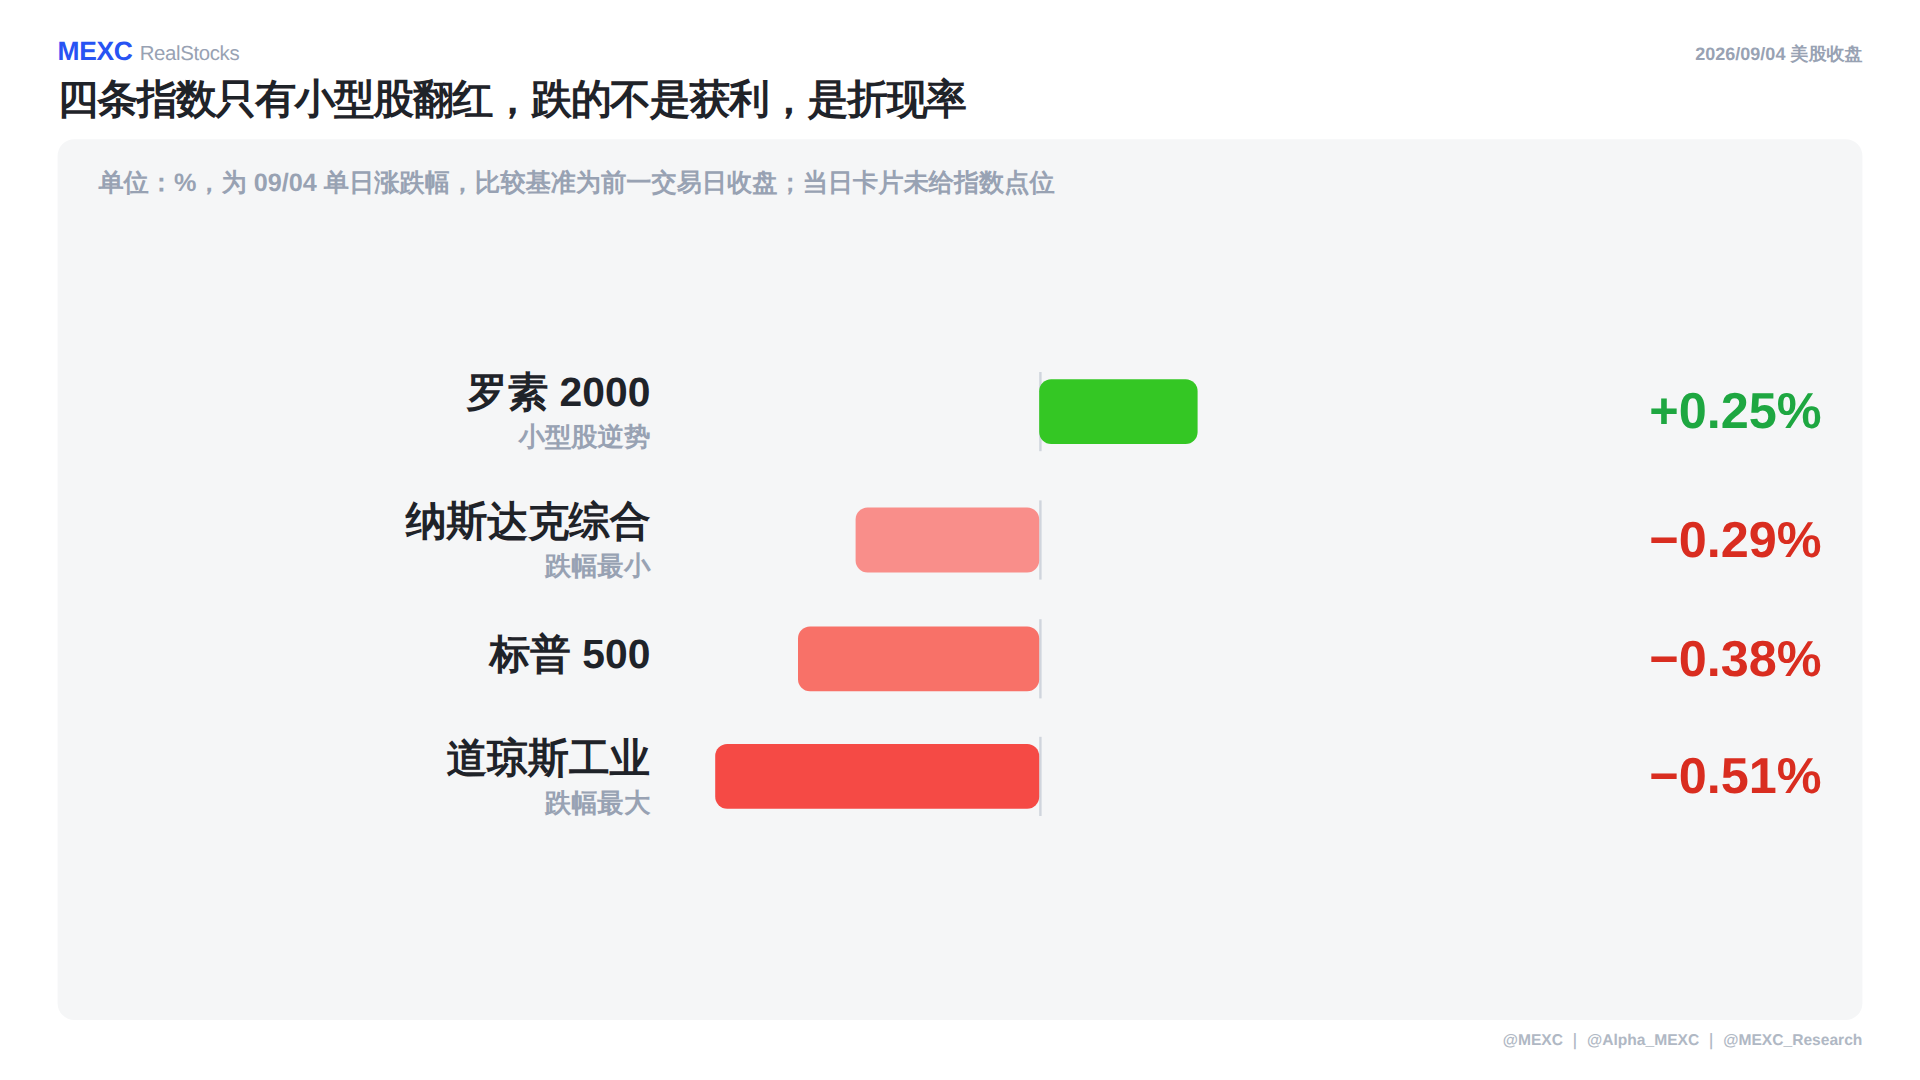
The unit is %, with daily changes relative to the previous trading day's close; the card for that day did not provide index points, so this article only reports the percentage changes, not point changes. On September 4, among the four indices, only the Russell 2000 rose by 0.25%, the Dow Jones Industrial Average fell by 0.51% (the largest drop), the S&P 500 fell by 0.38%, and the Nasdaq Composite fell by 0.29% (the smallest drop).
The reason for the decline is detailed in the same day's employment data: 162,000 non-farm jobs were added in August, well above the market expectation of only 55,000, while the unemployment rate remained steady at 4.1%. While strong job growth is usually good news, at this stage it suggests that money will become more expensive—the yield on two-year US Treasury bonds rose to 4.374% that day, a new high for the year, and market pricing for a rate hike in September temporarily climbed to about 50%. As the discount rate rises, the first assets to be pressured are those with cash flows further out, which is why the three indices dominated by large tech stocks fell, while small caps with low valuations and shorter durations actually turned positive.
One key point to remember: on this day, it was not profits that caused the drop in the US stock market, but the discount rate. Corporate earnings did not deteriorate in a single day; instead, it was the ratio at which the market discounts future cash flows that changed. Understanding this allows one to see why the stock that rose the most is on a completely different logic path than the overall market.
2. Star of the Day KLA Corp (KLAC): Full Score on Peers, Trend Position Only 44
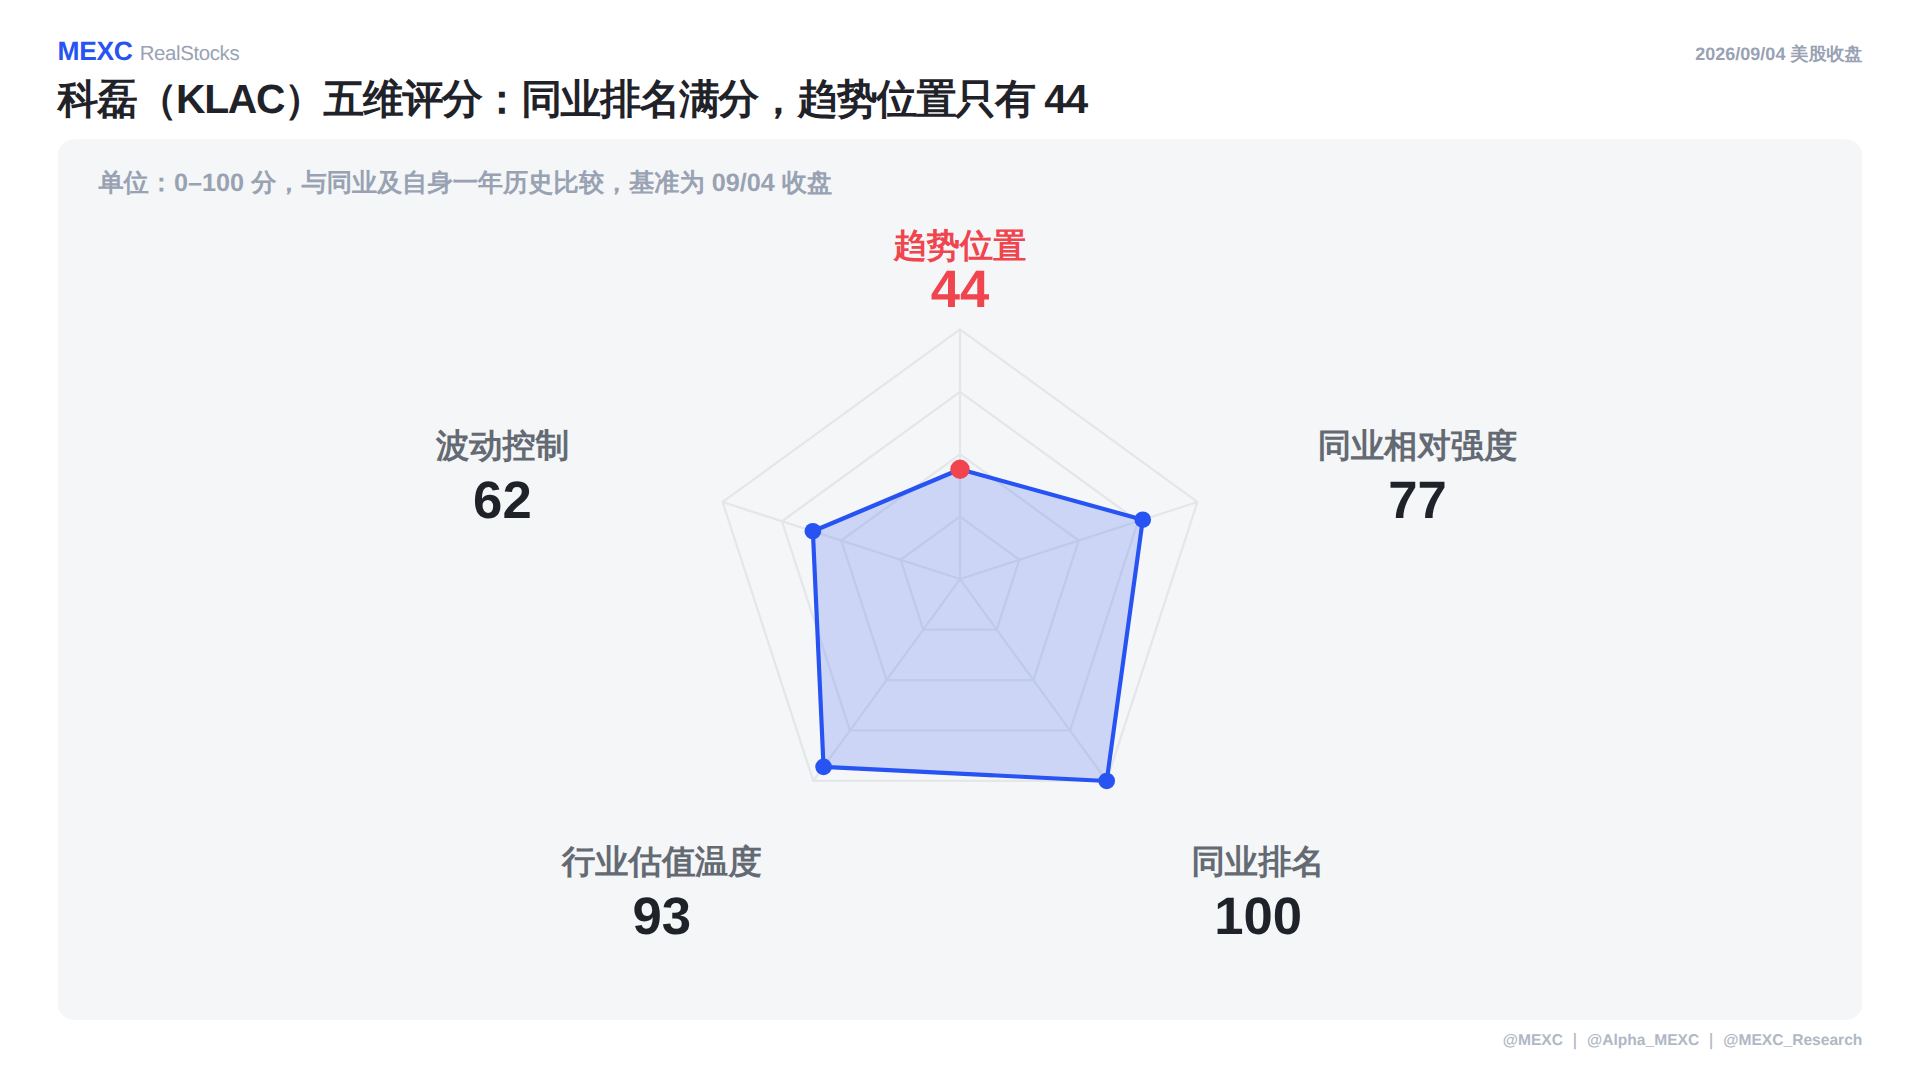
The unit is on a scale of 0-100, compared to industry peers and its own history over the past year, with the benchmark set at the September 4 close. KLA Corp (KLAC) closed at $185.60 on that day, rising by 7.32%, adding more than $16.5 billion to its market cap, reaching $242.4 billion; the trading volume was on par with the 30-day average, with no surge in volume. In five dimensions, it scored a full 100 in peer ranking, an industry valuation temperature of 93, relative strength to peers of 77, volatility control of 62, yet its trend position was only 44, the weakest corner of the pentagon.
What you should really pay attention to is this gap. A peer ranking of 100 means there was no one stronger than it in that group that day; a trend position of 44 means the price is still sitting in the lower half of its yearly range—its yearly range is from $90.67 to $307.37, with $185.60 at the 44% position. The most significant increase and high positioning are not the same: Just looking at the +7.32%, one might think this is a strong stock; adding in the trend position of 44 reveals that this is a stock recovering from a low position.
The trading volume column should also be read together. The volume that day was on par with the 30-day average, indicating that the driving up of stock prices was not due to a sudden influx of new funds, but rather the same batch of money changing hands—it was a repricing, not a breakout on volume.
Same Supply Chain, Money Moves Upstream, Downstream Sold
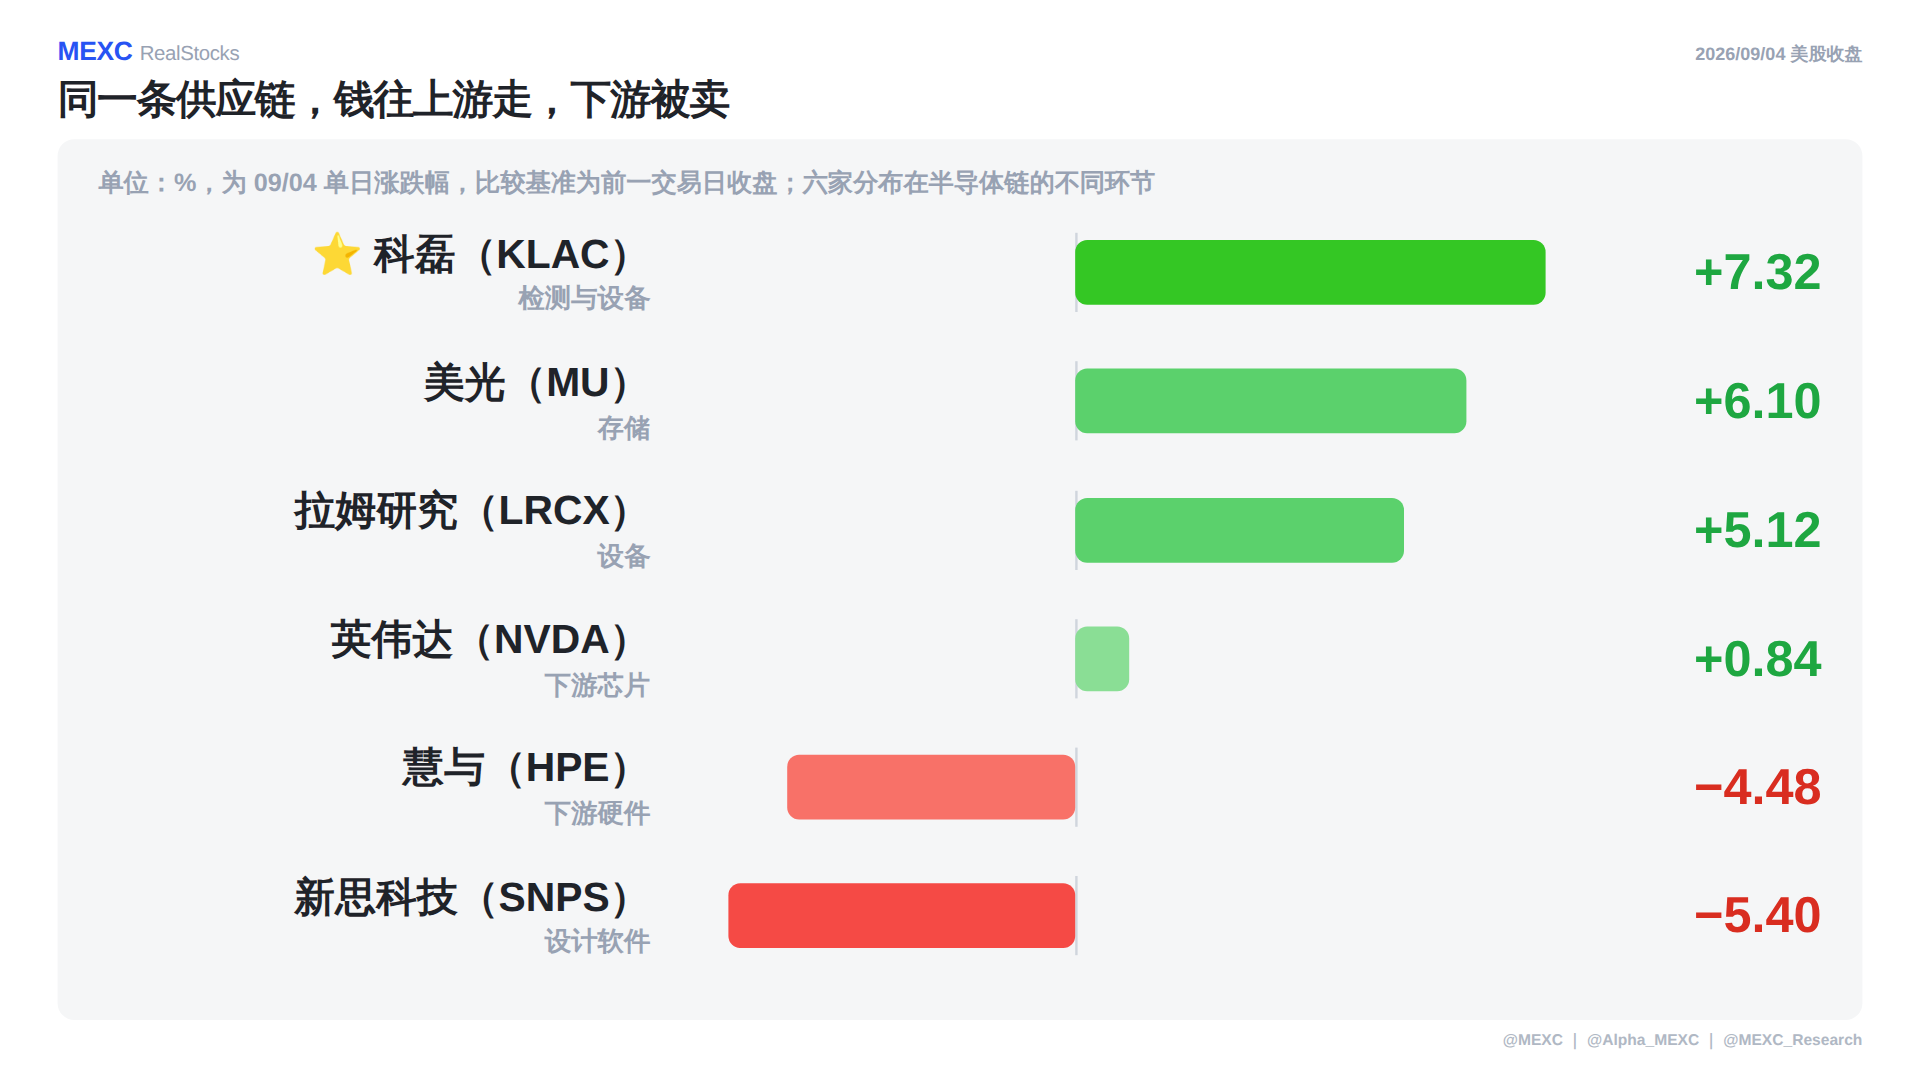
The unit is %, representing the daily percentage change on September 4, with the benchmark being the previous trading day's close. The six companies are distributed across different segments of the semiconductor chain, and the ranking for that day is as follows: KLA Corp (KLAC) rose by 7.32%, Micron (MU) rose by 6.10%, Lam Research (LRCX) rose by 5.12%, Nvidia (NVDA) rose by 0.84%, HPE fell by 4.48%, and Synopsys (SNPS) fell by 5.40%.
The most important thing that day was not who rose the most, but where the dividing line between up and down was drawn. The three companies that rose were all upstream in equipment and storage, while the two that fell were one downstream hardware company and one design software company. The appearance of opposing directions on the same chain indicates that this was not a broad buy-in, but funds were changing positions within the chain: money was pulled from downstream and moved upstream.
Nvidia (NVDA) deserves a separate look. It only rose by 0.84% that day, the smallest increase among the six. Its stock price was already close to its annual high point, with limited upward space; KLA Corp (KLAC), being in the lower half of its range, saw a much larger increase from the same influx of funds. This difference in positioning leads to a difference in elasticity, not related to which company is better.
3. The One that Rises the Most Doesn't Mean It Stands the Highest
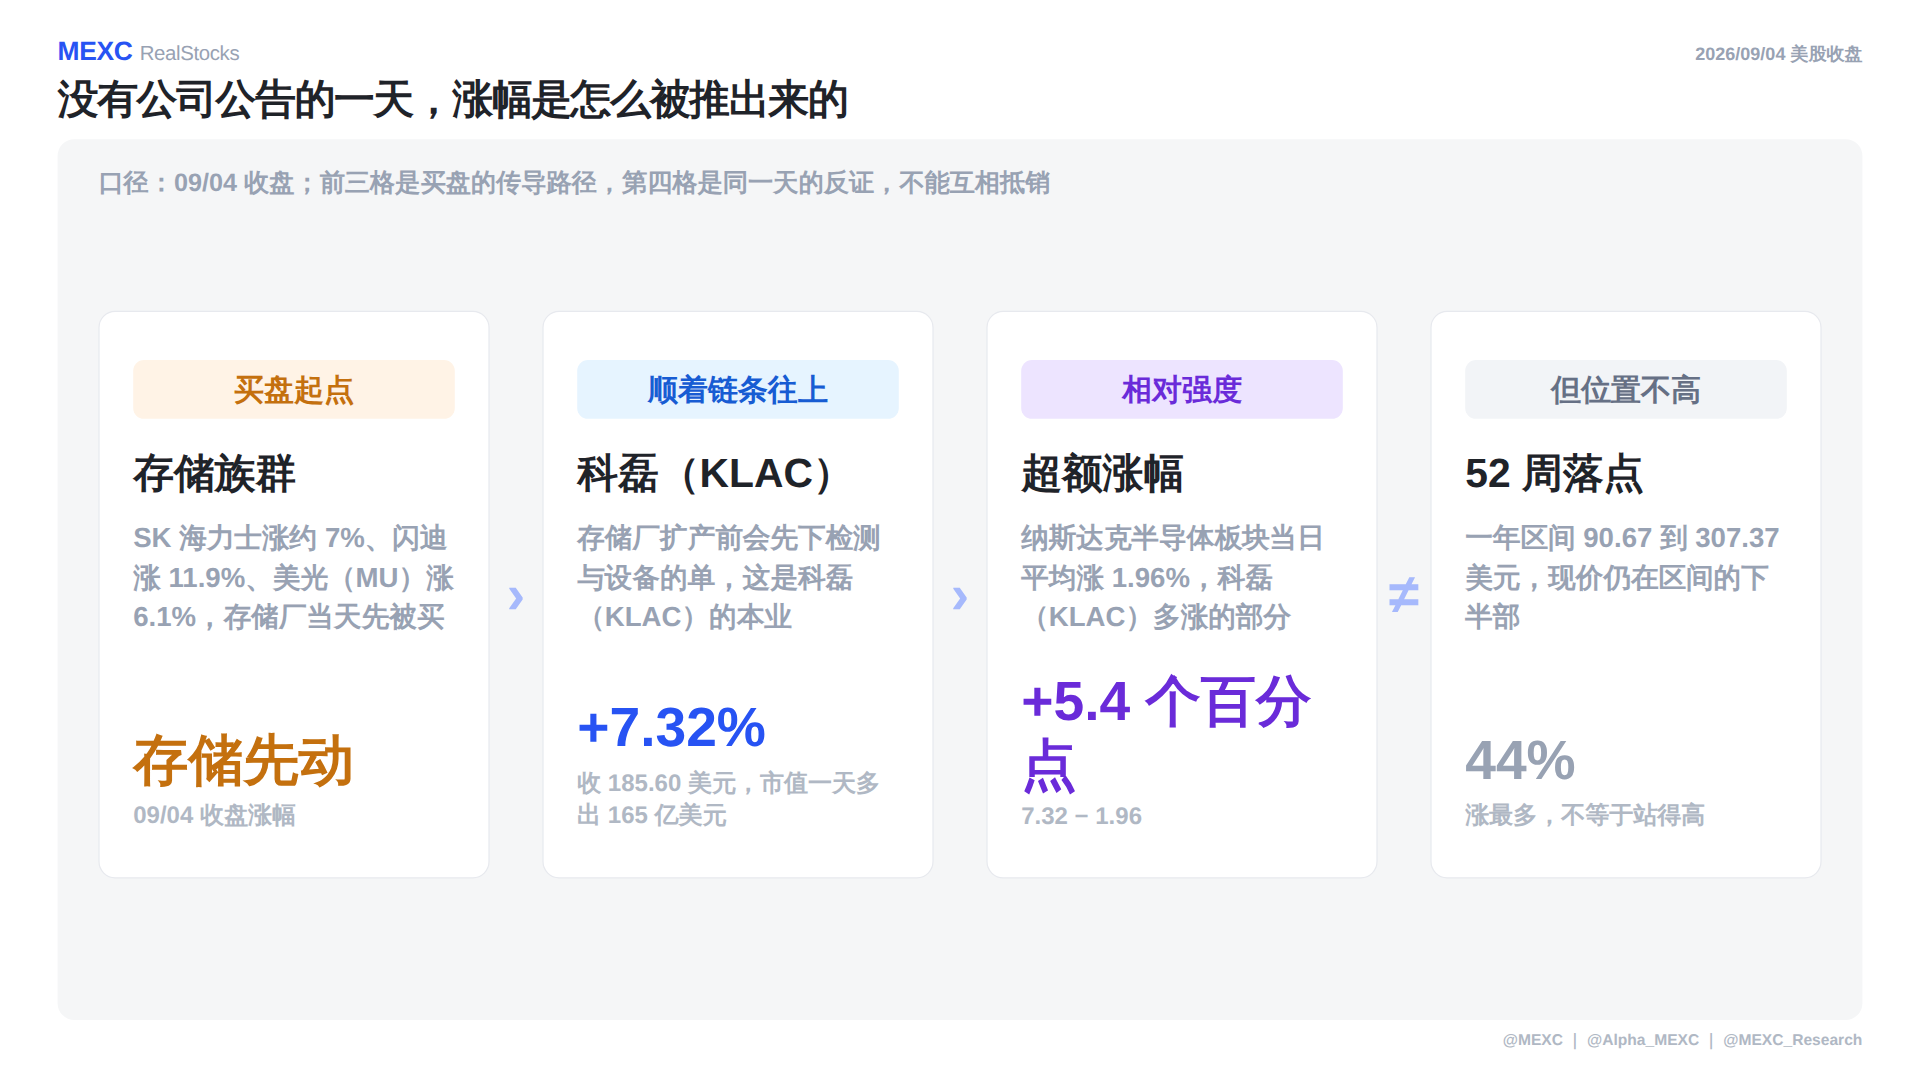
The metrics are based on the September 4 close. Breaking down that day, the price move is associated like this: First, buying started in the storage sector—with SK Hynix rising about 7%, SanDisk rising 11.9%, and Micron (MU) rising 6.1%, the storage companies were bought first; Second, money flowed up the chain because storage companies place orders for testing and equipment before expanding production, and testing is KLA Corp's (KLAC) main business; Third, comparing it to the sector, the Nasdaq semiconductor sector averaged a rise of 1.96% that day while KLA rose by 7.32%, outperforming by 5.4 percentage points, which reflects its own relative strength.
The fourth square serves as a counter-evidence for the same day, not to be offset by the previous three: the 52-week low point is only 44%. The first three squares explain "why did it rise today," while the fourth square indicates "where it stands after the rise." The answers to the two questions can be completely inconsistent.
One important note: KLA Corp (KLAC) did not release any company announcements on that day. The rise came from the overall shift in funds within the equipment and storage sector, rather than from any new information from the company itself. This leads to a very practical distinction: An increase driven by company announcements provides the rationale instantly; an increase driven by sector fund shifts only reveals the rationale when the order numbers appear in the next financial report. Until then, it is an expectation that hasn't yet been verified by performance.
Minor partners are Constellation Energy (CEG), which rose 4.88% to close at $298.96, while the average for independent power producers on Nasdaq rose 5.09%. Its common point with KLA Corp (KLAC) is the same type of business model: nuclear power plants sell their output on long-term contracts to data centers, effectively locking in shipments for the next few years; similarly, storage companies place equipment orders before increasing production, translating future capacity into today's orders. The market is buying the same thing—secured future revenues.
4. US Stock Class: Same Day, Same Sector, One Up and One Down
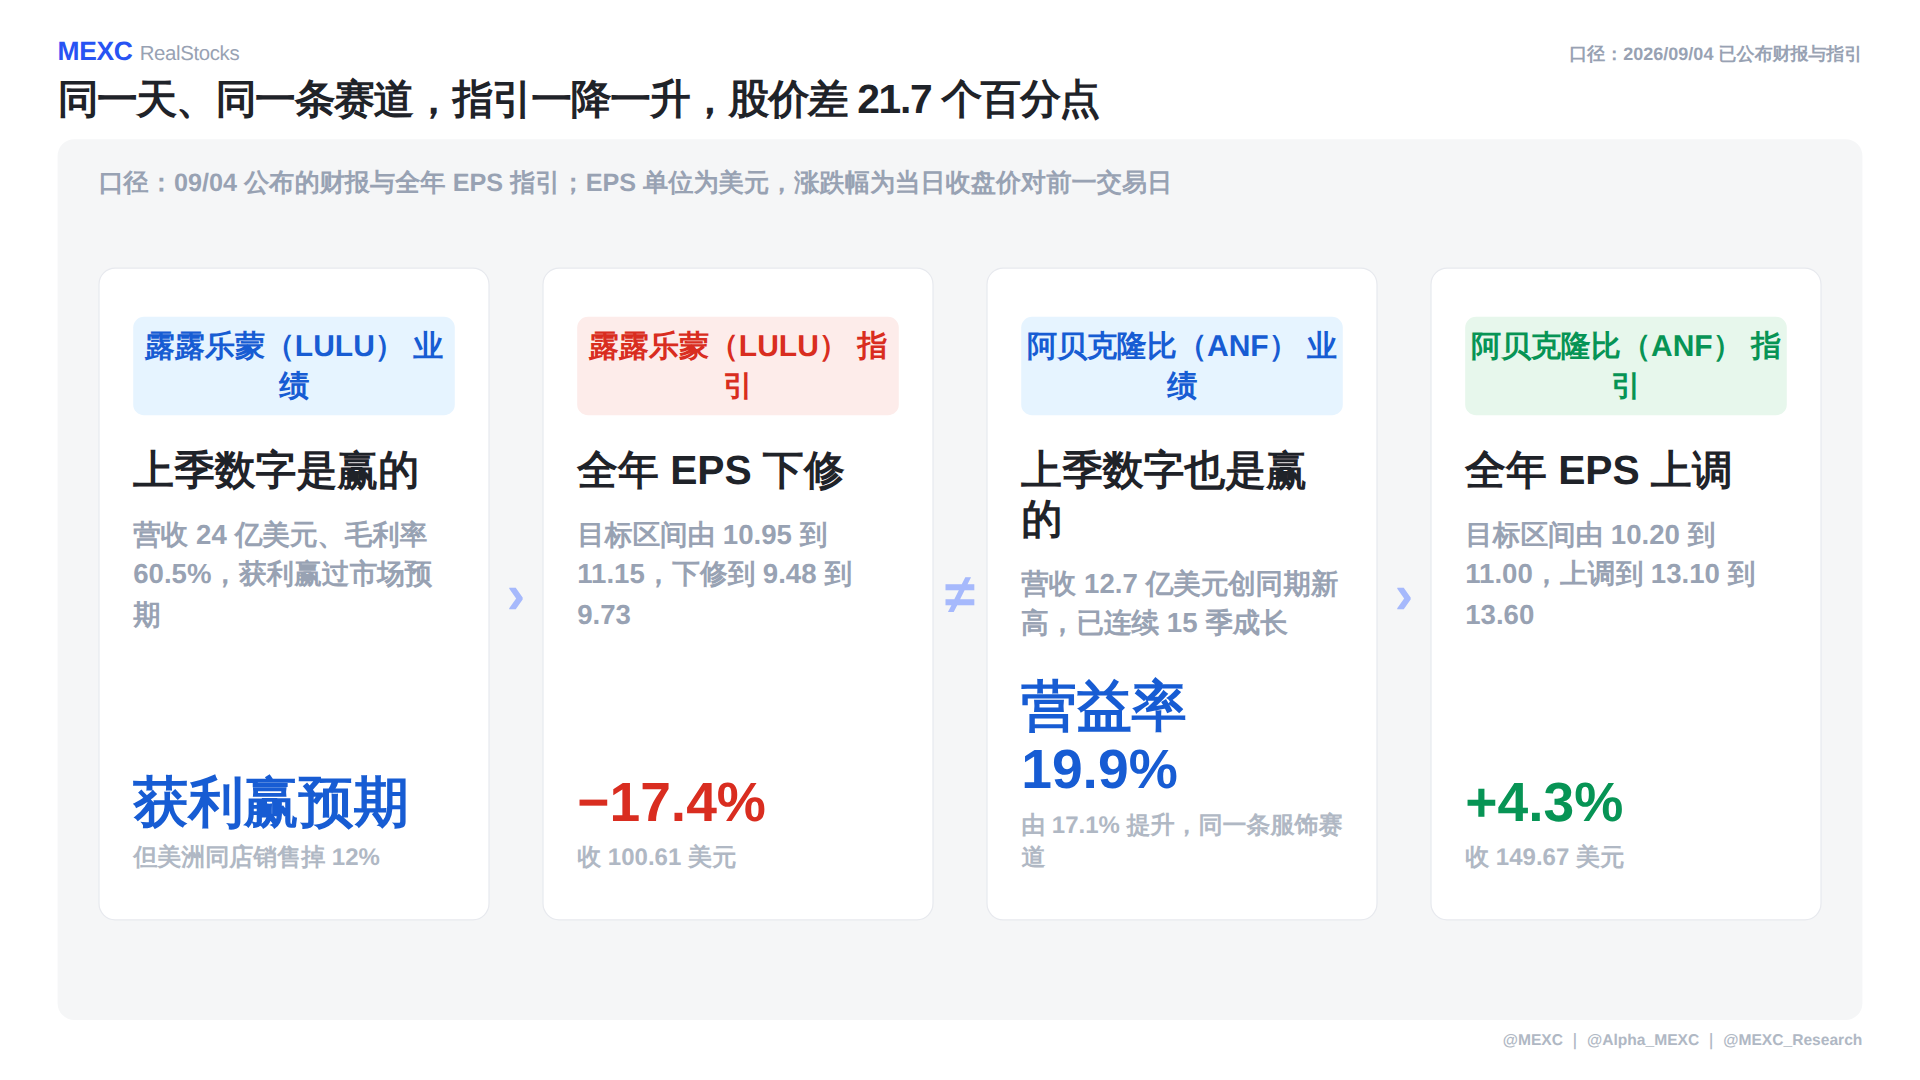
The metrics are based on the earnings reports and annual EPS guidance disclosed on September 4, with the percentage change being from that day's closing price compared to the previous trading day. Lululemon (LULU) posted revenue of $2.4 billion last quarter with a gross margin of 60.5%, outperforming market expectations; however, same-store sales in the Americas fell by 12%, and the full-year EPS guidance was revised down from 10.95-11.15 to 9.48-9.73; on that day, the stock price fell by 17.4% to close at $100.61. Abercrombie & Fitch (ANF) posted revenue of $1.27 billion last quarter, setting a new record for the period and achieving growth for 15 consecutive quarters, with its operating margin increasing from 17.1% to 19.9%, while its full-year EPS guidance was raised from 10.20-11.00 to 13.10-13.60; on that day, its stock price rose by 4.3% to close at $149.67.
Both companies performed well in the previous quarter, yet their stock prices diverged by 21.7 percentage points. It wasn't the revenue line that killed the valuation, nor the gross margin line; it was the guidance line. Lululemon (LULU) revised down its profit commitment for the coming year, while Abercrombie & Fitch (ANF) raised it for the same thing—the market revalued "how much this company can earn in the coming year," not "how much it earned last quarter."
Why is this the case? Stock prices reflect the future, not just the recently completed quarter. The performance in the earnings report is historical data, which the market has already priced in through expectations before the announcement; guidance is the only time a company publicly states its future outlook, signed off by management. Thus, the same earnings report can yield both wins and losses—winning last quarter but potentially losing in the next year, while the price follows the latter. The criterion is summed up in one sentence: Check the guidance first, then look at the performance.
Same Sector, 17 Times Difference in Retracement
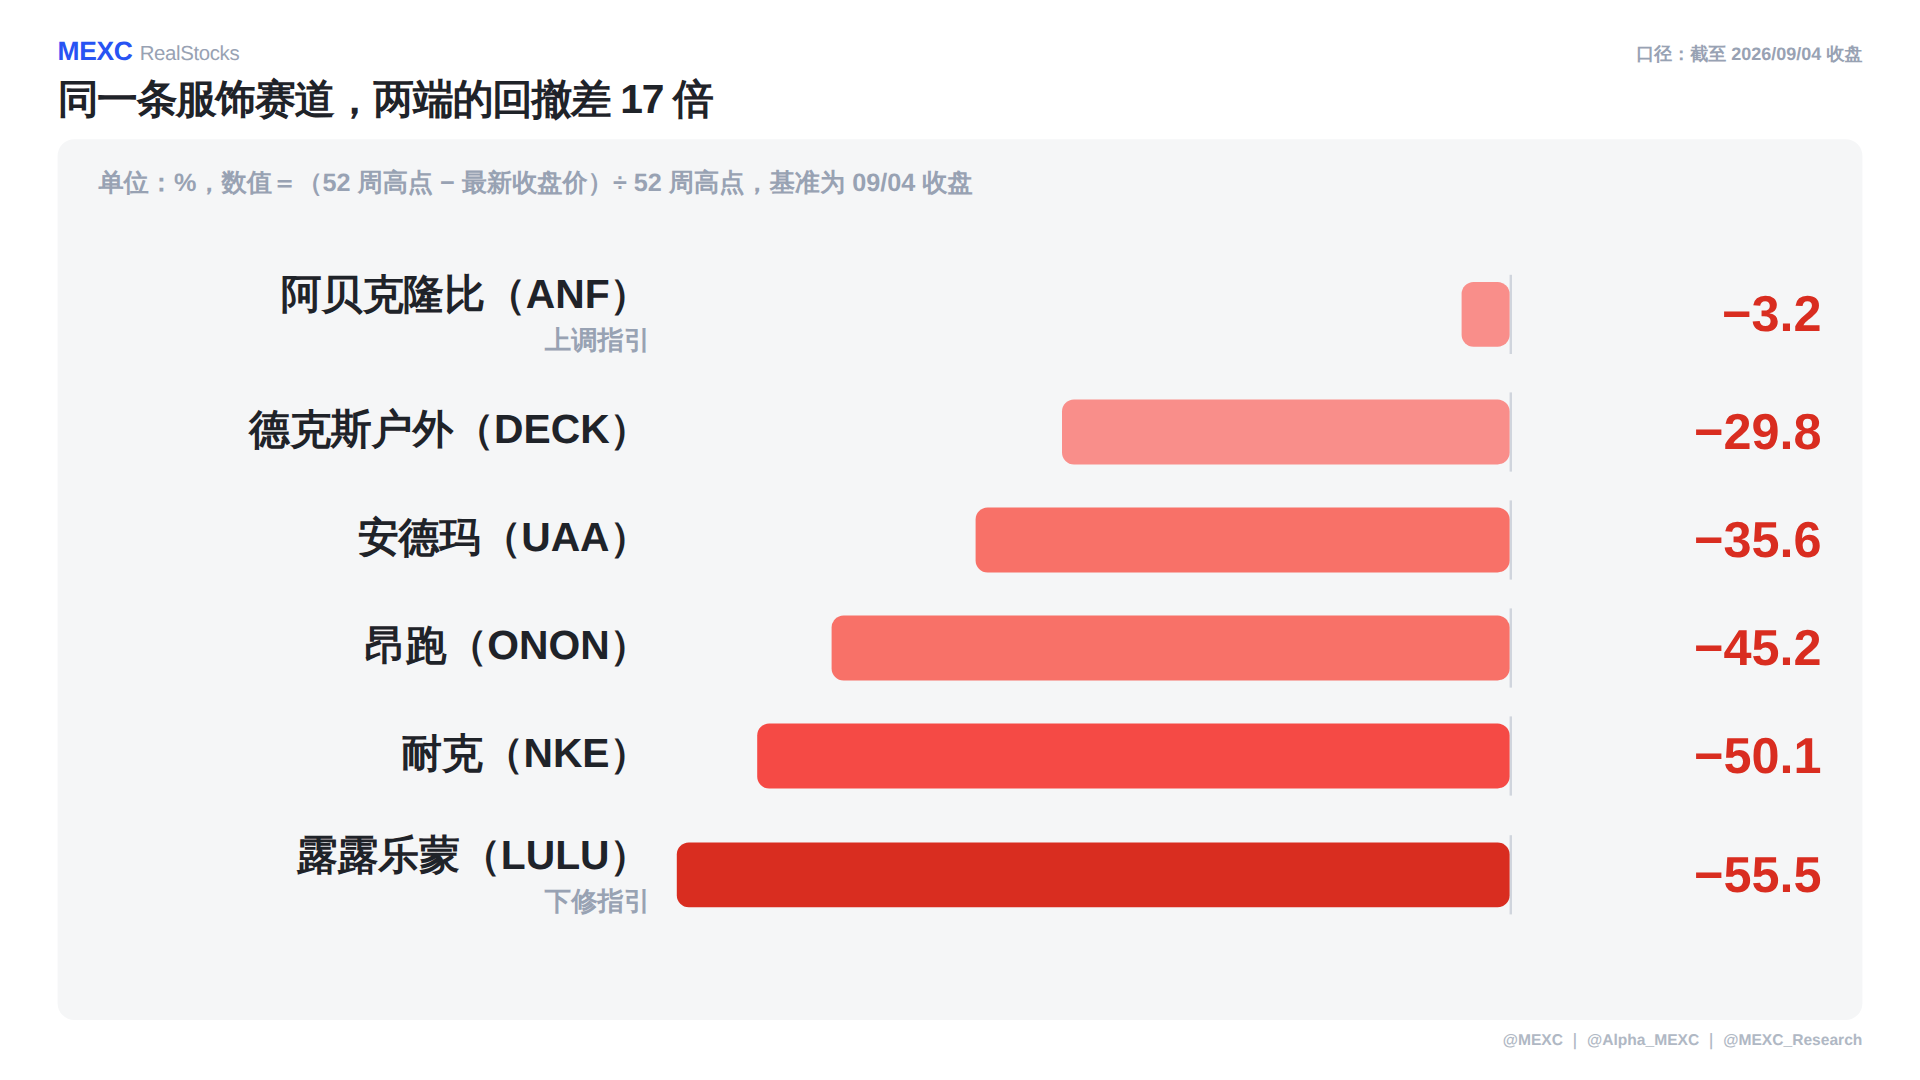
The unit is %, with the value being calculated by subtracting the latest closing price from the 52-week high point, then dividing by the 52-week high point, based on the September 4 close. The ranking of the six apparel companies is: Abercrombie & Fitch (ANF) has retraced 3.2% from its high, Deckers Outdoor (DECK) has retraced 29.8%, Under Armour (UAA) has retraced 35.6%, On running (ONON) has retraced 45.2%, Nike (NKE) has retraced 50.1%, and Lululemon (LULU) has retraced 55.5%. The difference between the two ends is about 17 times.
In the same sector, under the same consumption environment, with the same tariffs and inventory cycles, the degree of retracement can differ to this extent. The cycle affects each company in the same way; the difference lies in the market's belief in the next chapter for that company: the one raising guidance is nearly at its highs, while the one lowering guidance has lost more than half.
Understanding a Company—Abercrombie & Fitch (ANF): Founded in 1892, it is an American apparel group, with Abercrombie targeting adult clientele and Hollister targeting teenagers. The two brands share the same supply chain and store network, relying on the speed of style updates to make profits. This quarter, its operating margin improved from 17.1% to 19.9%, achieved not by selling items at higher prices but by reducing unsold inventory.
5. What to Watch This Week: August CPI on Friday at 12:30 UTC
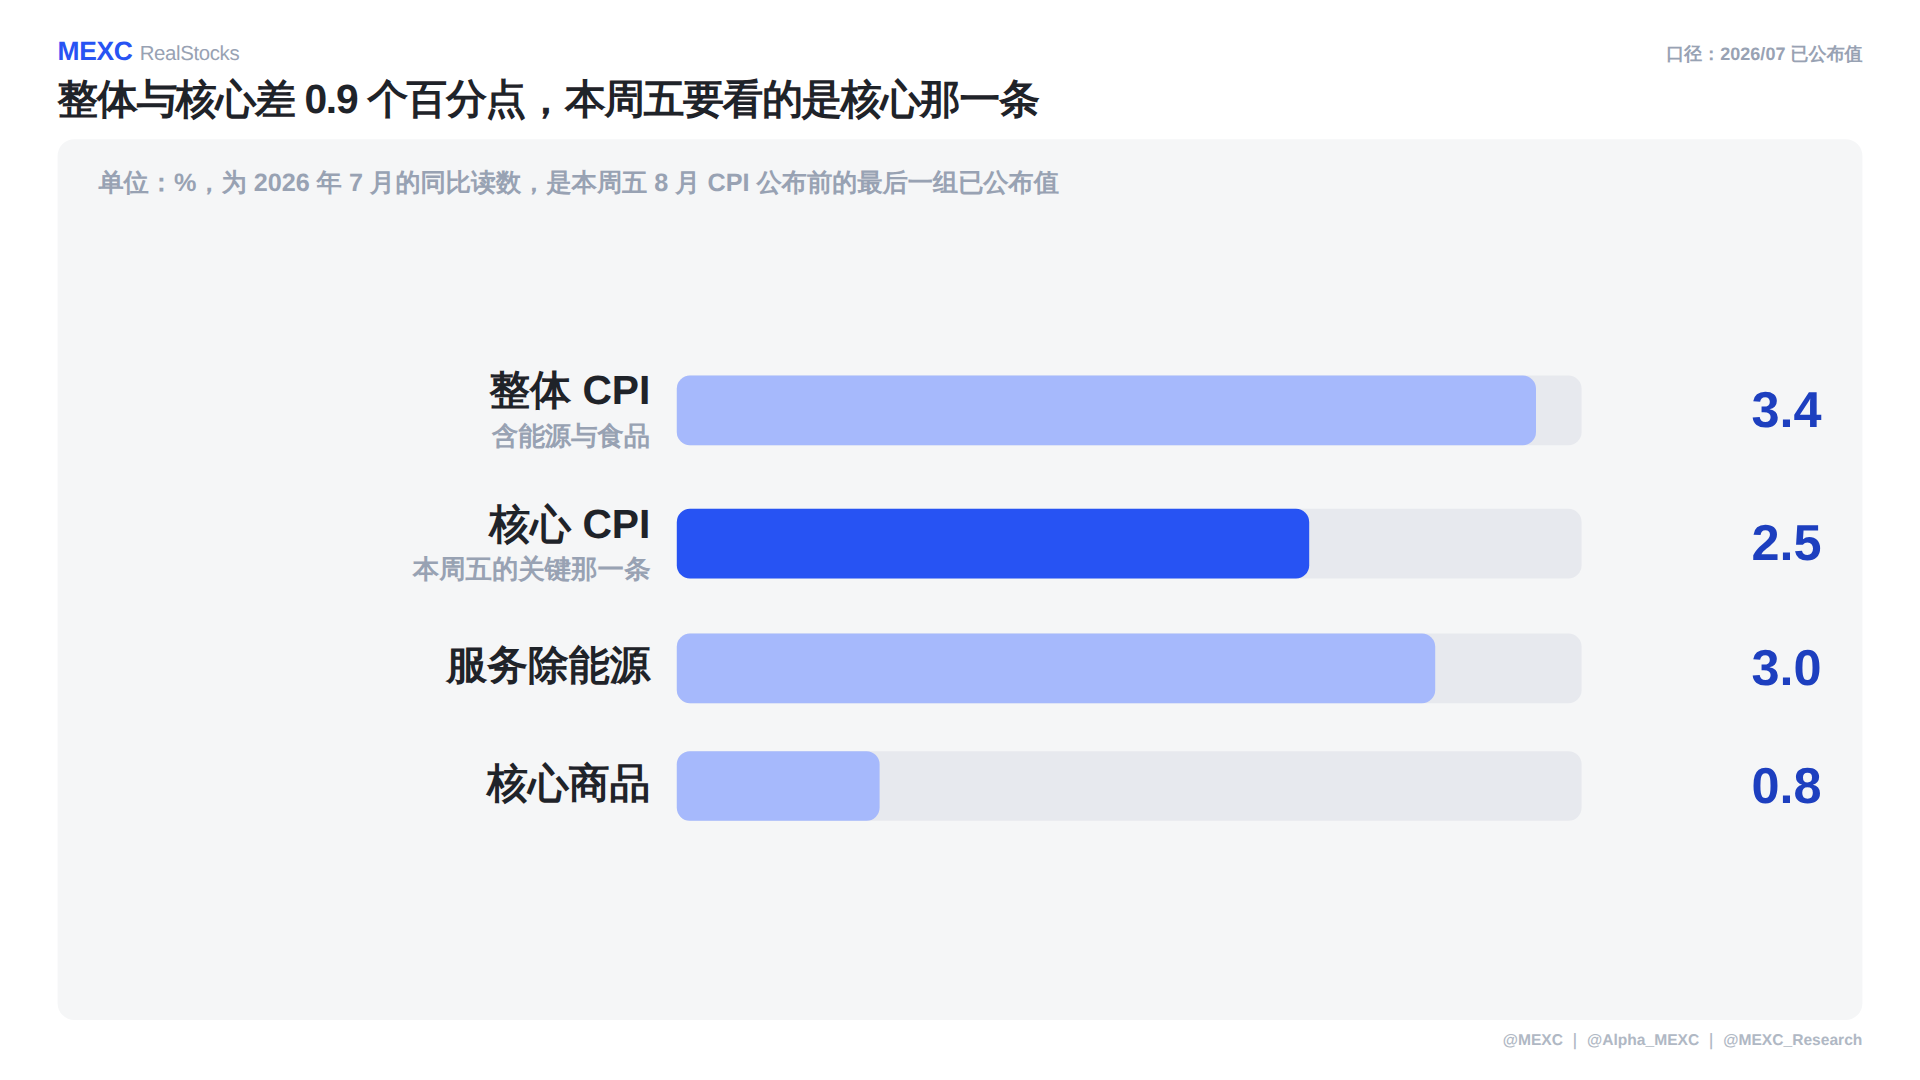
The unit is %, representing the year-on-year reading for July 2026, and this data will be the final set of announced values before the August CPI is published this Friday. July's four metrics were: overall CPI rose by 3.4%, core CPI rose by 2.5%, services excluding energy rose by 3.0%, and core goods rose by 0.8%.
This week's agenda is as follows: Monday market closure (Labor Day); Tuesday will have the NFIB Small Business Optimism Index and consumer credit; Wednesday will feature MBA mortgage applications; Thursday at 12:30 UTC will release PPI, with Oracle (ORCL) and Adobe (ADBE) reporting after hours; Friday at 12:30 UTC will report August CPI, with Kroger (KR) releasing before the market opens. (Market opening time is 13:30 UTC and closing at 20:00 UTC; during standard time, add an hour.)
Why is the Friday report the most important? It is the last inflation data before the interest rate decision on September 16. The current policy range is between 3.50% and 3.75%, with no change in five consecutive meetings. Inflation determines interest rates, which in turn determine stock and bond prices—this is upstream for all asset prices this week.
Focus on core rather than overall for specific reasons: energy prices are determined by supply and geopolitical factors, the monetary policy cannot influence it. The difference between overall and core is 0.9 percentage points, while services and goods are both not far from core, indicating that a significant part of the overall figure has been elevated by energy.
6. What's Supporting Overall is Gasoline, and What's Deciding Core is Housing
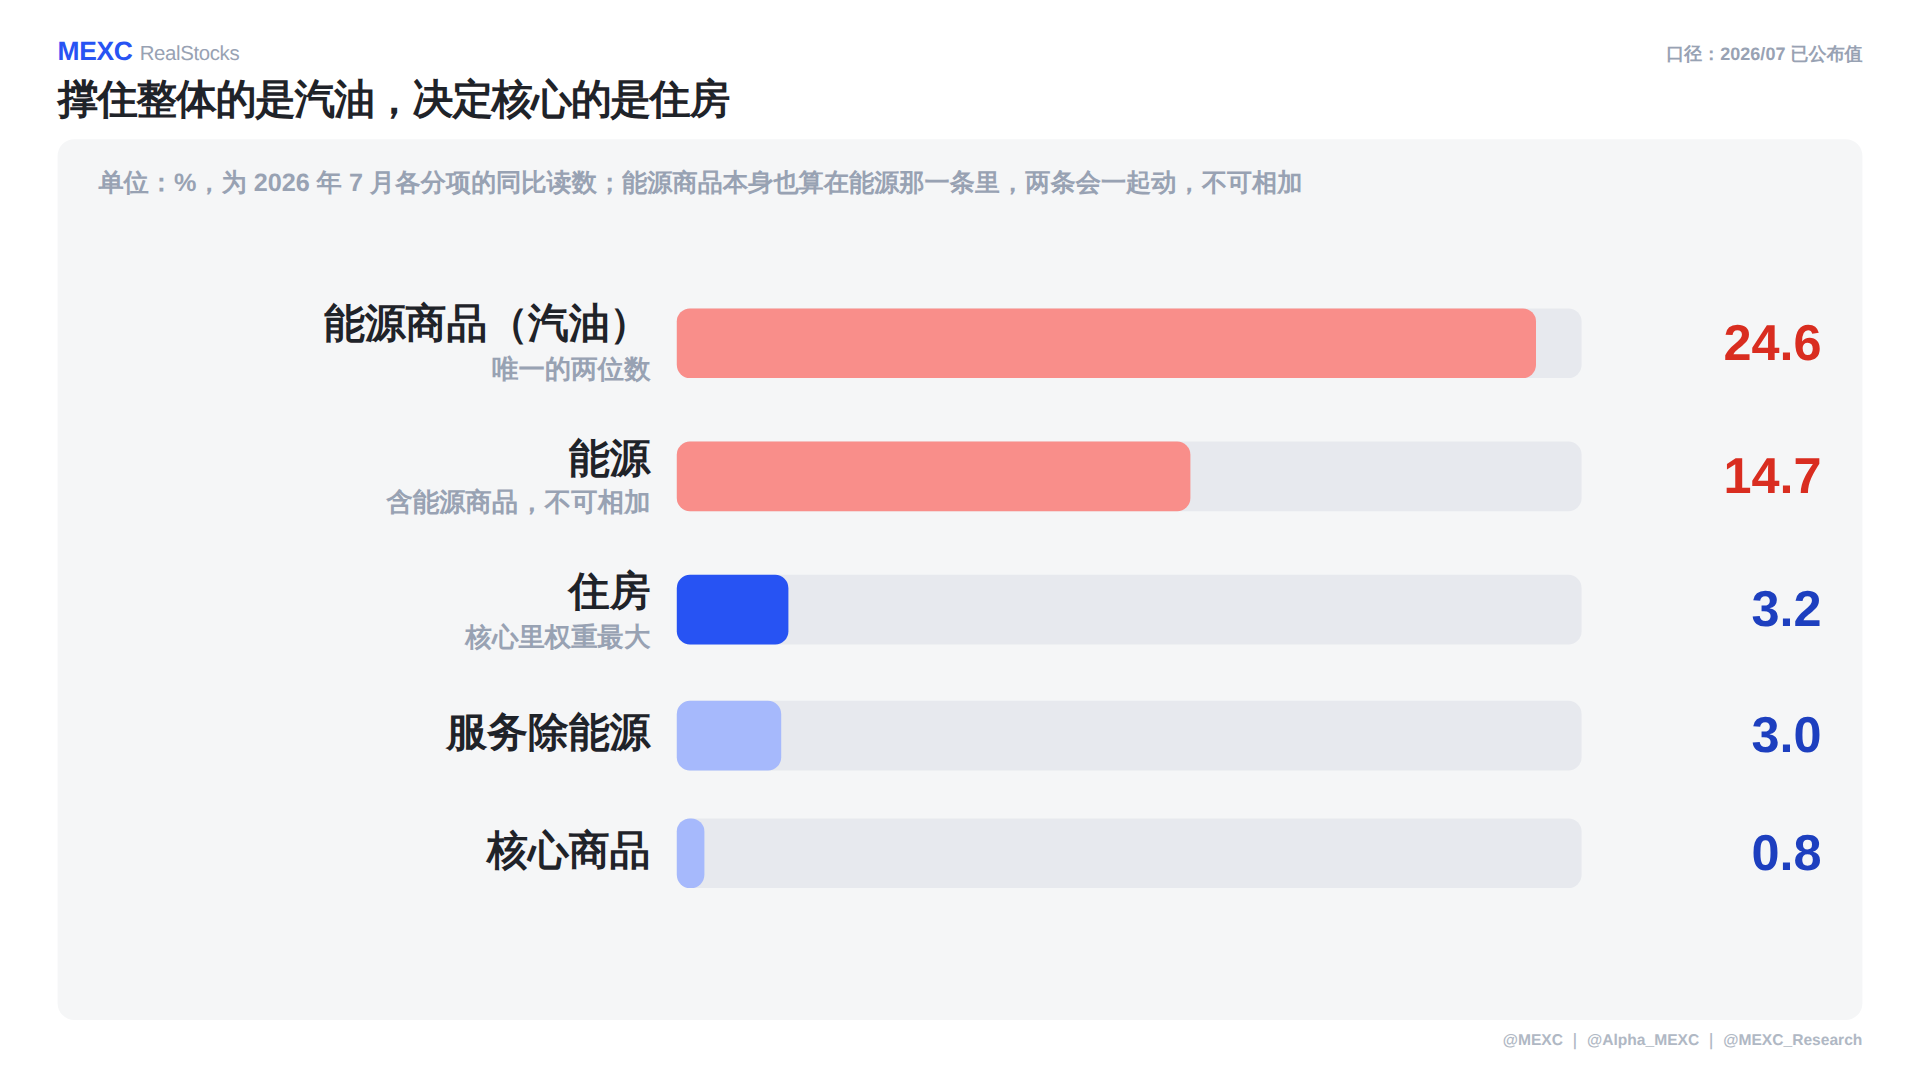
The unit is %, representing year-on-year readings for each item in July 2026. Breaking down July: energy goods (mainly gasoline) rose by 24.6%, being the only double-digit figure; overall energy rose by 14.7%; housing rose by 3.2%; services excluding energy rose by 3.0%; core goods rose by 0.8%.
There is a crucial definitional issue here: energy goods are also counted under the energy item, and the two move together, so they cannot be added. Seeing 24.6% and 14.7% side by side does not imply that the contribution of energy to inflation is the sum of the two.
The key comparison to remember is this: supporting the overall reading is gasoline, the only double-digit figure; while core goods rose by only 0.8%, which is almost negligible. Housing's increase of 3.2% may not seem high, but it carries the greatest weight in the core, determining whether the core can continue to move downwards.
So when the data is released this Friday, the reading will be interpreted in two steps: the first step is to see if the core year-on-year holds above 2.5%, and the second step is to analyze the housing item. Relying solely on the retracting energy to lower the overall Figure will not last long—this is because the impact of retracting energy will diminish with baseline changes, while housing is a slow-moving variable; once it sticks, the core will not come down.
7. Frequently Asked Questions
Q1: KLA Corp (KLAC) rose 7.32% in one day; why does it have only 44 points for "trend position" in the five-dimensional score?
Because the two metrics measure different things. The single-day percentage increase compares today's performance, whereas trend position compares the price in its own 52-week range. KLA Corp (KLAC) closed at $185.60 on September 4, with a yearly range of $90.67 to $307.37, placing its low at 44%, still in the lower half of the range. The same scoring system has a peer ranking of 100 and a trend position of only 44, indicating there was no one stronger than it that day, but its positioning is not high.
Q2: KLA Corp (KLAC) did not have company announcements on that day; where did the rise come from?
From the overall fund shift in the storage sector. On that day, SK Hynix rose about 7%, SanDisk rose 11.9%, and Micron (MU) rose 6.1%, with storage companies bought first; before storage facilities expand production, they would place orders for testing and equipment, and testing is KLA Corp's (KLAC) main business, so funds flowed up the chain. It is important to note that this rise had no company-level evidence to support it on that day, and the actual figures for the orders would not appear until the next financial report.
Q3: Why are some rising and some falling within the same supply chain?
Because this is not a broad buy-in; it is a positional shift within the chain. On September 4, upstream KLA Corp (KLAC) rose by 7.32%, Micron (MU) rose by 6.10%, and Lam Research (LRCX) rose by 5.12%, while downstream HPE fell by 4.48% and Synopsys (SNPS) fell by 5.40%. The appearance of opposing directions on the same chain indicates that money was siphoned from downstream and moved upstream. Simply looking at average sector performance (that day, the Nasdaq semiconductor sector averaged a rise of 1.96%) would completely miss these internal disparities.
Q4: Despite Lululemon (LULU) performing better than expected last quarter, why did its stock price drop by 17.4%?
Because the market prices in the future, not just the last quarter. In that earnings report, revenue was $2.4 billion, gross margin was 60.5%, and profits exceeded expectations, but same-store sales in the Americas fell by 12%, and more critically, the full-year EPS target was revised down from 10.95-11.15 to 9.48-9.73. Performance is historical data, while guidance is the company's public outlook for the future. On the same day, Abercrombie & Fitch (ANF) raised guidance from 10.20-11.00 to 13.10-13.60, resulting in a 4.3% stock price increase—both companies had positive results in the last quarter, but the difference lies in their guidance.
Q5: Which column should be looked at first for Friday’s CPI?
The first step is to check whether the core year-on-year stays above 2.5%, then look at the housing item. The July readings were: overall CPI rose 3.4%, core CPI rose 2.5%, a difference of 0.9 percentage points; supporting the overall figure was the 24.6% rise in energy goods (gasoline), the only double-digit figure, while core goods rose only 0.8%. Housing rose by 3.2% and carries the largest weight in the core, thus deciding whether the core can continue to move down. Additionally, a definitional note: energy goods are already counted under the energy item, so the two should not be added together.
免责声明:本文章仅代表作者个人观点,不代表本平台的立场和观点。本文章仅供信息分享,不构成对任何人的任何投资建议。用户与作者之间的任何争议,与本平台无关。如网页中刊载的文章或图片涉及侵权,请提供相关的权利证明和身份证明发送邮件到support@aicoin.com,本平台相关工作人员将会进行核查。


