Crypto Circle Academician: The rebound momentum of 9.9 Bitcoin (BTC) has quietly exhausted, has the large-scale trend already buried hidden dangers? Latest market analysis and operational advice interpretation
The current price of Bitcoin is 79500, sometimes it rises to give hope, and sometimes it drops to scare panic, many people are swept back and forth to stop losses, the pace of operation is completely driven by the market. Under the premise of a bullish outlook, the short-term pullback pressure is also indeed in front of us; chasing highs fears being trapped, and bottom-fishing fears further decline. Many retail investors always think about catching every wave of rise and fall, resulting in frequent back-and-forth trading, earning very little profit, while losing a large part due to fees and stop losses. The market will not always rise unilaterally; the consolidation phase tests patience more, understanding key support and pressure, managing hands is more important than frequently opening orders.
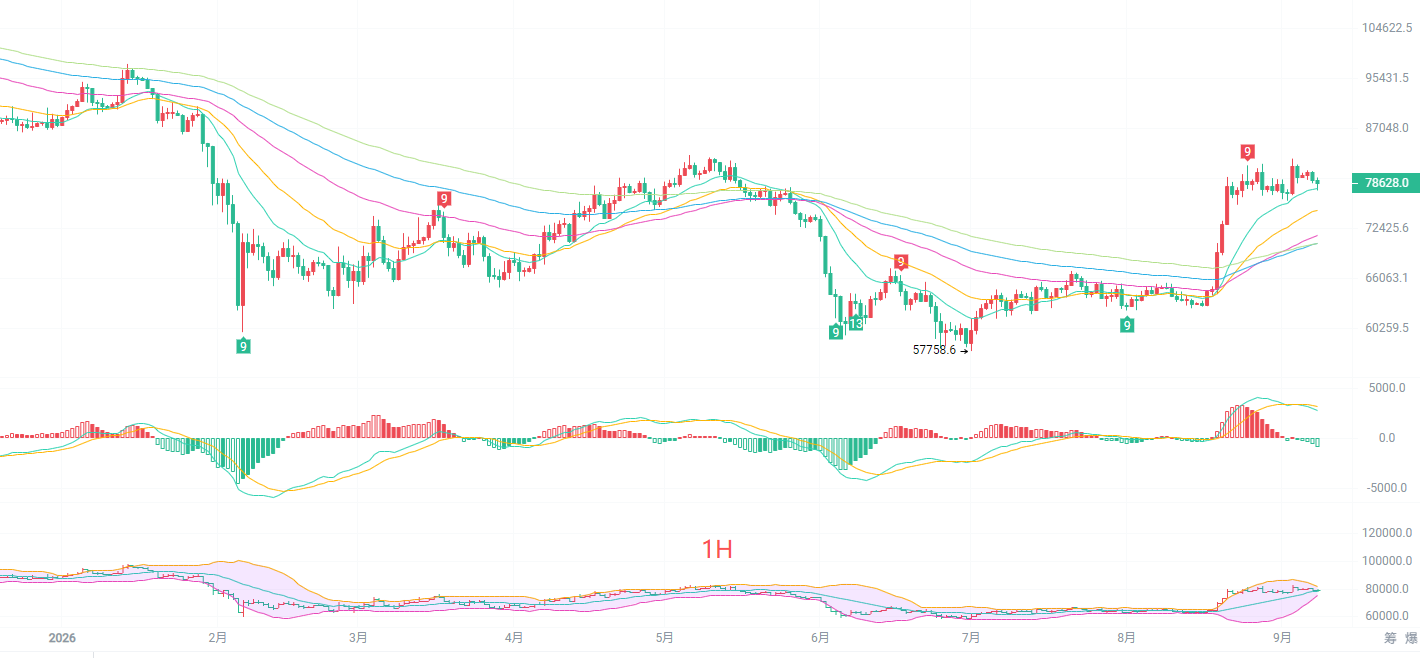
The daily K-line moving average system EMA30, EMA60 remains upward, the mid-term bullish trend structure has not been damaged, but the MACD indicator red bars continue to shorten, DIF has started to turn down, and bullish momentum is obviously weakening. The upper Bollinger band is contracting downwards, and the price has fallen back to oscillate near the middle track of the Bollinger band. There is no clear reversal signal on the daily chart, but the upward pressure is heavy, and it is very difficult to directly launch a violent rise again in the short term. The strong pressure above is around 84000, and the key support below is 72600. Once this position is lost, the current rebound structure will be damaged, and the market will undergo further deep adjustments.
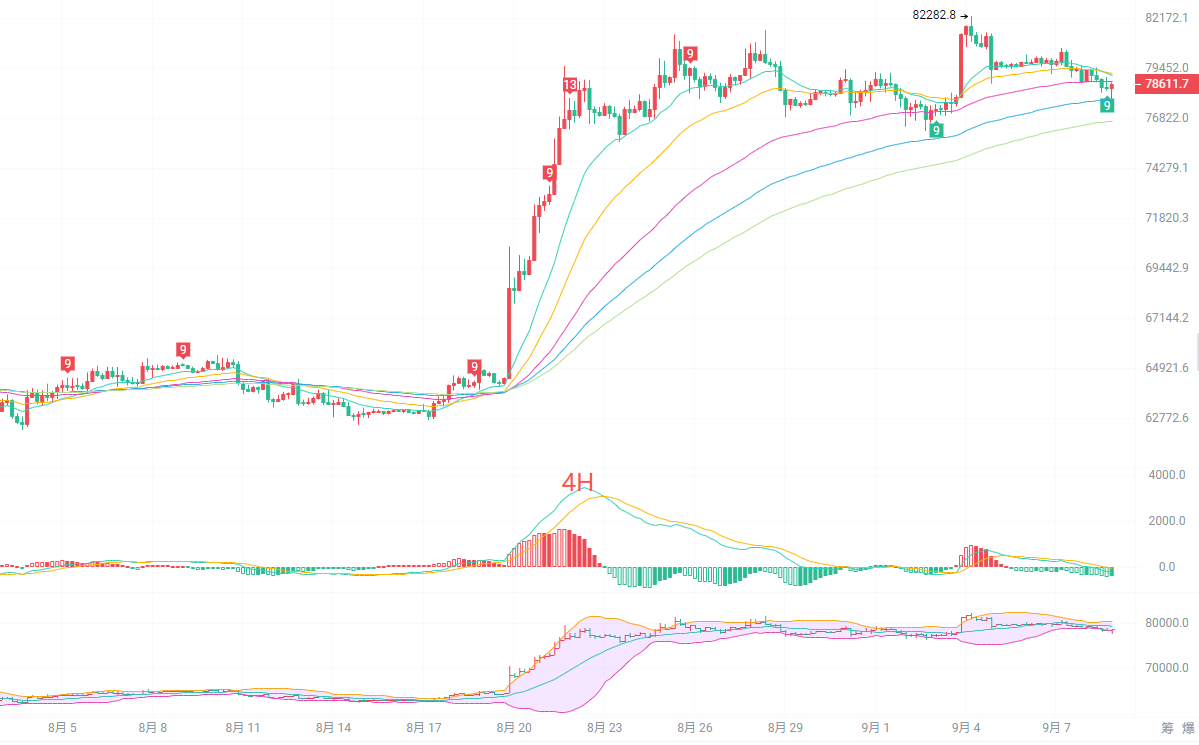
The short-term EMA15, EMA30 moving averages on the four-hour K-line have turned down, and the price is operating below the short-term moving averages, forming a pullback structure on the 4-hour level. The MACD has formed a death cross, with green bars continuously releasing, and short-selling strength is dominant in the short term. The Bollinger band is contracting, and the price is running below the middle track of the Bollinger band. The first strong pressure above is in the range of 79200 to 80000, where there is a dense pressure zone of moving averages; if the rebound cannot stabilize in this range, it will continue to retrace. The primary support below is 77500, with further strong support at 74400. Currently, the 4-hour level is in a recovery pullback after the rise; as long as it does not effectively fall below 74400, the large-scale bullish structure is still retained.
Short-term reference:
Buy from 77500 to 77000, stop loss at 500 points, target at 80400 to 82000.
Sell from 79800 to 80300, stop loss at 500 points, target at 79000 to 78300.
Specific operations should be based on real-time data from the market. For more detailed information, you can consult the author. The article release has a delay; the suggestions are for reference only, and risks are borne by yourself.

Warm reminder: The above content is only created by the author's public account, and the advertisements at the end of the article and in the comment section are unrelated to the author. Please identify carefully, thank you for reading.
免责声明:本文章仅代表作者个人观点,不代表本平台的立场和观点。本文章仅供信息分享,不构成对任何人的任何投资建议。用户与作者之间的任何争议,与本平台无关。如网页中刊载的文章或图片涉及侵权,请提供相关的权利证明和身份证明发送邮件到support@aicoin.com,本平台相关工作人员将会进行核查。