Crypto Circle Academician: The long-term bullish foundation for 9.9 Ethereum (ETH) is still present, what is the response strategy under short-term pressure? Latest market analysis reference
The current price of Ethereum is 2490; those who are bullish feel that the trend has reversed upwards and consider a pullback a buying opportunity; those who are bearish believe that this wave of rebound has already peaked and a pullback is imminent. The current price at 2482 is neither here nor there, fearing being trapped by chasing highs and afraid of further declines when trying to buy the dip. The most common mistake many retail investors make is frequently trading back and forth in a volatile range, getting stopped out repeatedly. To make a profit in this kind of market, one should not rely on feelings to bet on the direction; respect market signals, clearly plan entry points and stop losses in advance, and avoid blind heavy positions to maintain a steady rhythm in a volatile market.
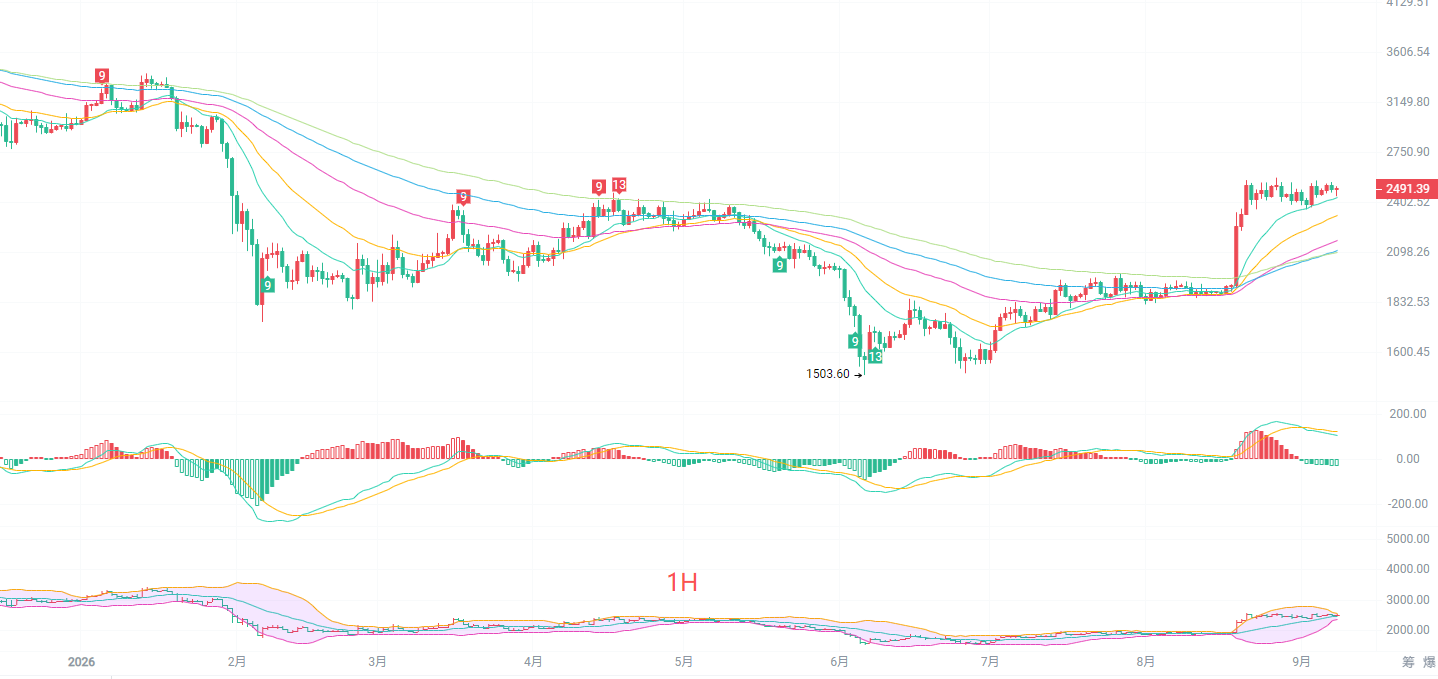
The medium-term trend in the daily candlestick chart has shifted from a decline to a volatile upward movement. The EMA15 and EMA30 are providing upward support, and the moving averages are in a bullish arrangement, with the long-term bullish foundation still intact. However, the price is approaching the resistance zone of 2500-2550, having made several attempts to break through the new high without success, and the MACD indicator's red bars are gradually shrinking, showing signs of diminishing bullish momentum. The Bollinger Bands are opening upwards, with the price operating between the upper and middle bands, and the lower band at 2365 serves as a strong key support. From the Fibonacci perspective, the 78.6% position of this rebound at 2242 has been firmly maintained; as long as this position is not effectively broken down, the large-scale rebound structure will not be destroyed.
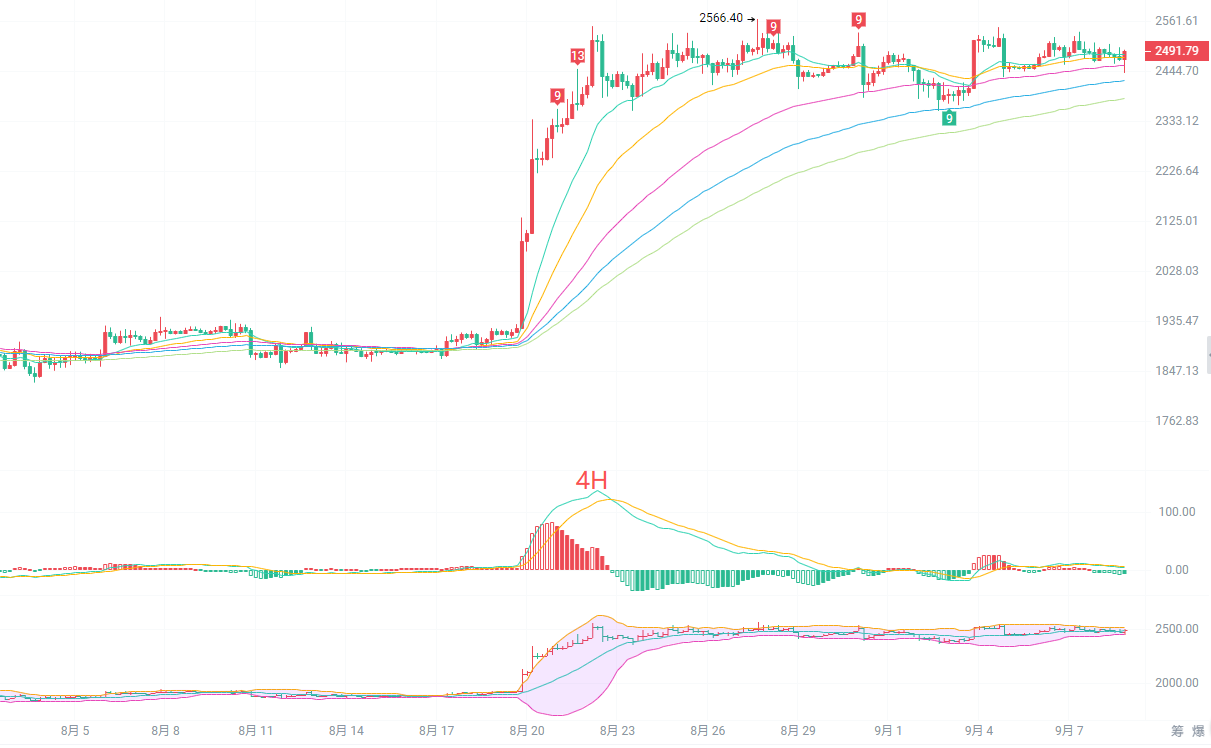
The short-term moving averages in the four-hour candlestick chart are entangled, indicating intense bullish and bearish competition, with no clear trend formed. The resistance above is at 2483-2514, which is also the position of the upper Bollinger Band, having failed to achieve an effective breakthrough after multiple tests; the support below is at 2455, the lower Bollinger Band, and the EMA60 moving average at 2458. The MACD on the four-hour chart is flat above the zero axis, with alternating red and green bars, lacking sustained volume, typical of a volatile indicator pattern. The 100% Fibonacci level at 2463 has become a short-term dividing line, with the price oscillating above this level. There is no clear trend signal on the four-hour level, the risk of chasing orders is high, and the market is likely to continue oscillating within the range. A breakthrough of the box after a volume expansion is needed before opening a new round of market space.
Short-term reference:
Support from 2440 to 2400; if it holds, go long with a 40-point stop loss, aiming for 2510 to 2570.
Resistance from 2550 to 2566; if it stalls, go short with a 40-point stop loss, aiming for 2490 to 2440.
Specific operations should be based on real-time market data. For more details, you can consult the author. The release of this article may be delayed, so it is advised to use this information for reference only, and the risks are to be borne by the reader.

Warm reminder: The above content is solely created by the author of this public account; advertisements at the end of the article and in the comment section are unrelated to the author. Please identify carefully. Thank you for reading.
免责声明:本文章仅代表作者个人观点,不代表本平台的立场和观点。本文章仅供信息分享,不构成对任何人的任何投资建议。用户与作者之间的任何争议,与本平台无关。如网页中刊载的文章或图片涉及侵权,请提供相关的权利证明和身份证明发送邮件到support@aicoin.com,本平台相关工作人员将会进行核查。