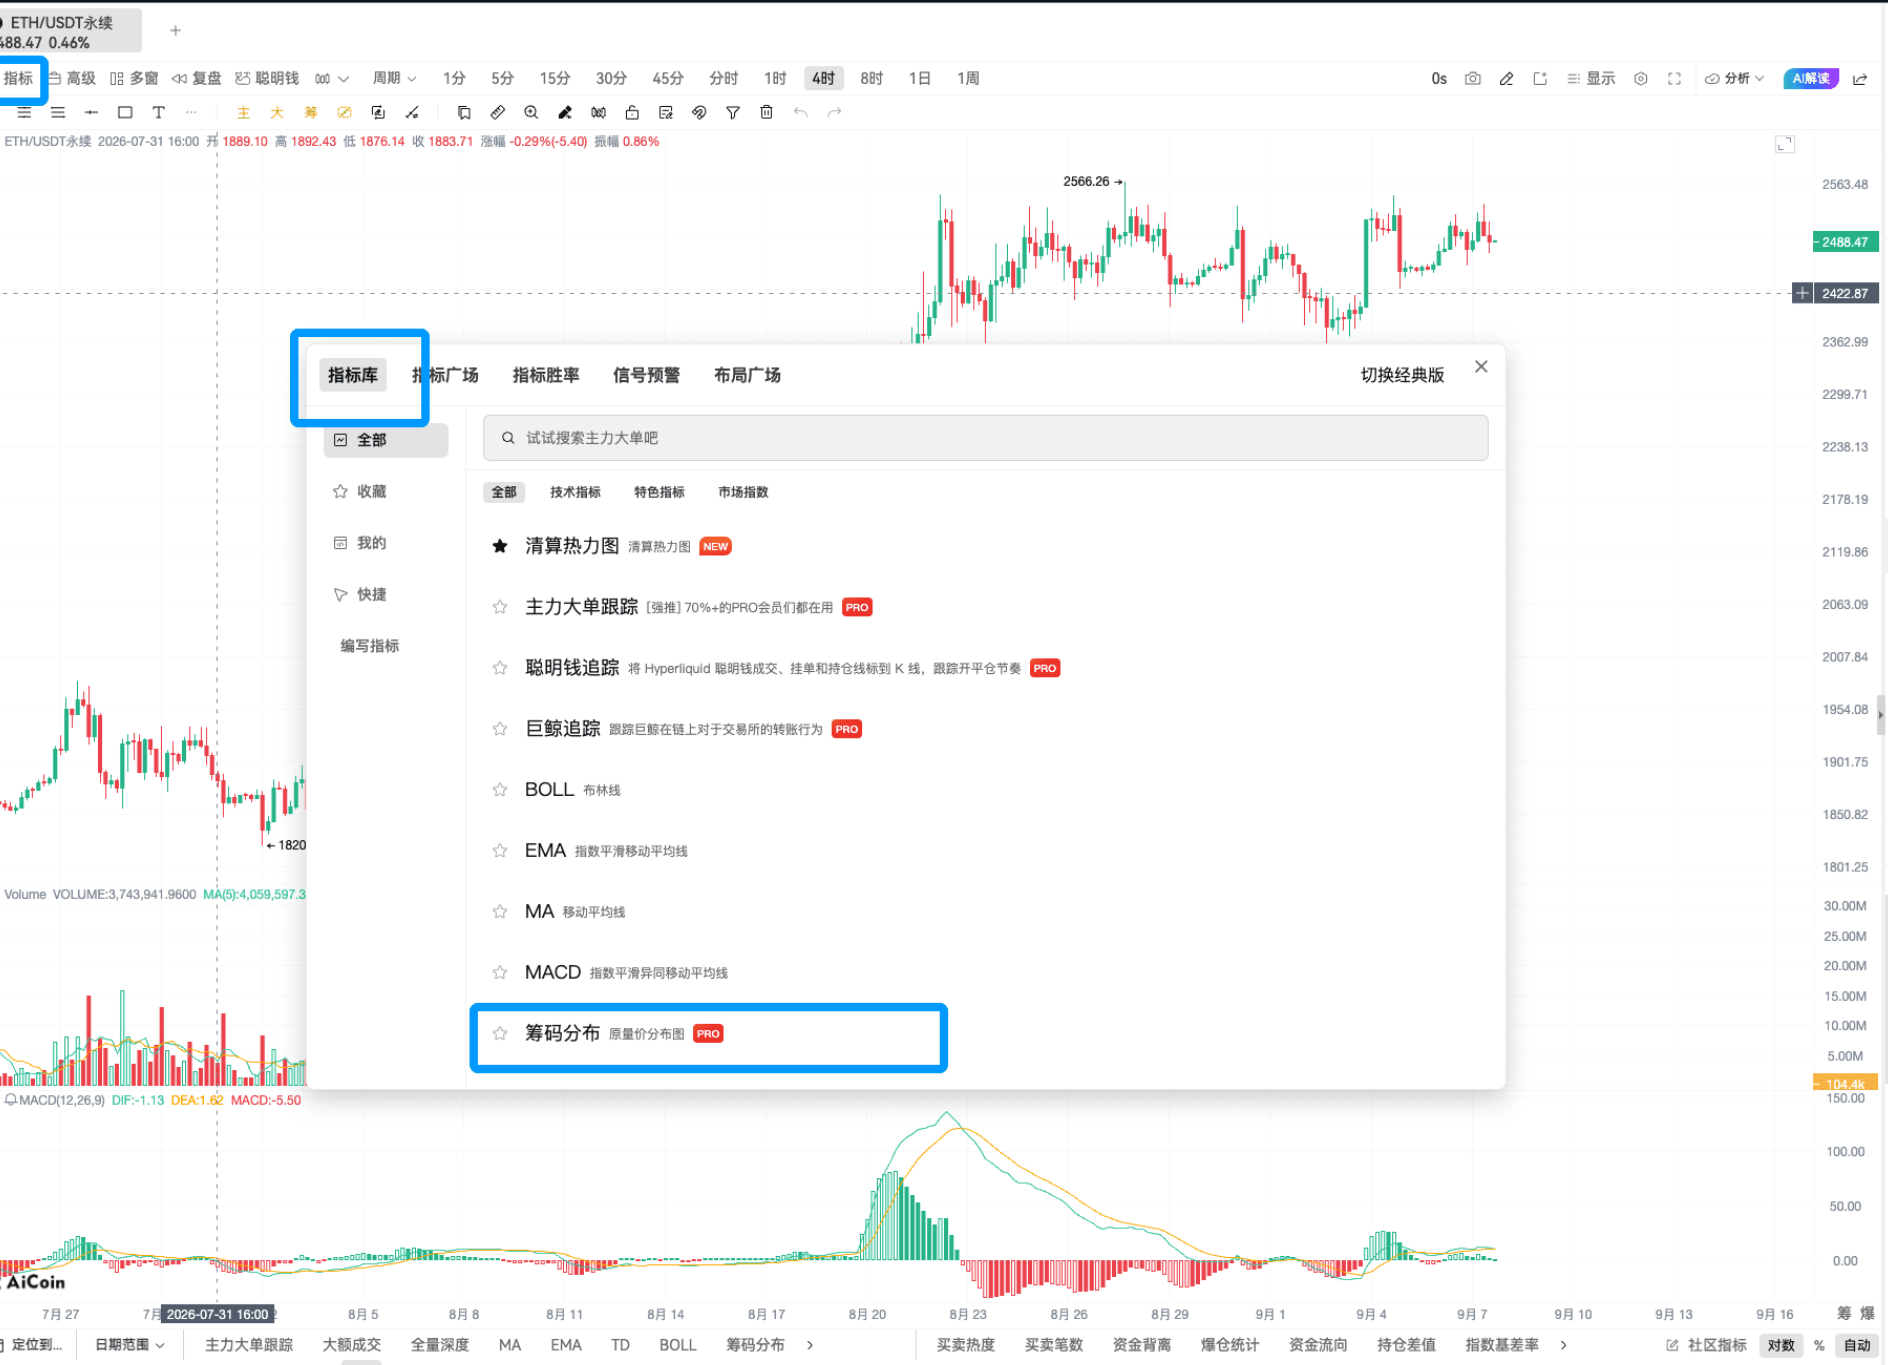
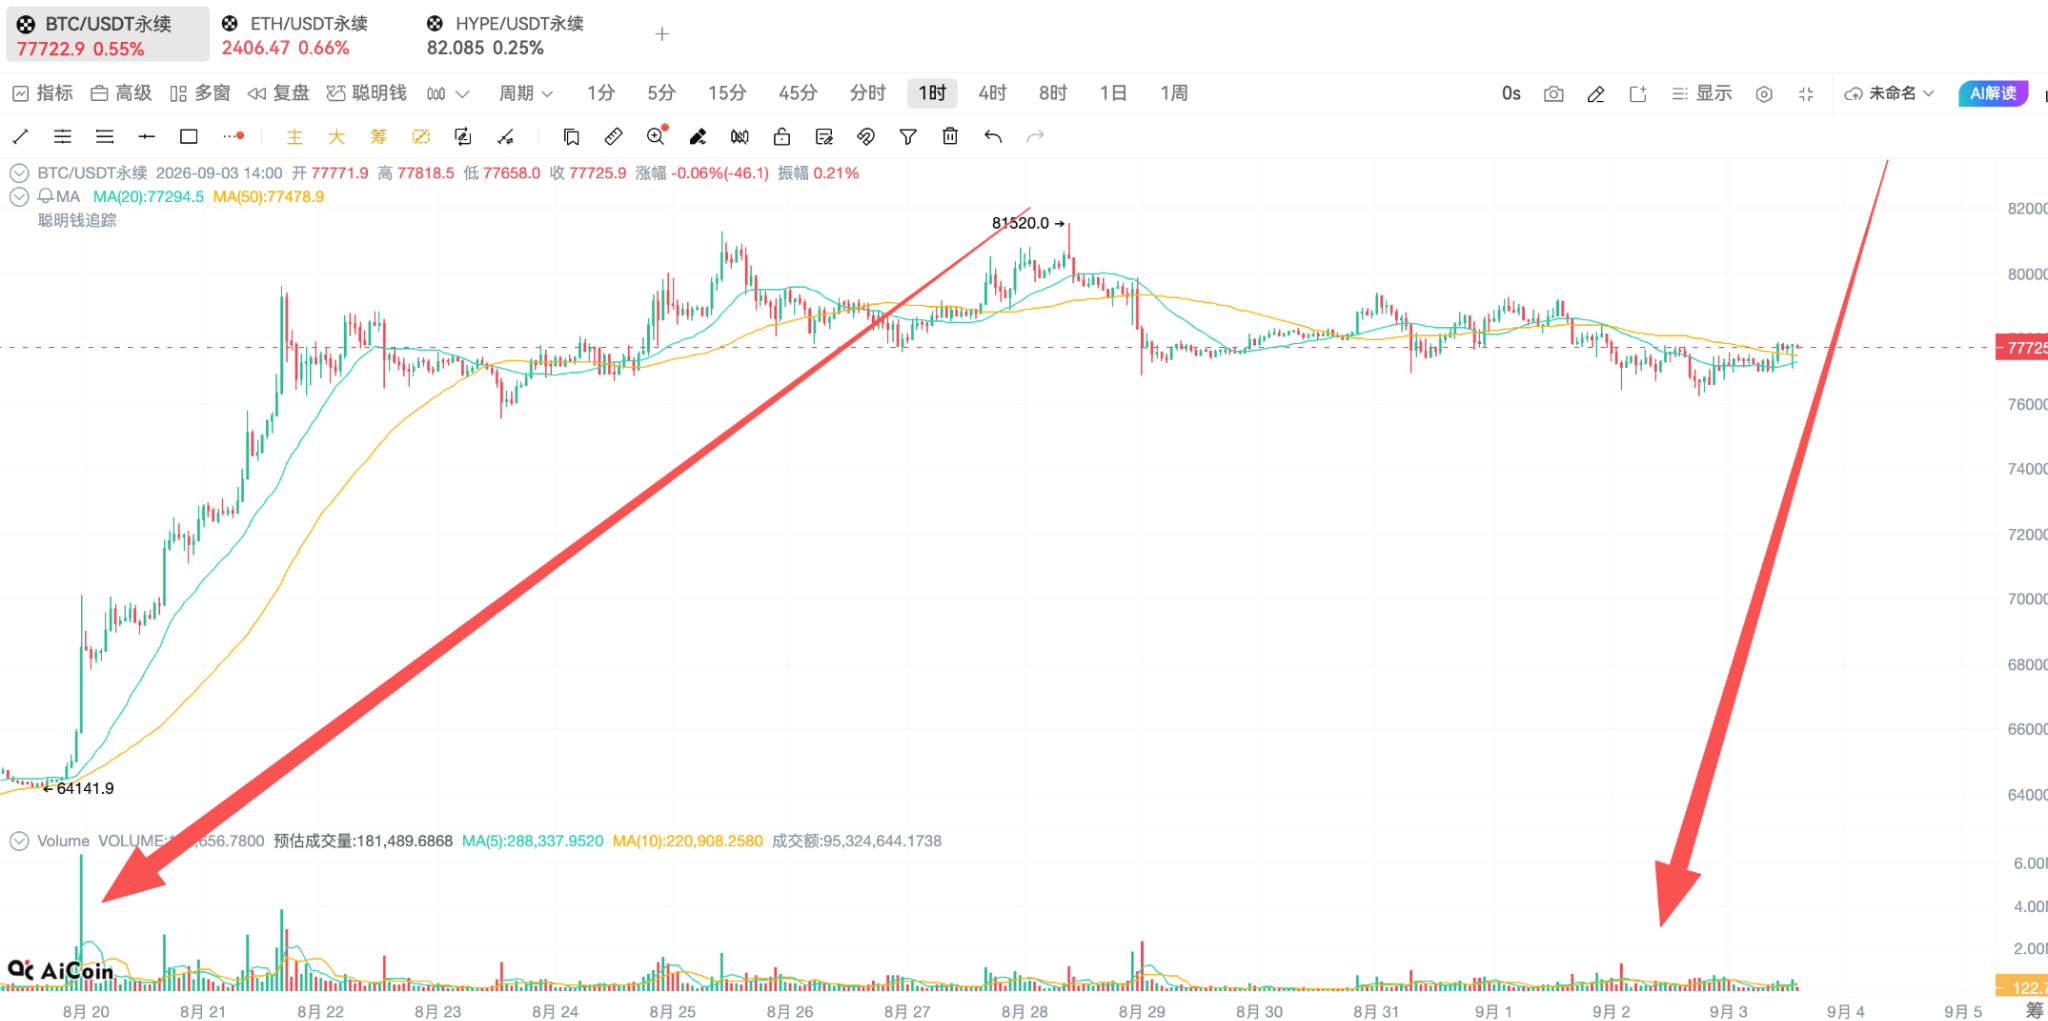
Today's technical tools I will talk about mainly support the series of pressure levels: Fibonacci, BOLL Bollinger Bands, and MA moving averages.
First, let's look at the first analysis tool: Fibonacci retracement. It’s quite coincidental that HYPE is turning back down, making this a good time to analyze using Fibonacci during the retracement.
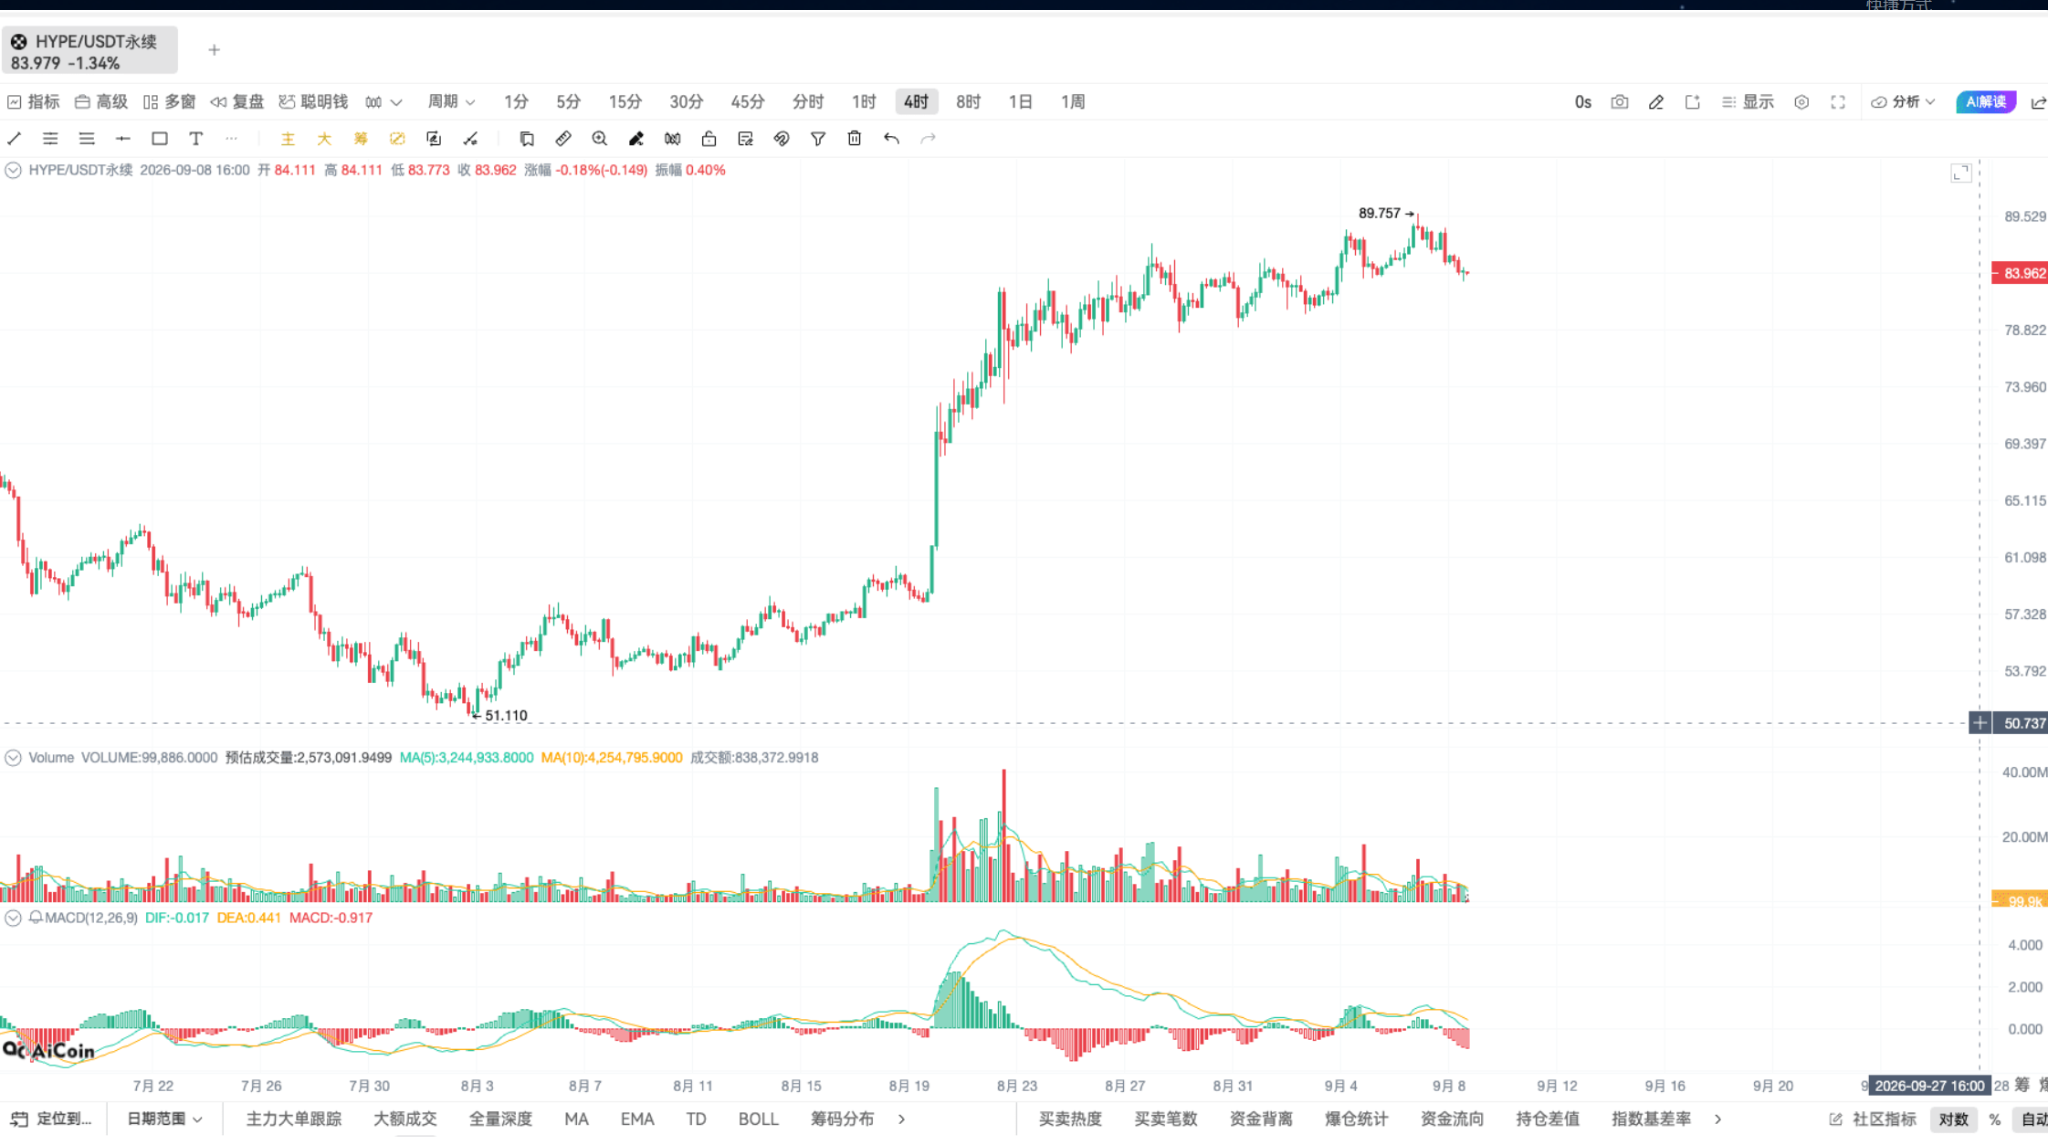
Are there many friends in the discussion area who understand Fibonacci? In fact, it's quite simple; essentially, it's the golden ratio, which is a consensus point widely accepted in the market. It's marked here for everyone.
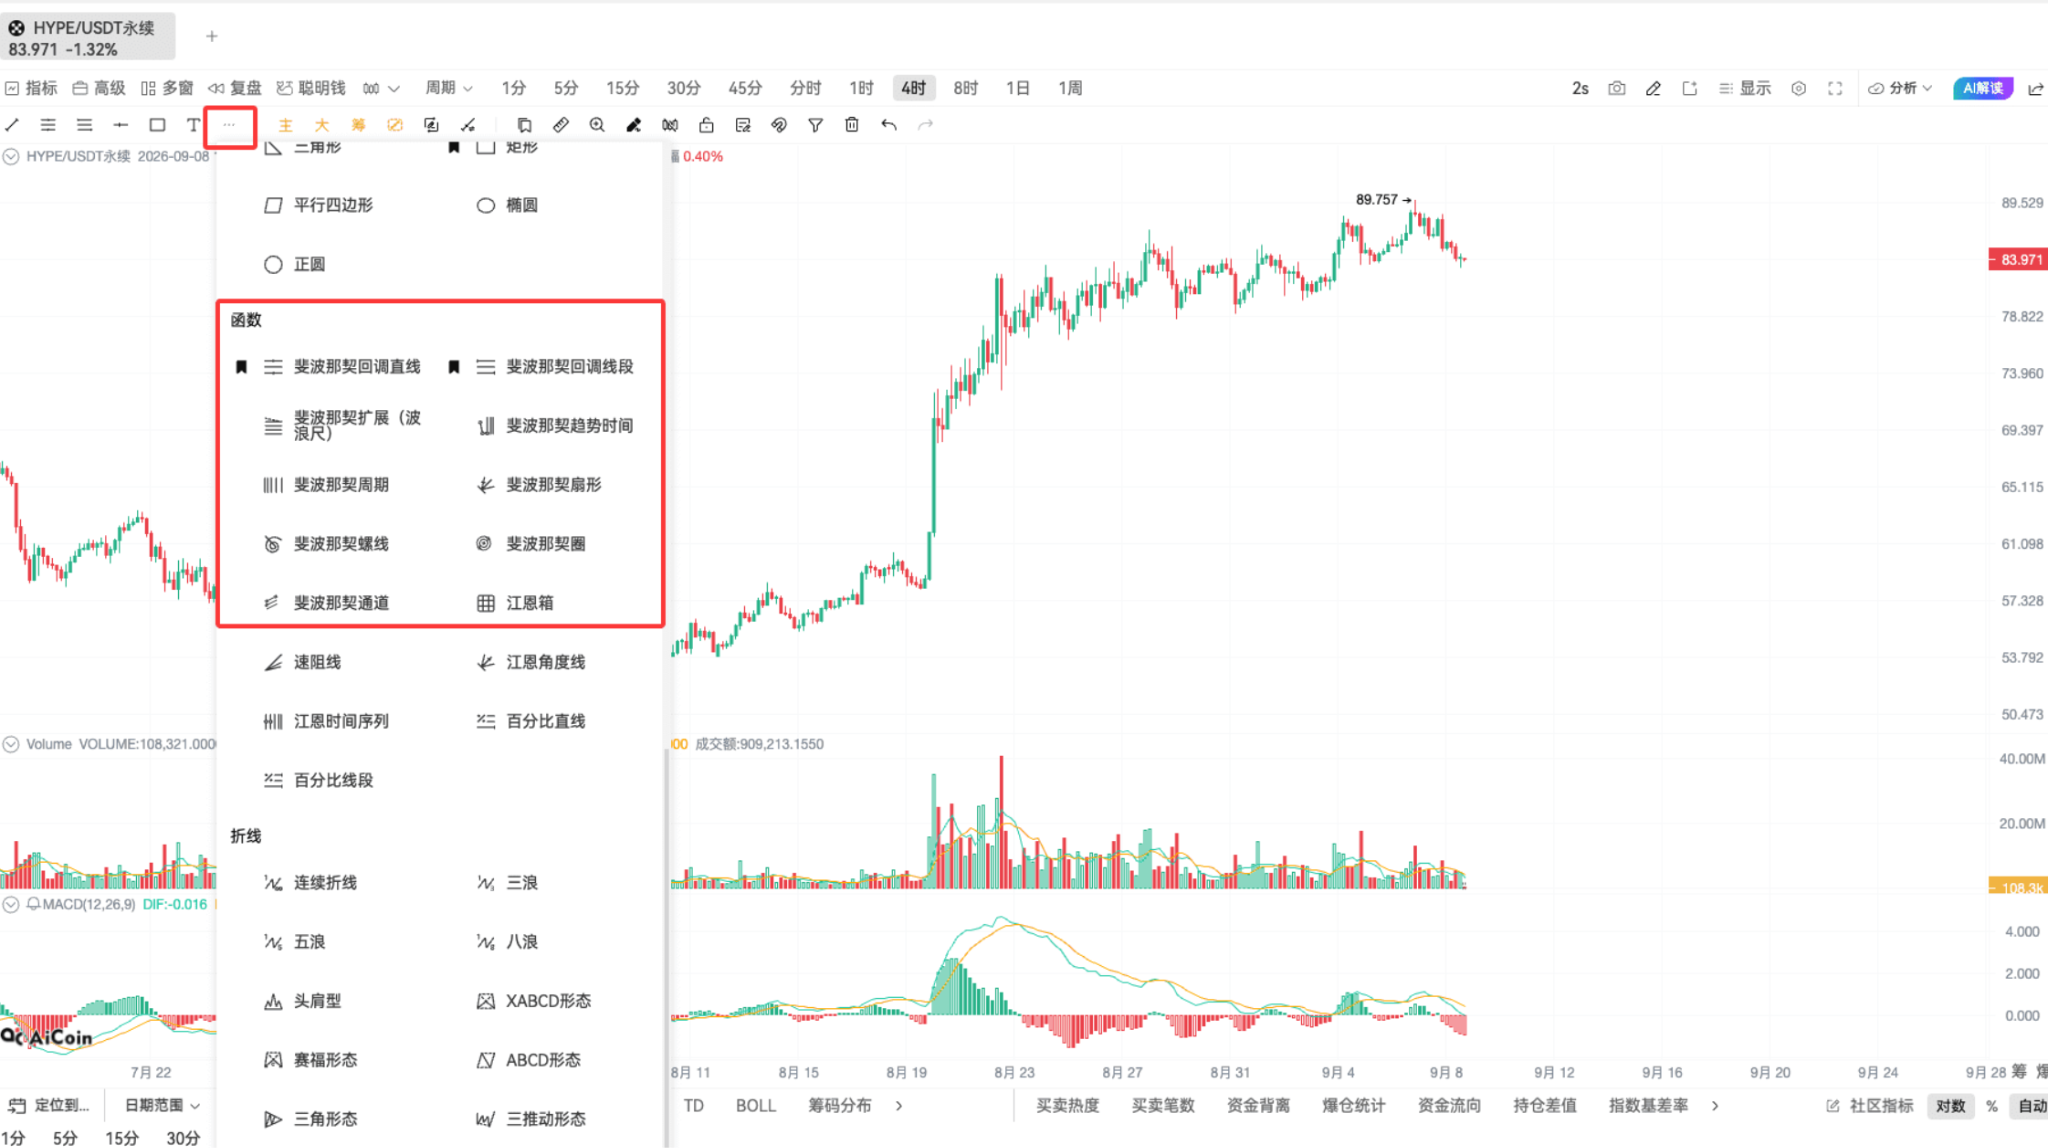
Fibonacci retracement primarily focuses on buying opportunities during the retracement process. This time is no different; we’ll directly bring up the Fibonacci retracement tool and use it, keep up with my pace.
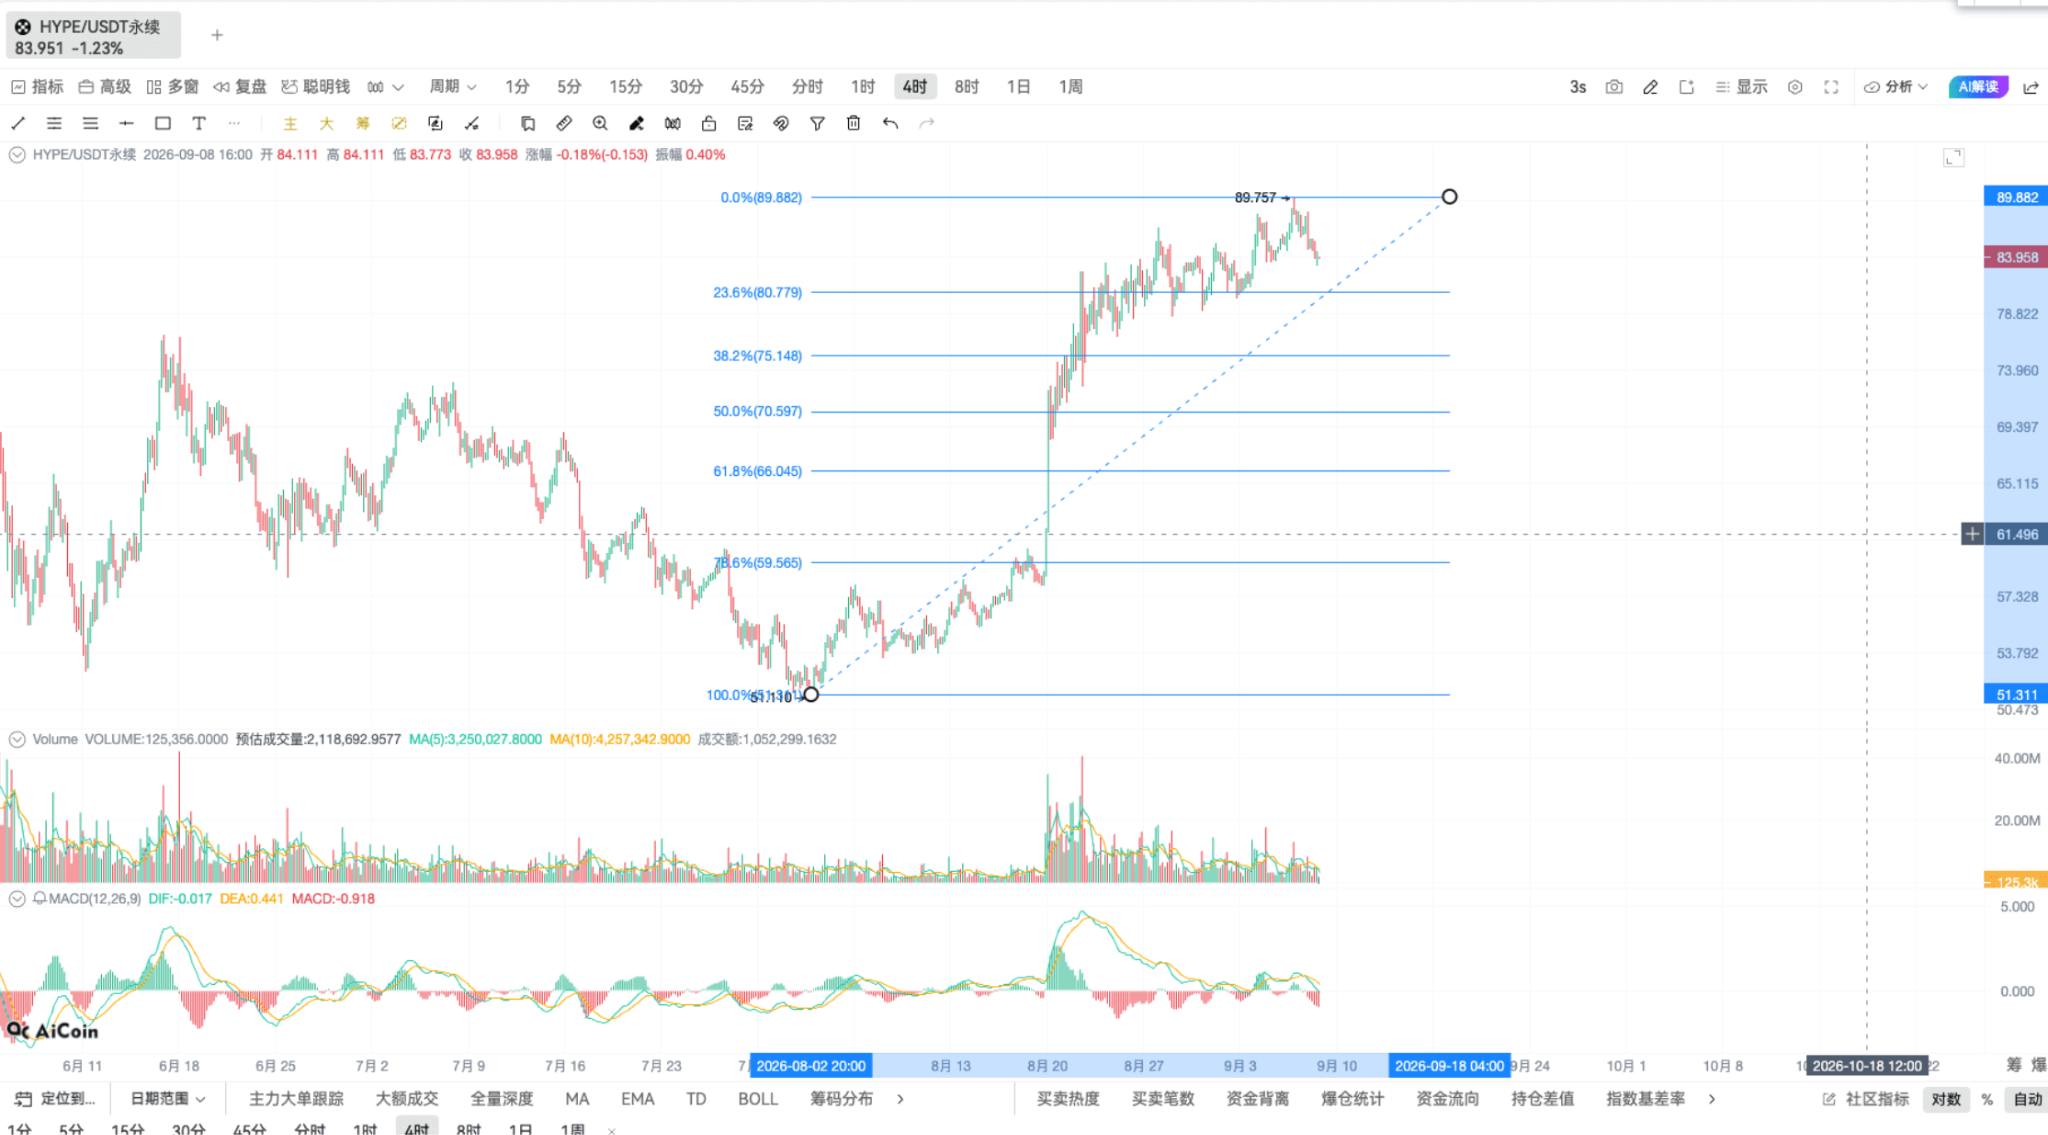
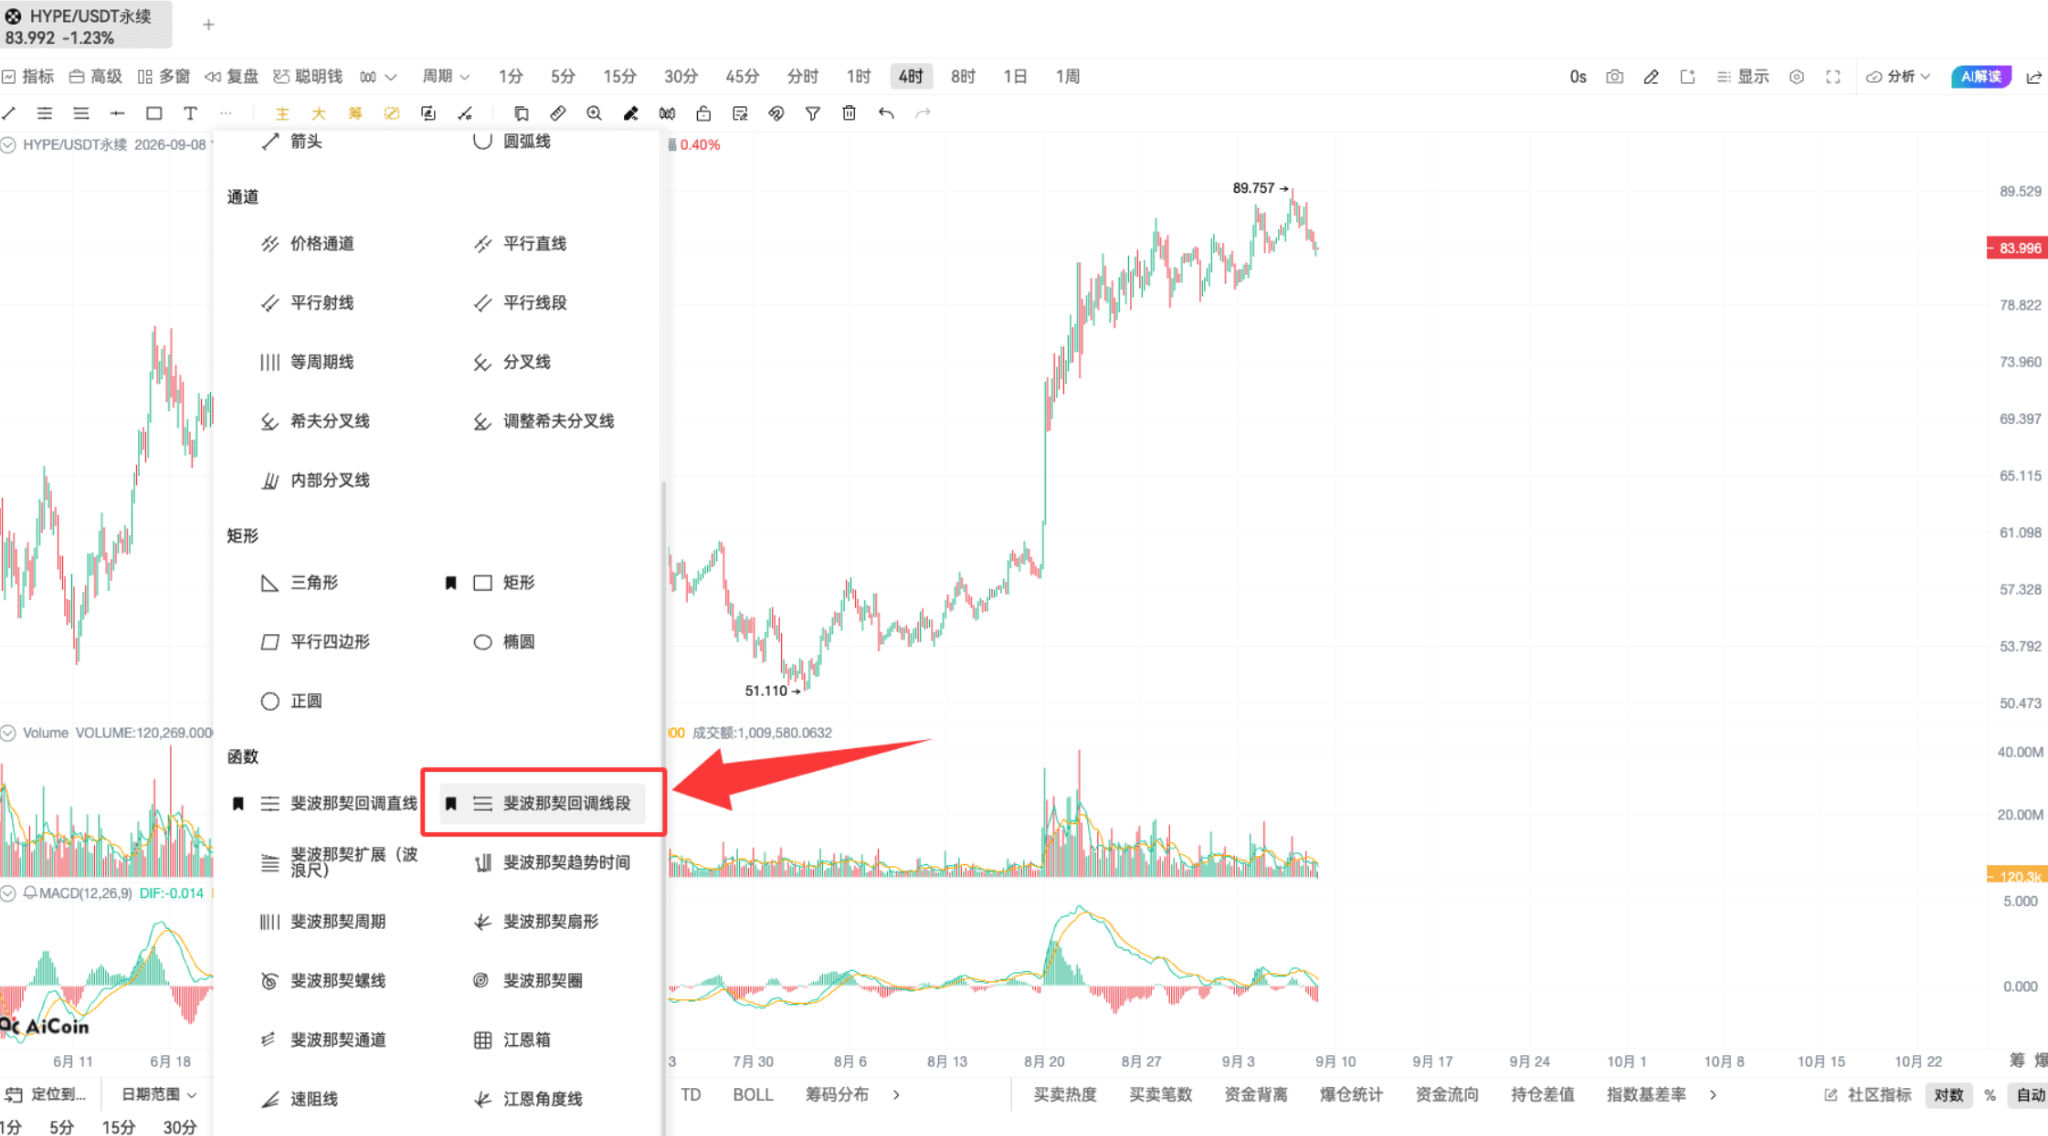
From Fibonacci's perspective, HYPE has not yet retraced adequately; the strong support levels at 0.236 and 0.382 are still a bit distant from the current price. If it's a healthy retracement, stabilizing at these levels and producing buying signals would be a very comfortable entry point, which can also be referred to as the best entry point.
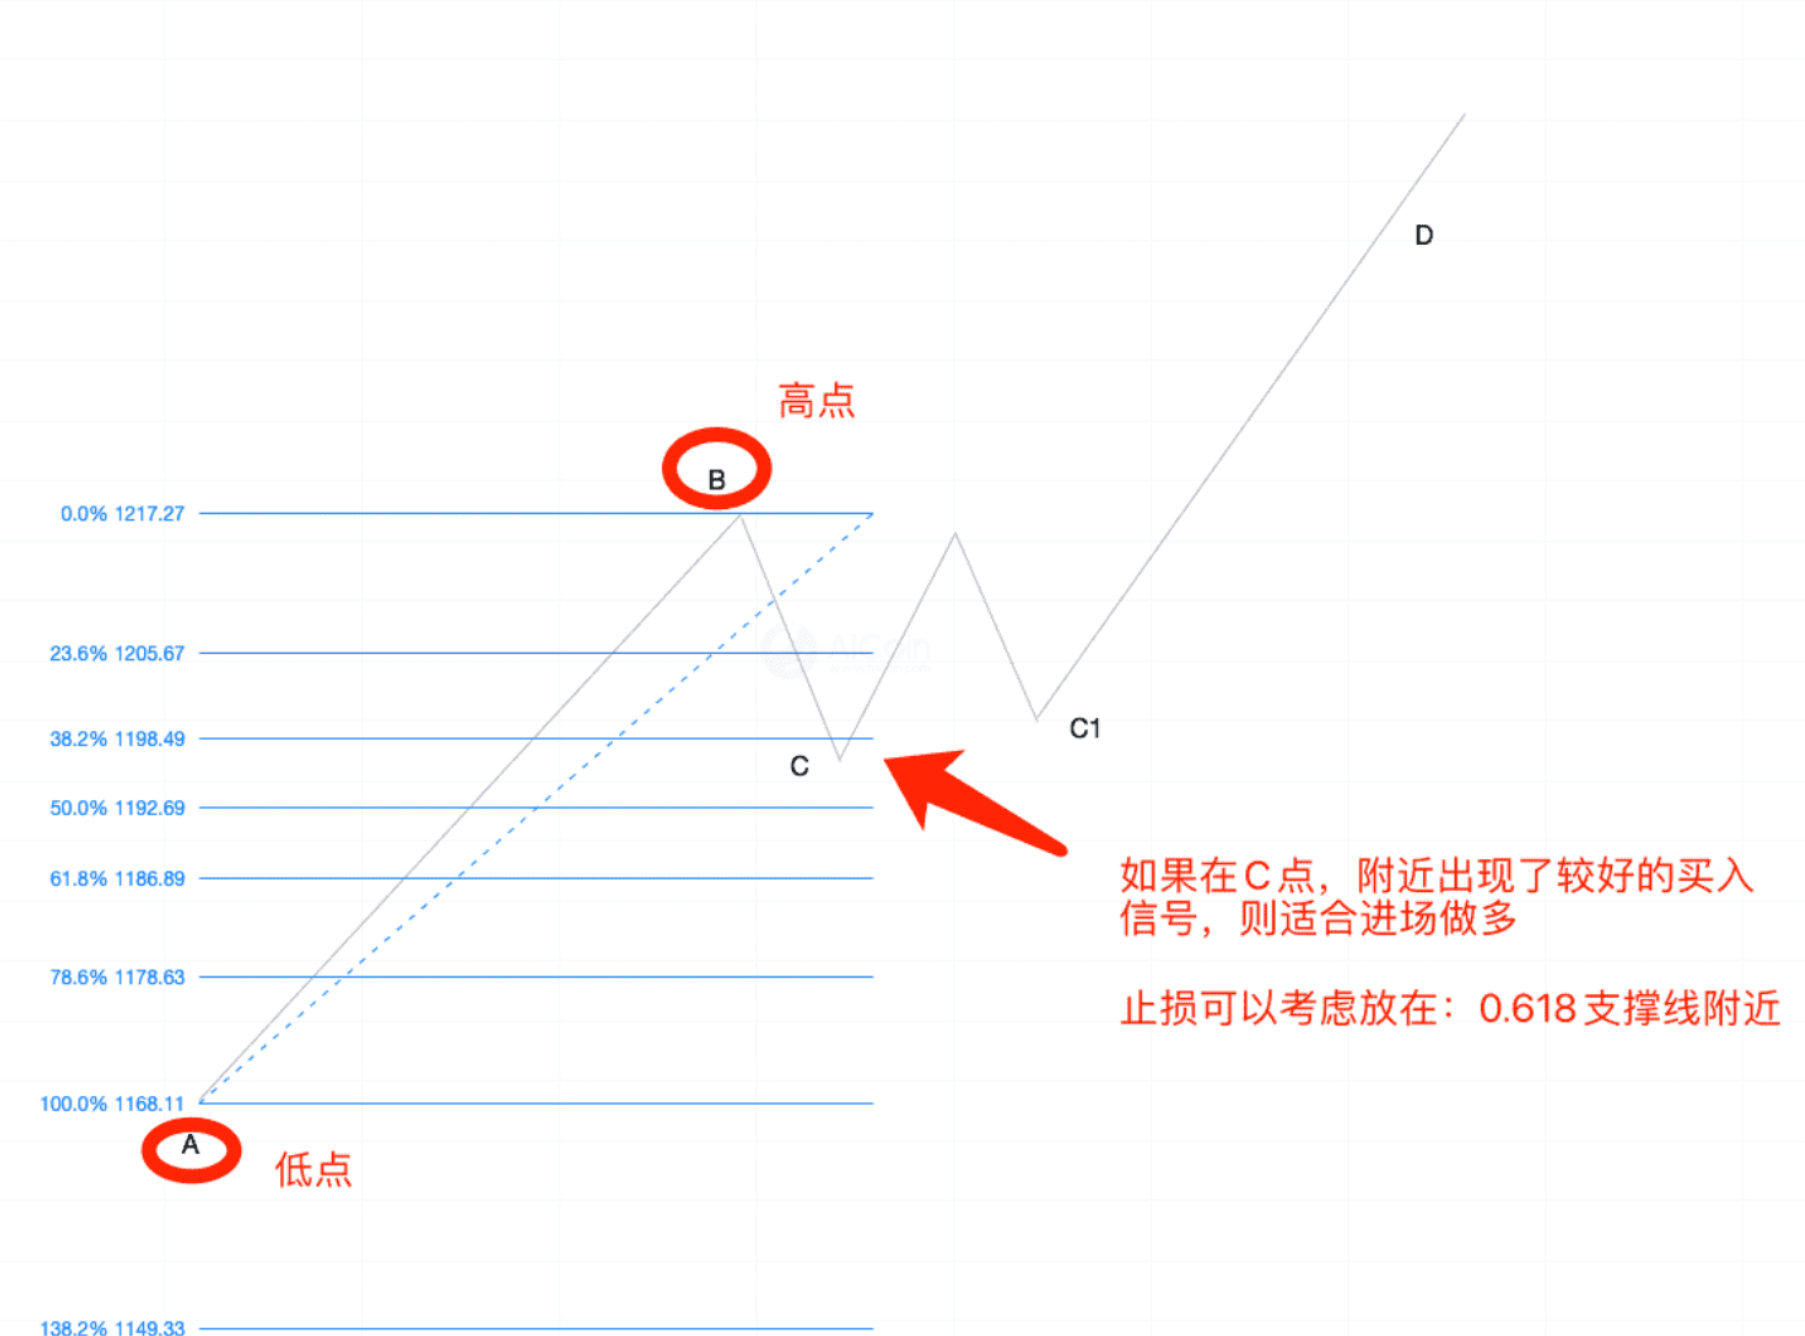
Here, let me briefly explain how to draw and interpret Fibonacci. Its purpose is very clear: to find support and resistance. The method is also not complicated: select the highest and lowest points of a certain price trend and draw a line. Every time I mention this, someone asks: how to choose the high and low points? My typical answer is: just use the high and low points of the price trend you’re observing. Personally, I recommend using the highs and lows of the shadows — incorporating both upper and lower shadows; others may only use the high and low points of the candlestick bodies, both are valid, but I often use shadows more. The definition of high and low points is straightforward: observe the price trend you are looking at, from which low point it starts to rise and at which position it begins the retracement, these high and low points are the two ends you draw the line between. Here’s an illustrative image for better understanding.
Returning to HYPE's real-time market. I chose the low point around August 2; this price trend started from here and rose to the recent high before beginning its retracement.
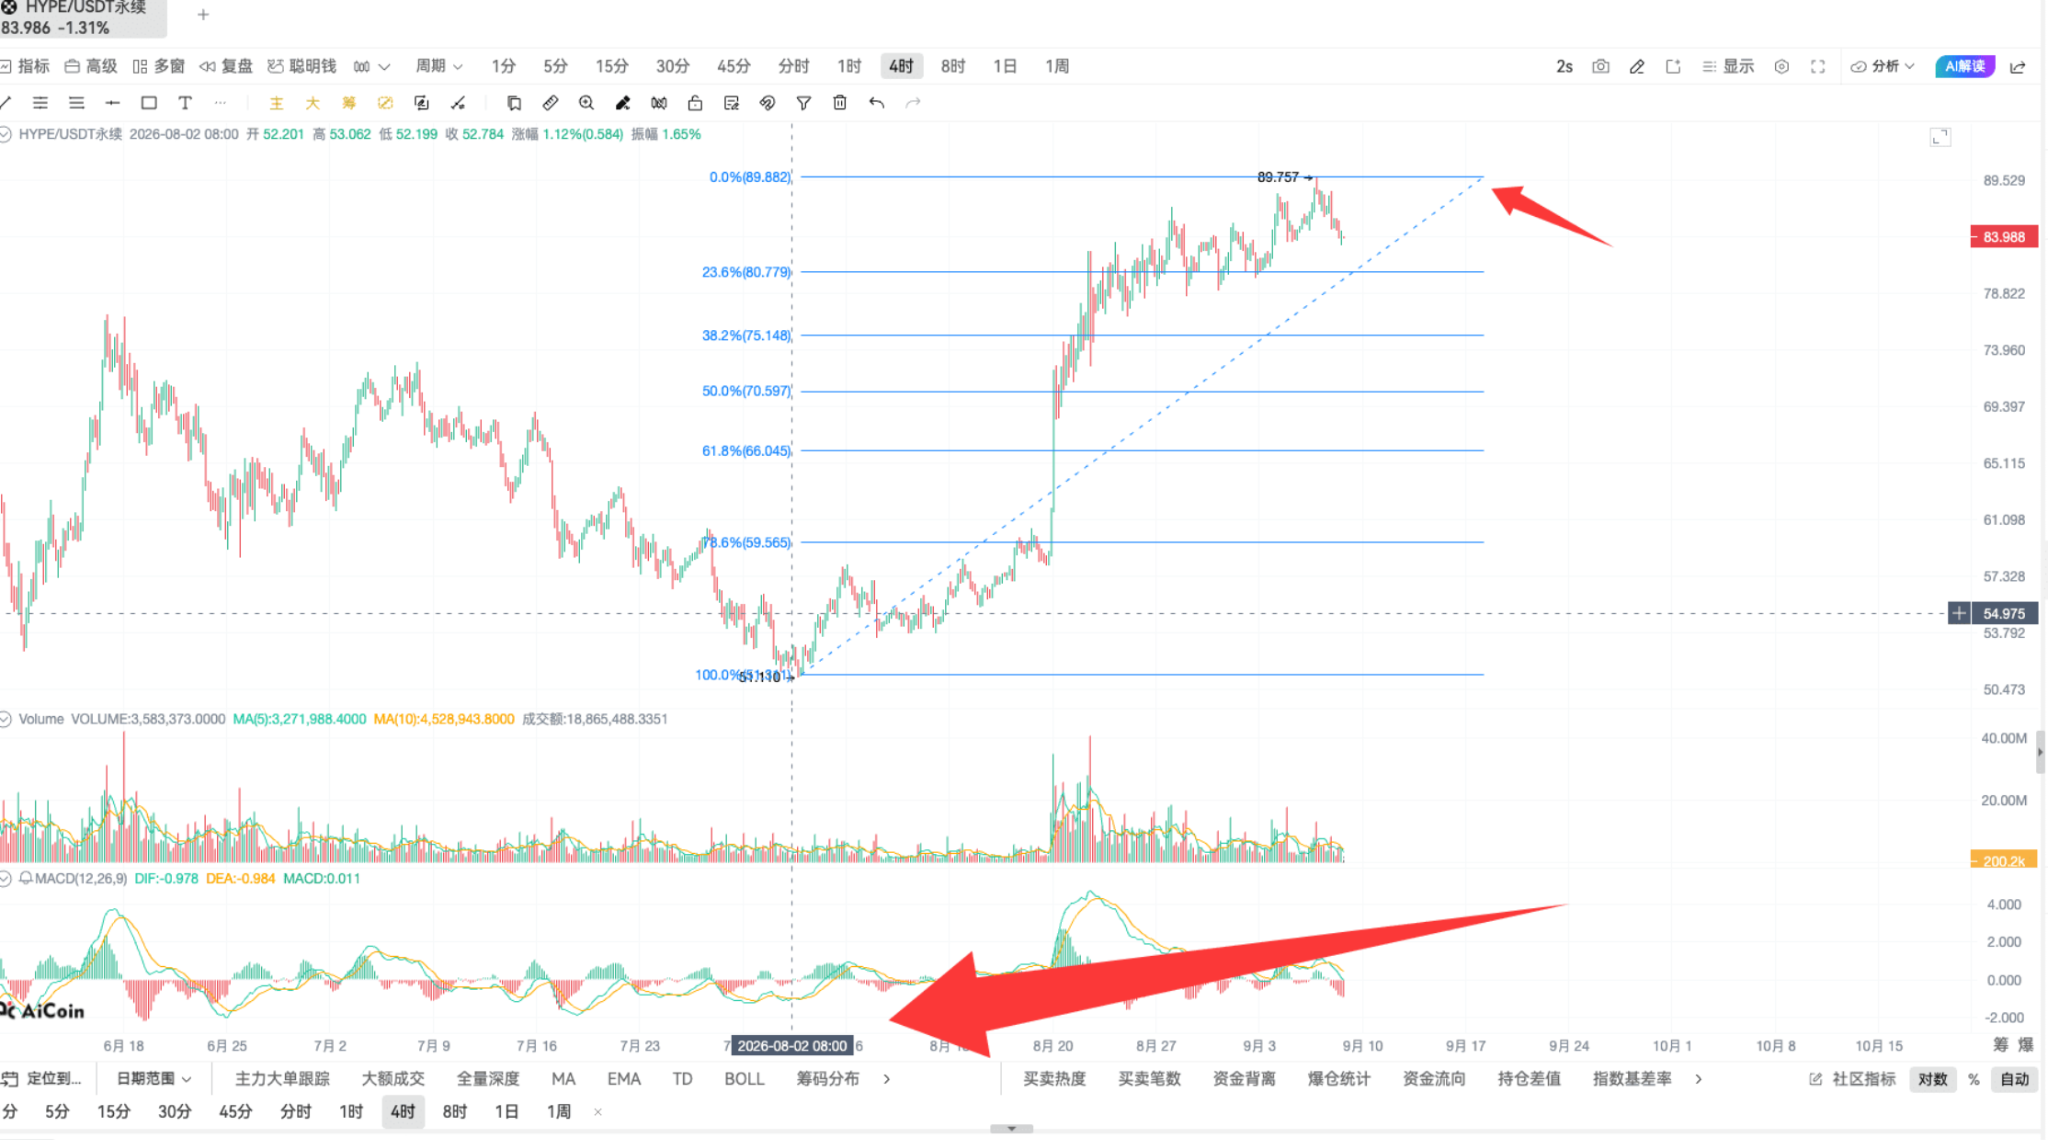
So, what will HYPE do next? Here’s a reference idea. The MACD has already shown a minor divergence, and a retracement is likely; the market needs to digest some of this movement.
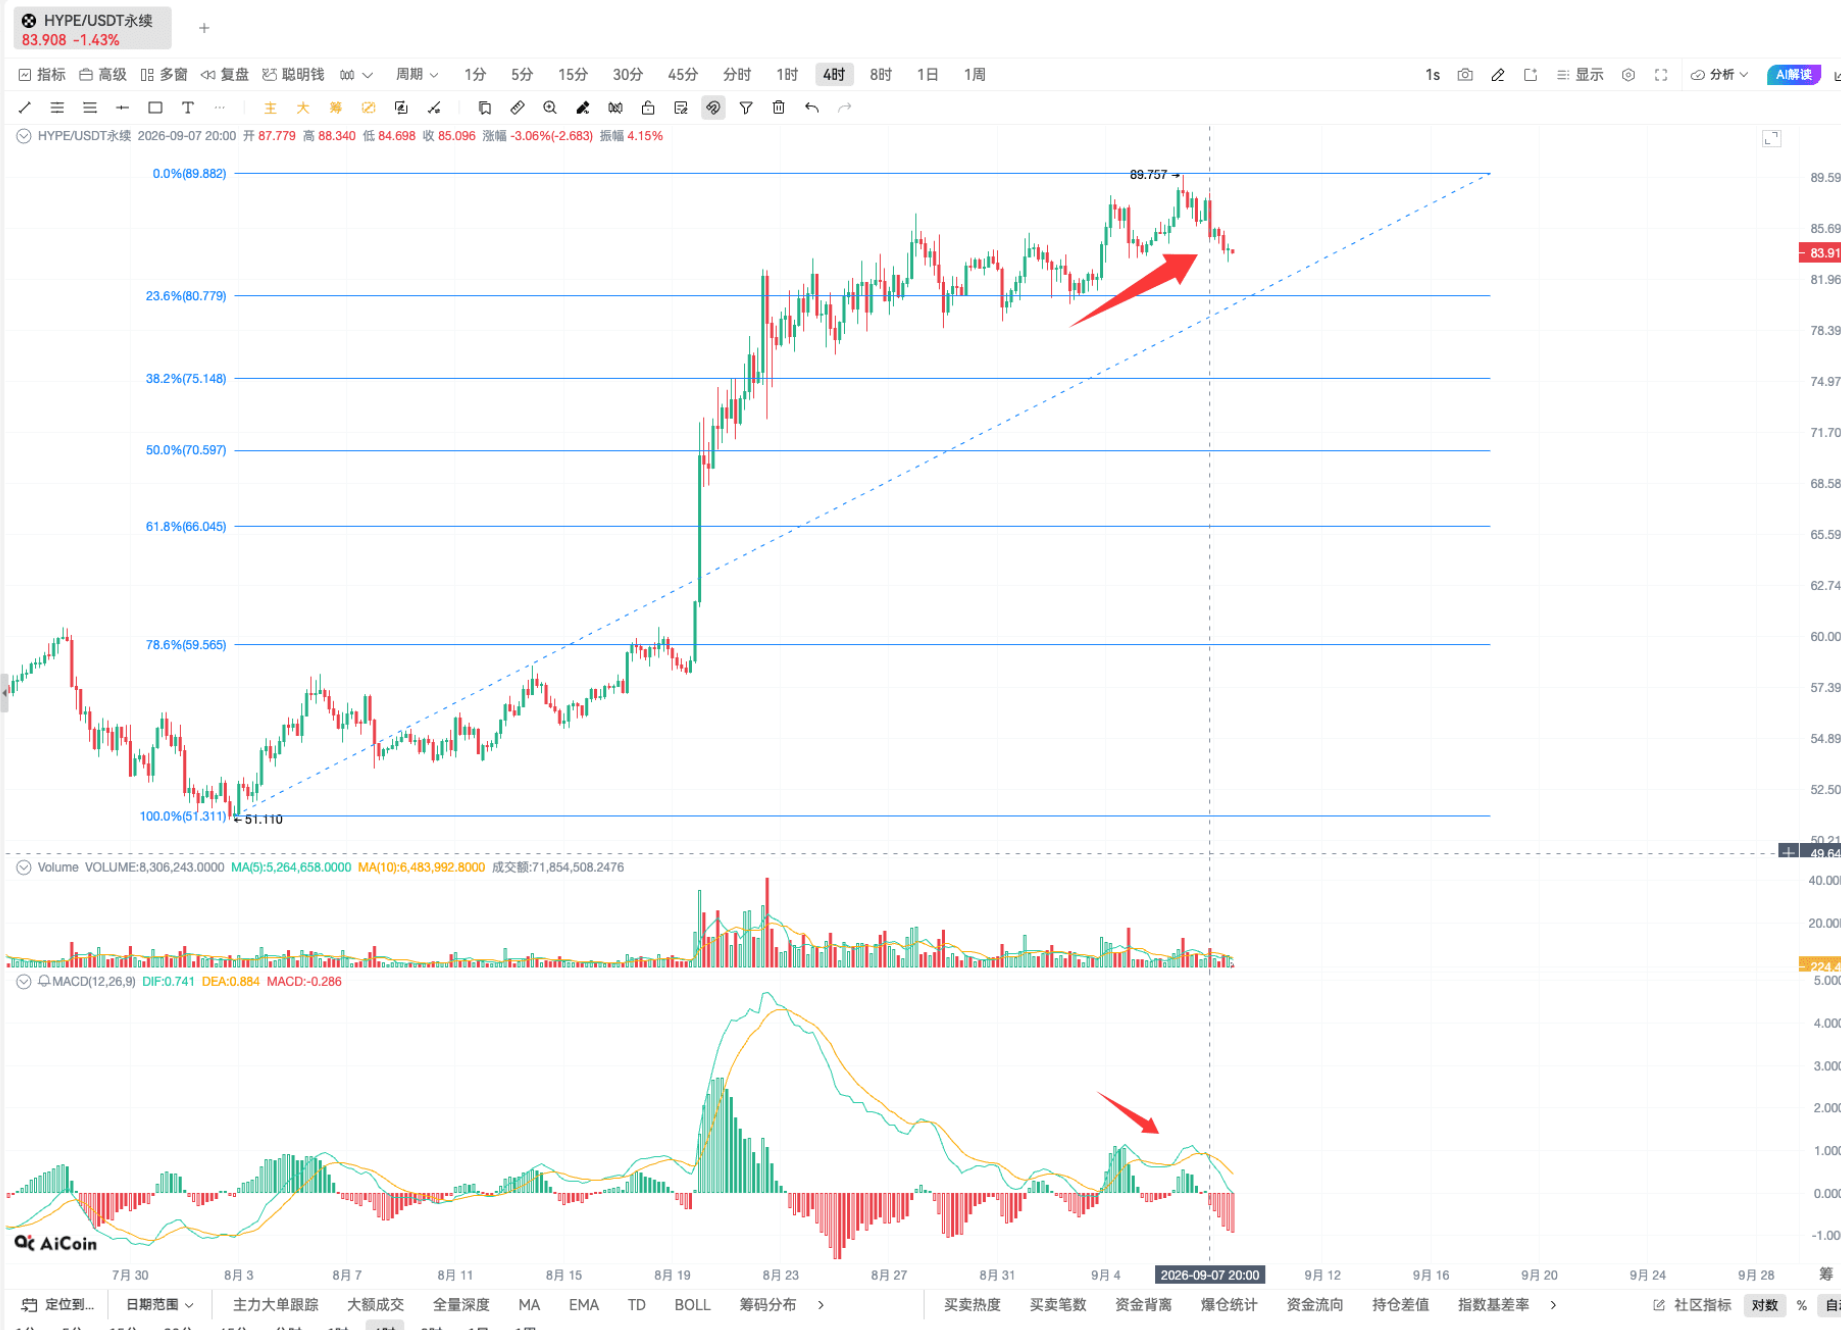
Focus on the two key support levels at 0.236 and 0.382, and see if any buying signal appears after stabilizing. If there's a signal, enter the market with a stop loss placed near 0.618, which has consensus points as a safety net and a clear stop loss level, offering a well-defined risk-reward ratio.
This is how Fibonacci retracement is used. It can only help you locate where strong support exists; real buying signals must be combined with other indicators like MACD, EMA, TD, or even your own trading system. I have always believed that in technical investing, mastering Fibonacci retracement is an essential tool, especially because it’s easy to grasp — you can learn it by watching a few live sessions. Drawing lines at the high and low points gives you a clear picture of the support and resistance across the market. That’s all for Fibonacci, okay? Let’s keep it concise today, unlike yesterday's lengthy discussion, where it took an hour just to cover one indicator, this serves as an introduction.
Next, let's talk about BOLL, also known as Bollinger Bands, which provide particularly useful support and resistance levels, especially friendly for those who do not understand price channels or candlestick patterns. As mentioned yesterday, ETH is an important link in the Robinhood profit chain; as long as US stocks are linked and Robinhood's strategies continue, opportunities for ETH to rise remain.
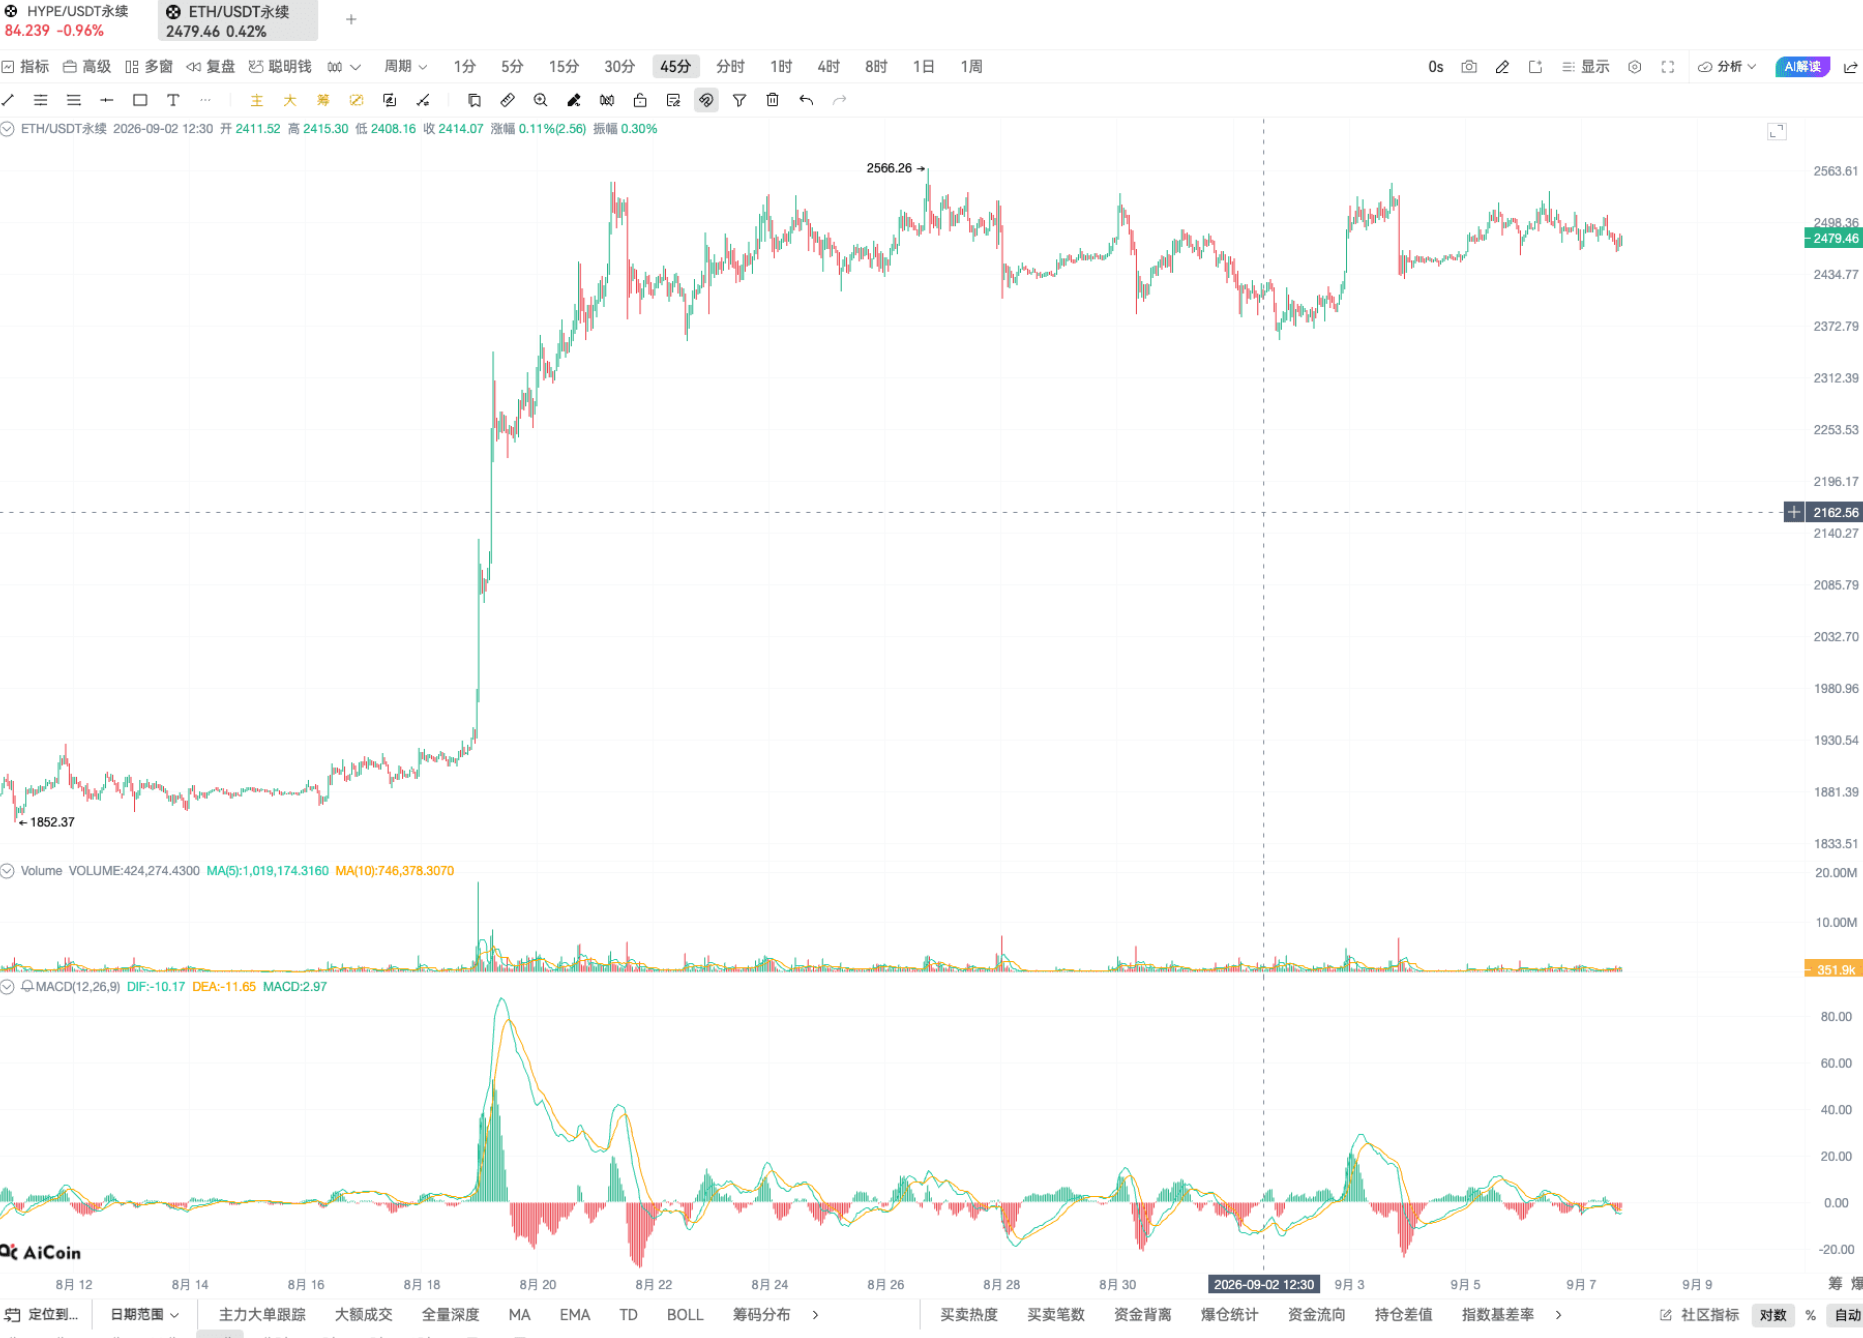
Now, let’s add the BOLL indicator and put a technical analysis overlay on ETH's naked candlestick chart.
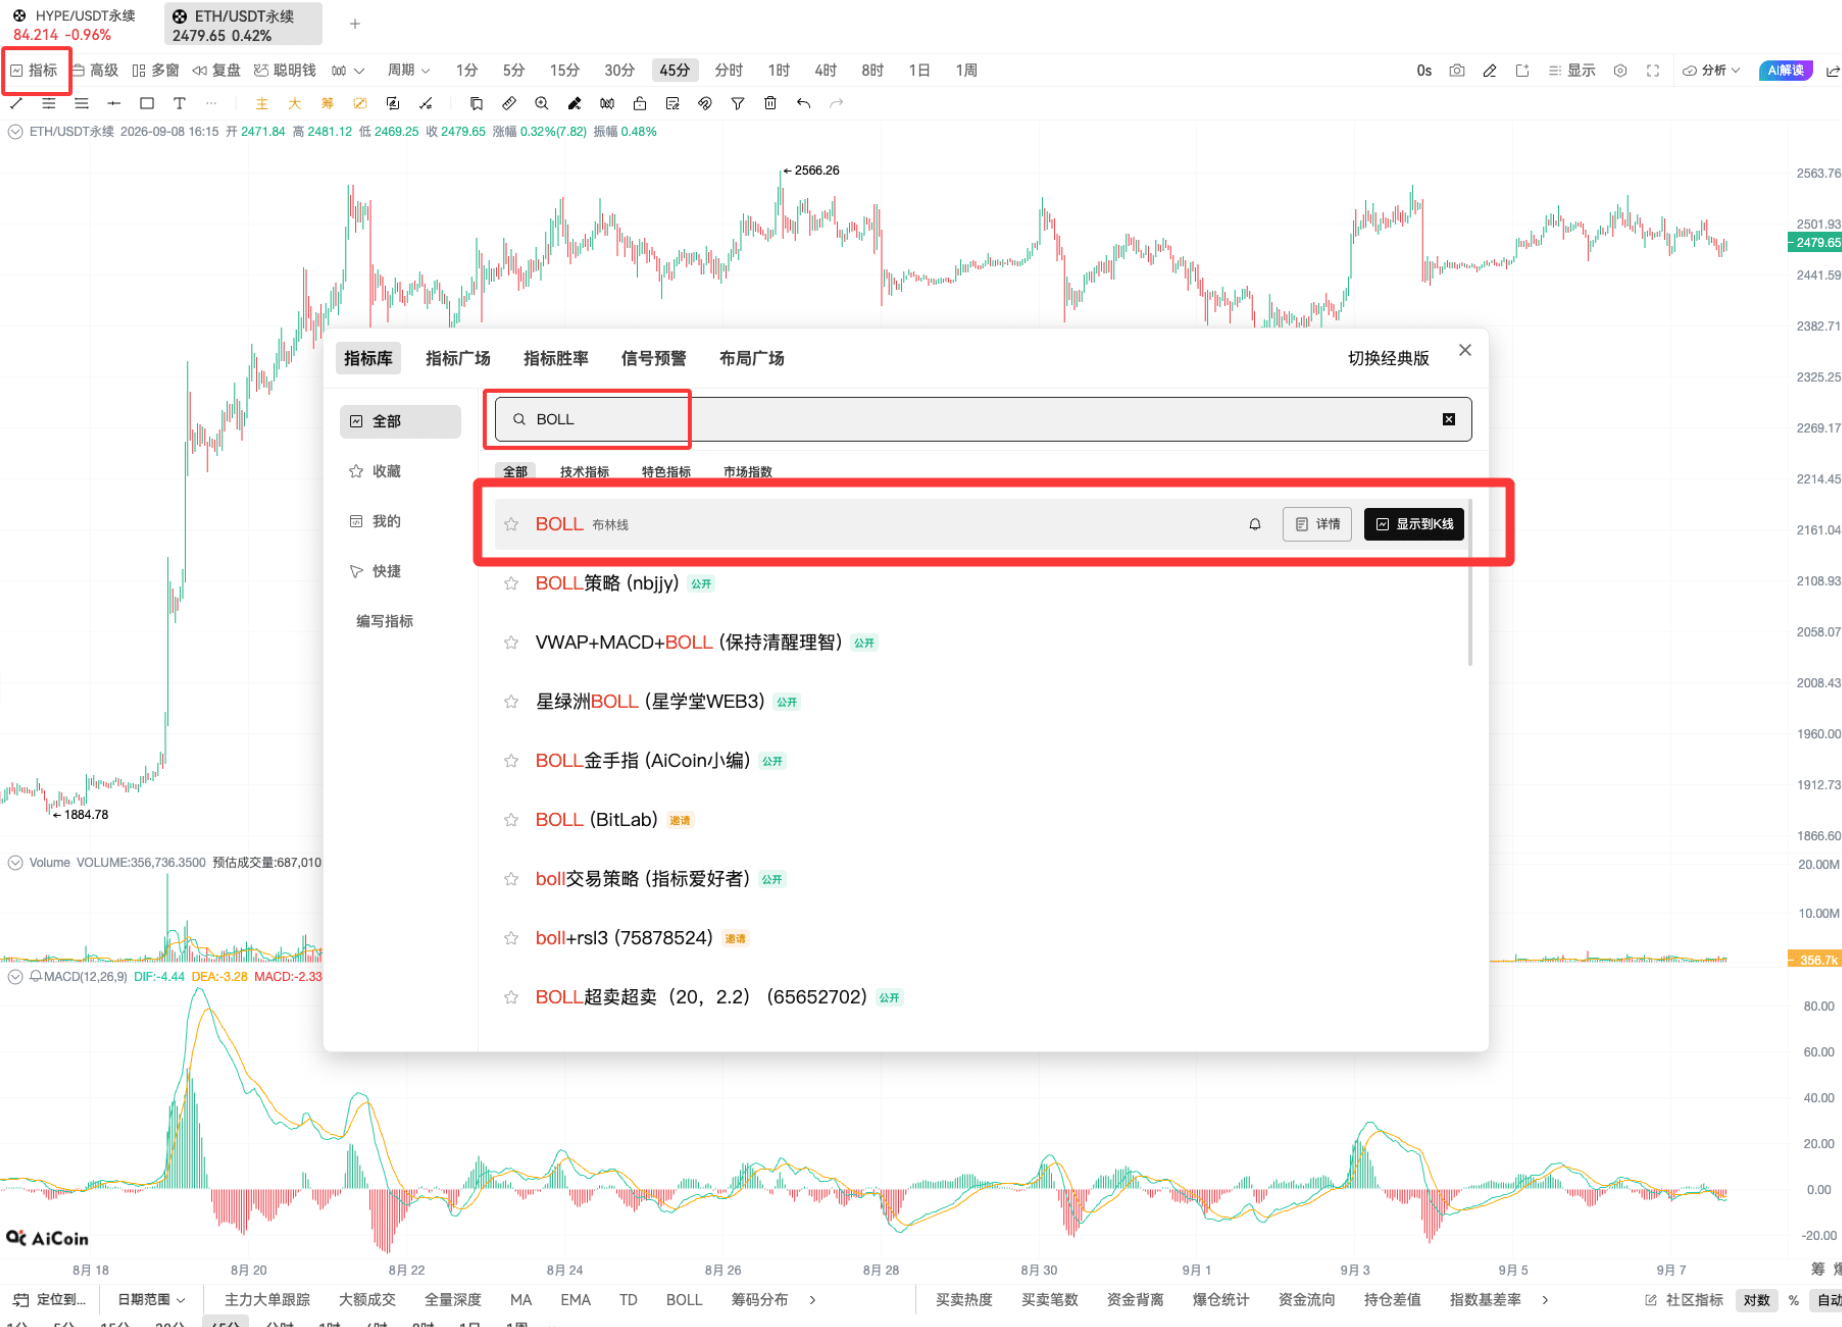
The effect after adding BOLL looks like this.
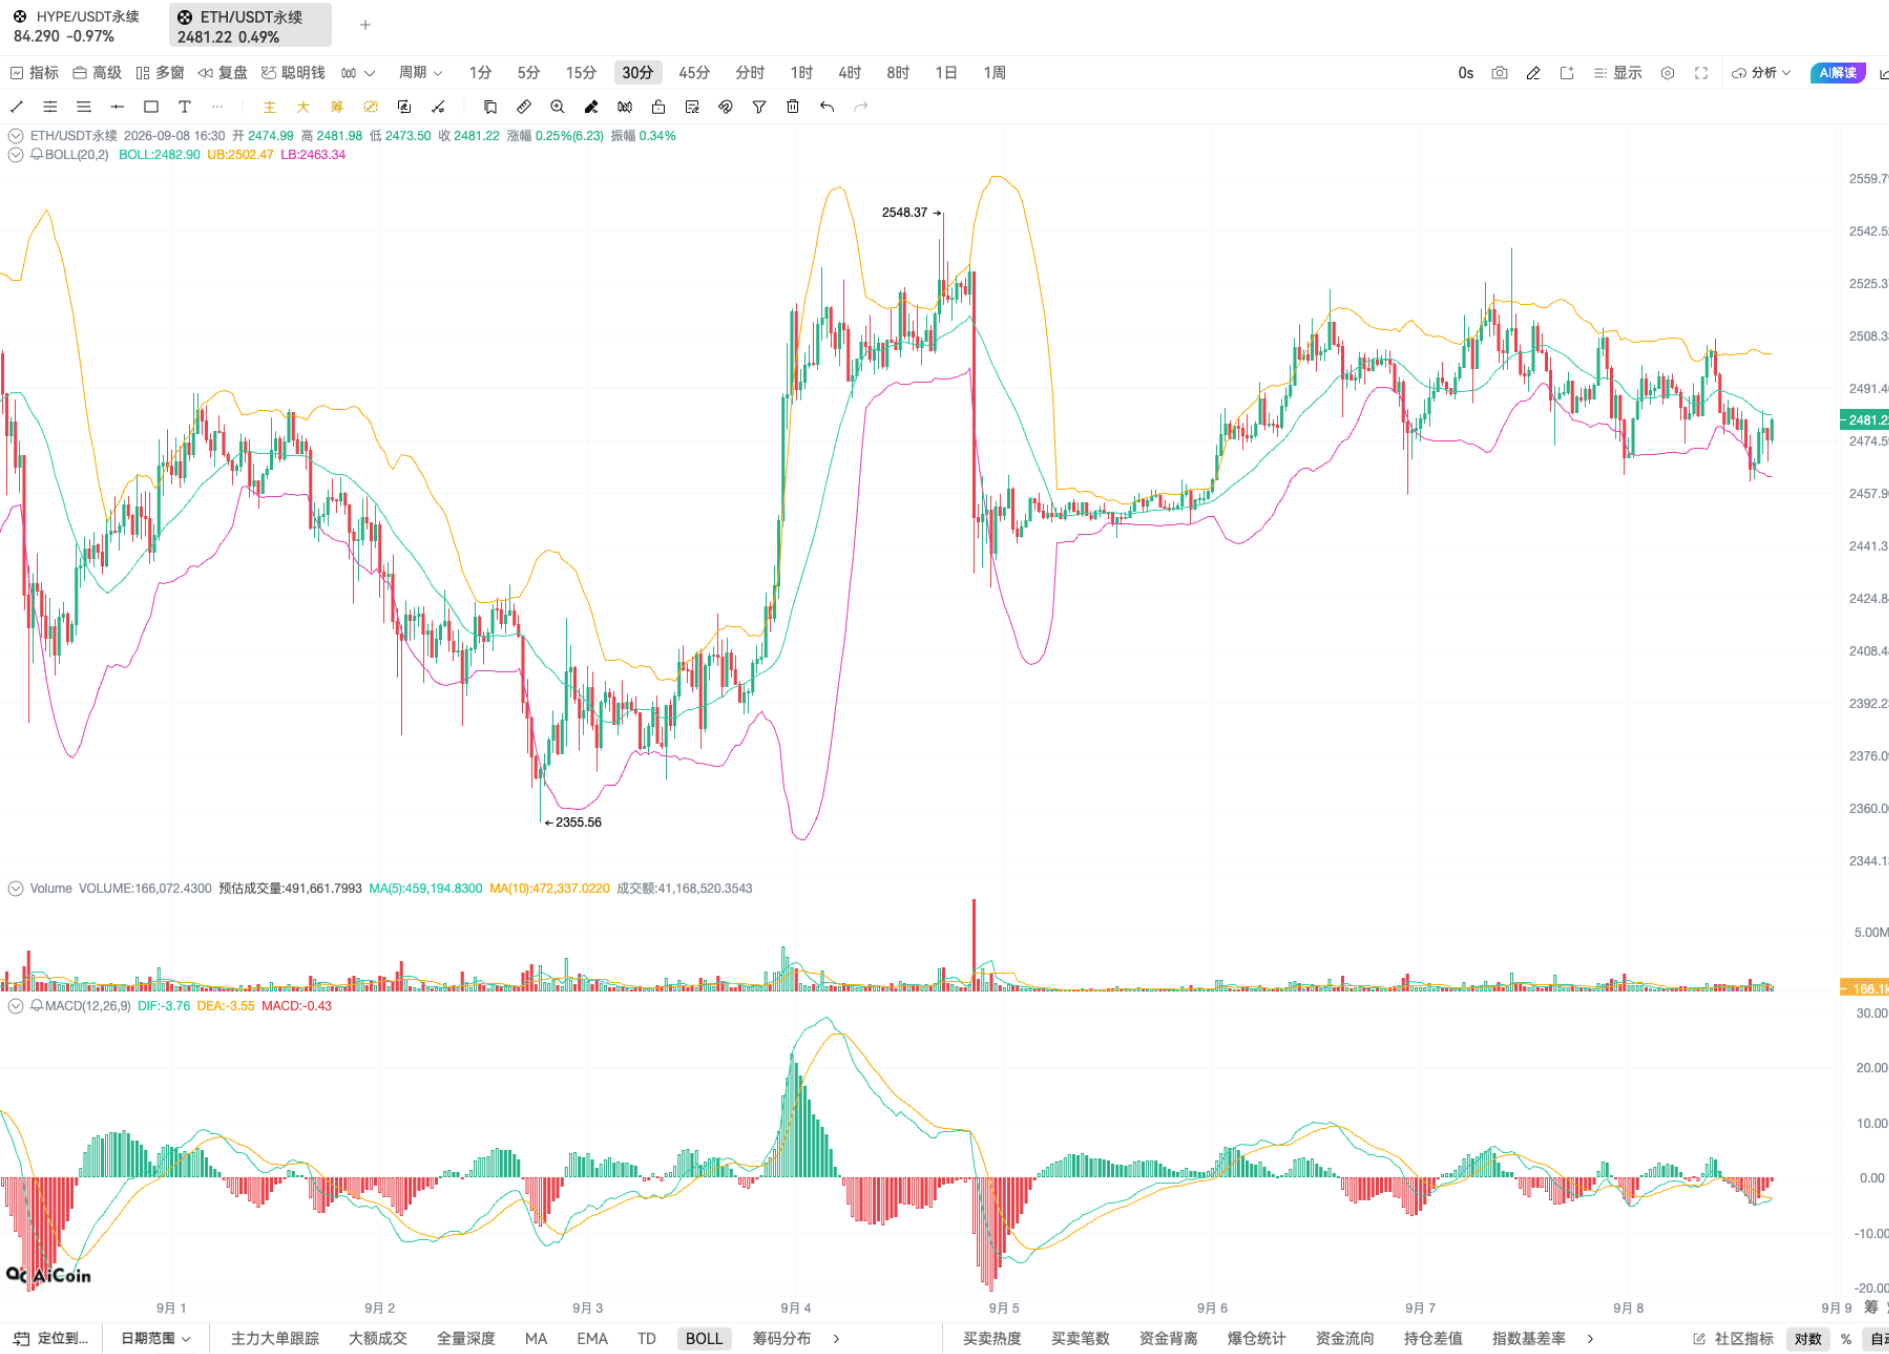
Let me briefly explain what these three lines represent. The Bollinger Bands consist of three curves: the upper band, the middle band, and the lower band. The area between the upper and lower bands forms the price movement channel, while the middle band serves as the central axis of price fluctuations.
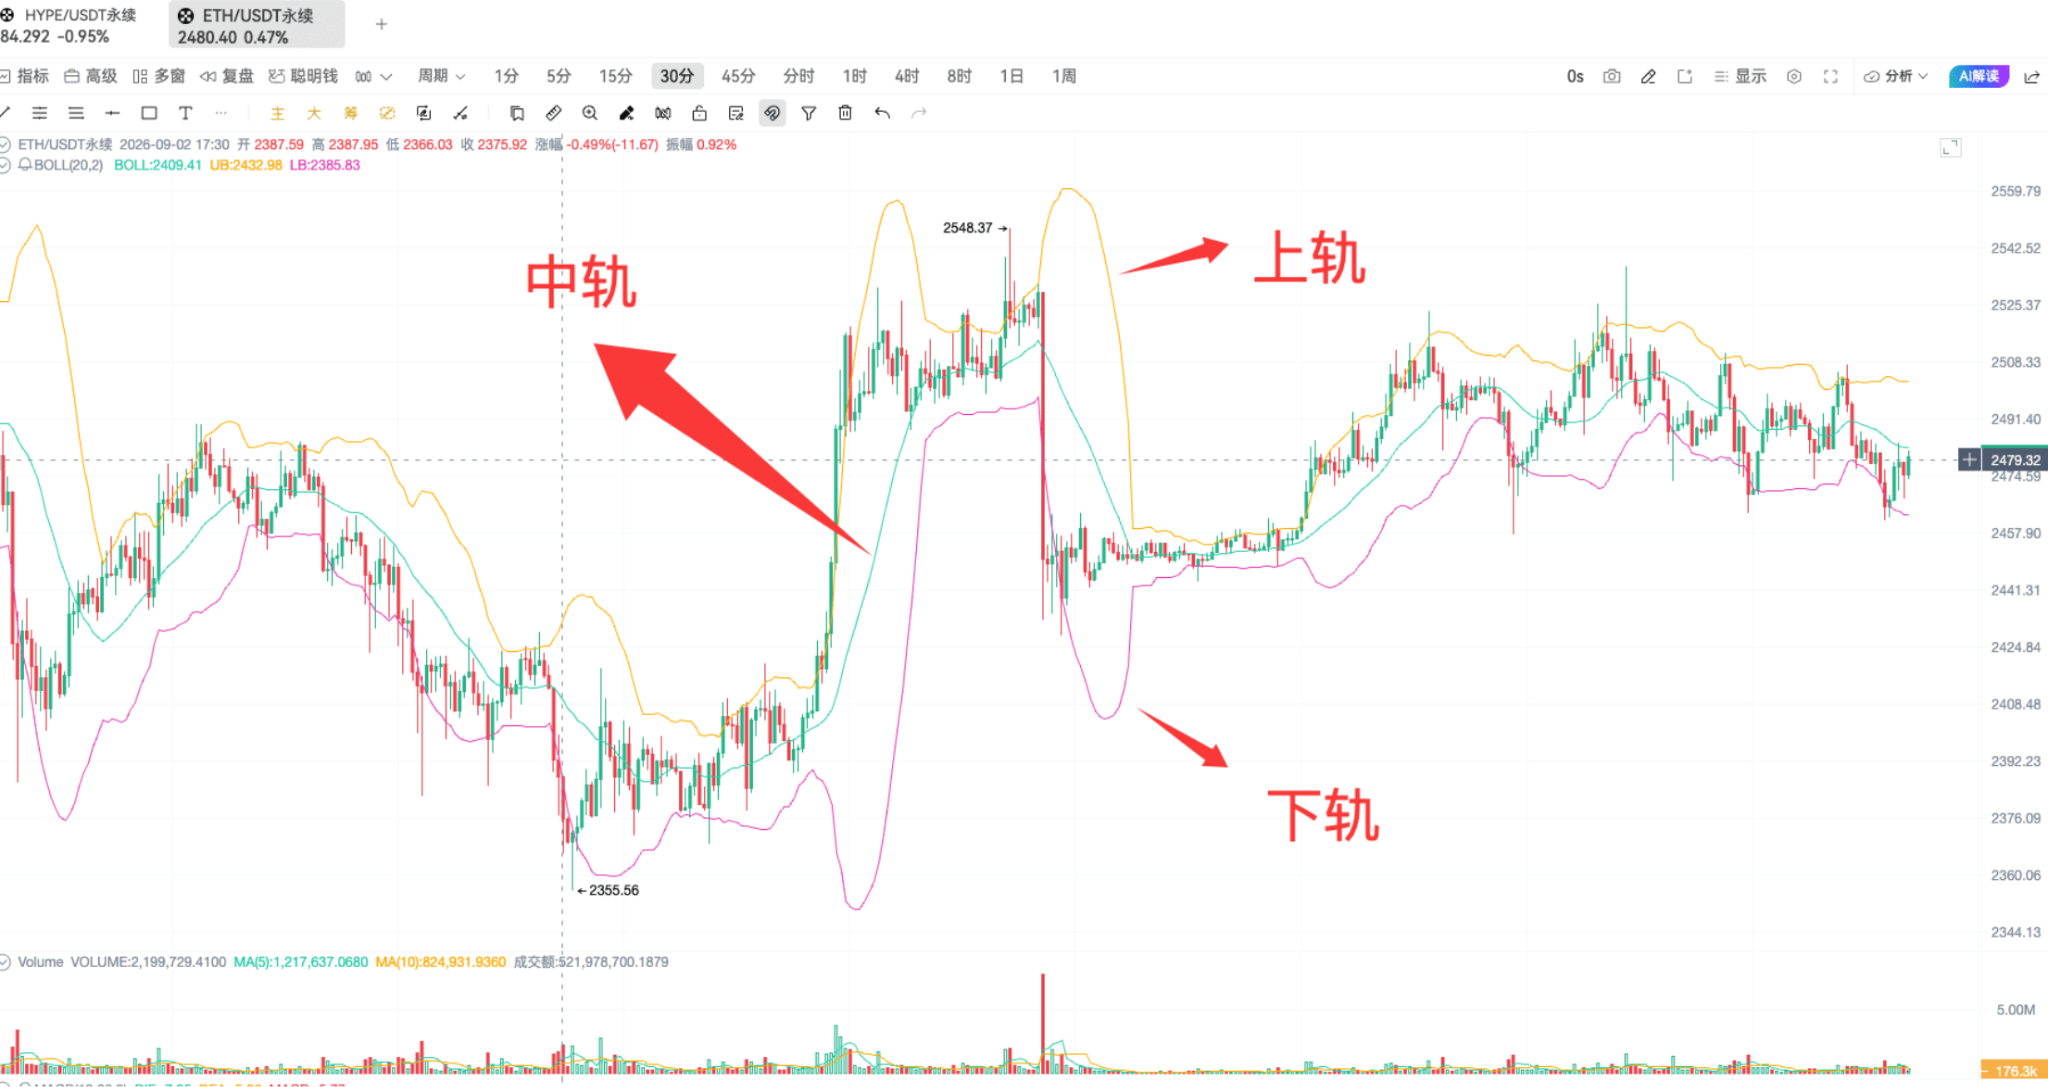
To extend the principle, Bollinger Bands were invented by John Bollinger and named after him. They utilize the statistical principle of standard deviation to calculate the confidence interval of candlesticks, thus determining the price volatility range and subsequent trends, relying on probabilistic reasoning with high reliability.
Here, let’s also discuss the core features of Bollinger Bands: The first feature is that the bandwidth varies. When the price experiences greater increases and decreases, the Bollinger Bands will widen; during sideways movements with small fluctuations, the bands will narrow. The second feature is that they provide built-in support and resistance indicators. The lower band acts as support for the price, while the upper band acts as resistance; the middle band may sometimes be support and sometimes resistance, depending on the trend. The third feature is the overbought and oversold principle. When the price breaks above the upper band, it enters an overbought zone; when the price breaks below the lower band, it enters an oversold zone.
Returning to ETH, we’ll switch to a 30-minute cycle.
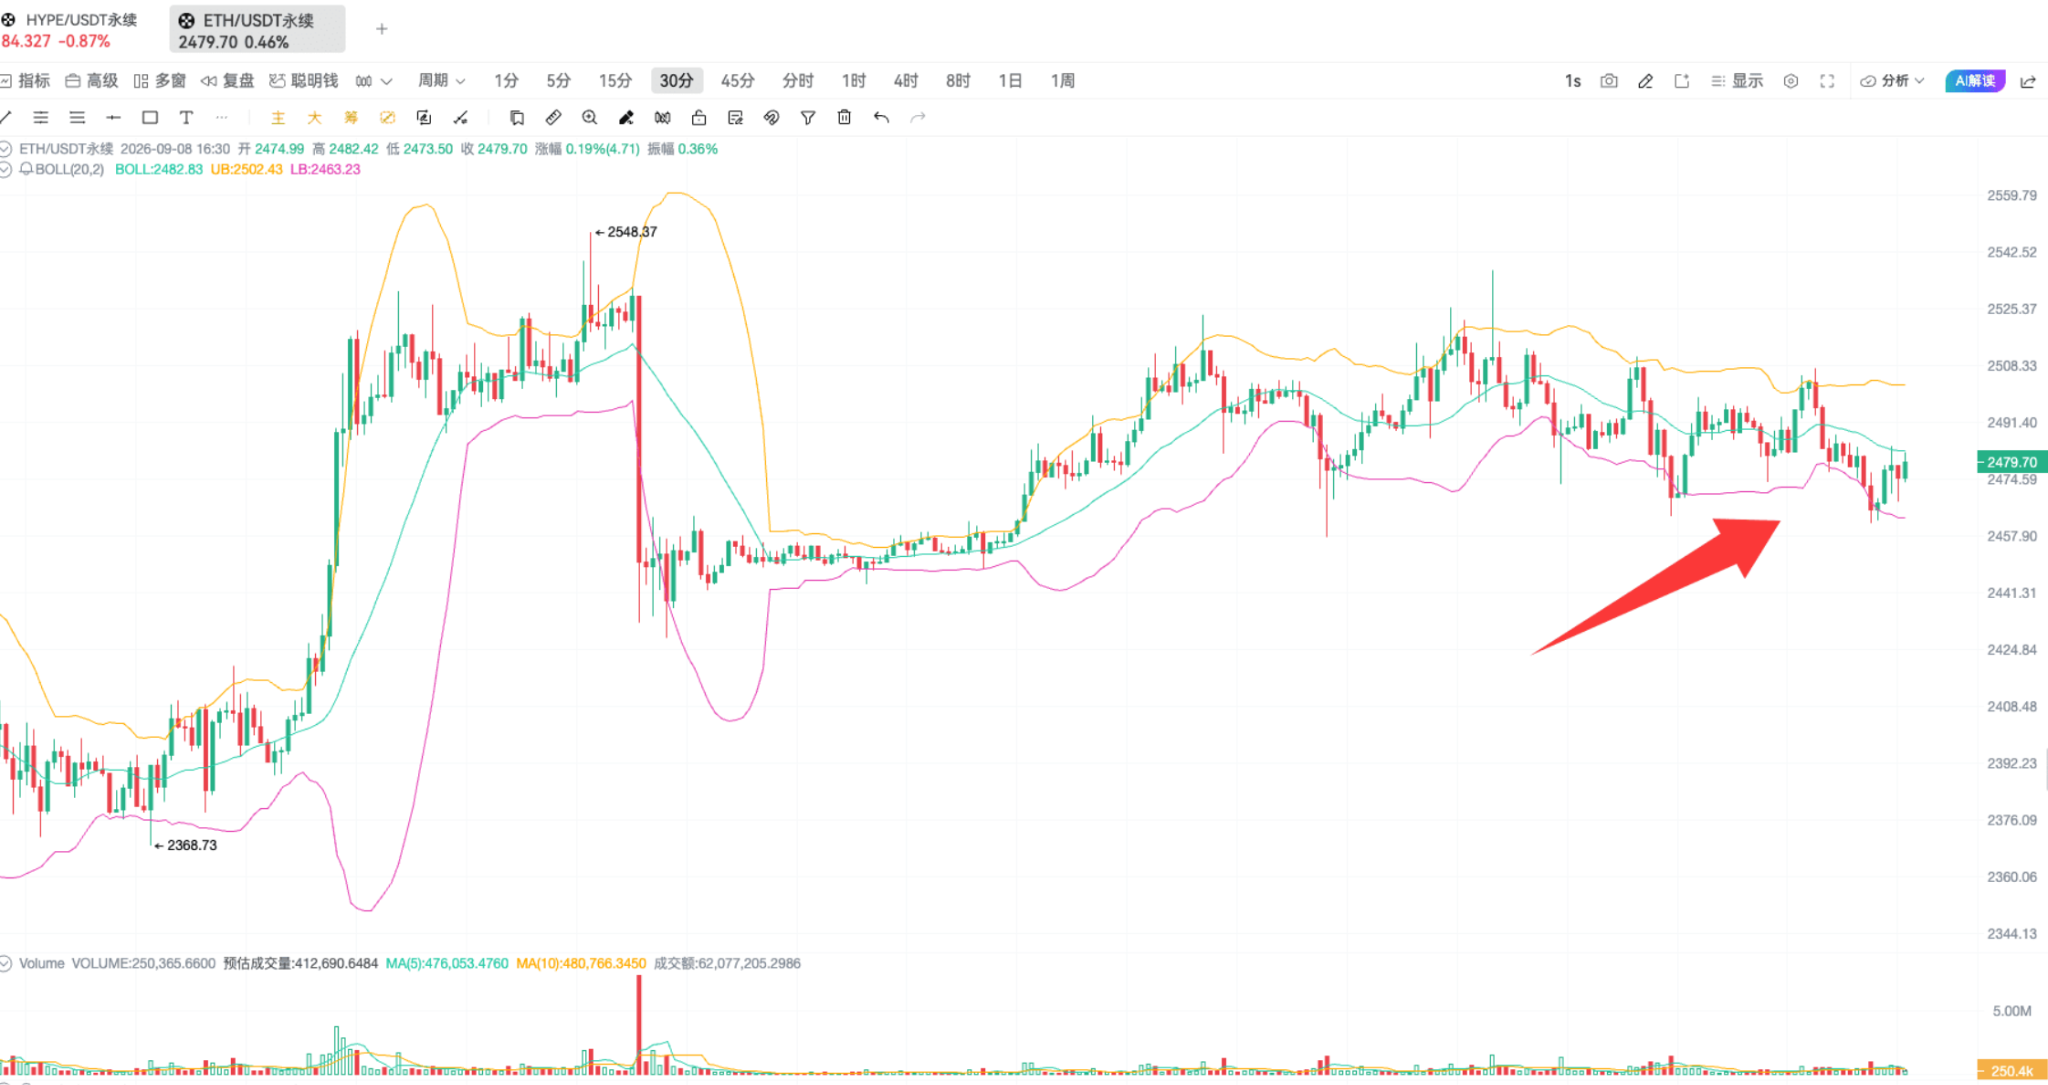
The current price is mainly running between the lower band and the middle band, indicating a retracement process. So how can we find entry points for buying? There’s a set of ideas worth referencing that I shared before. First, the price declines along the BOLL lower band; this is the first step, and the current market fits this condition; the second step is that when the price leaves the lower band and begins to turn upwards while the MACD forms a golden cross, that is an excellent buying point.
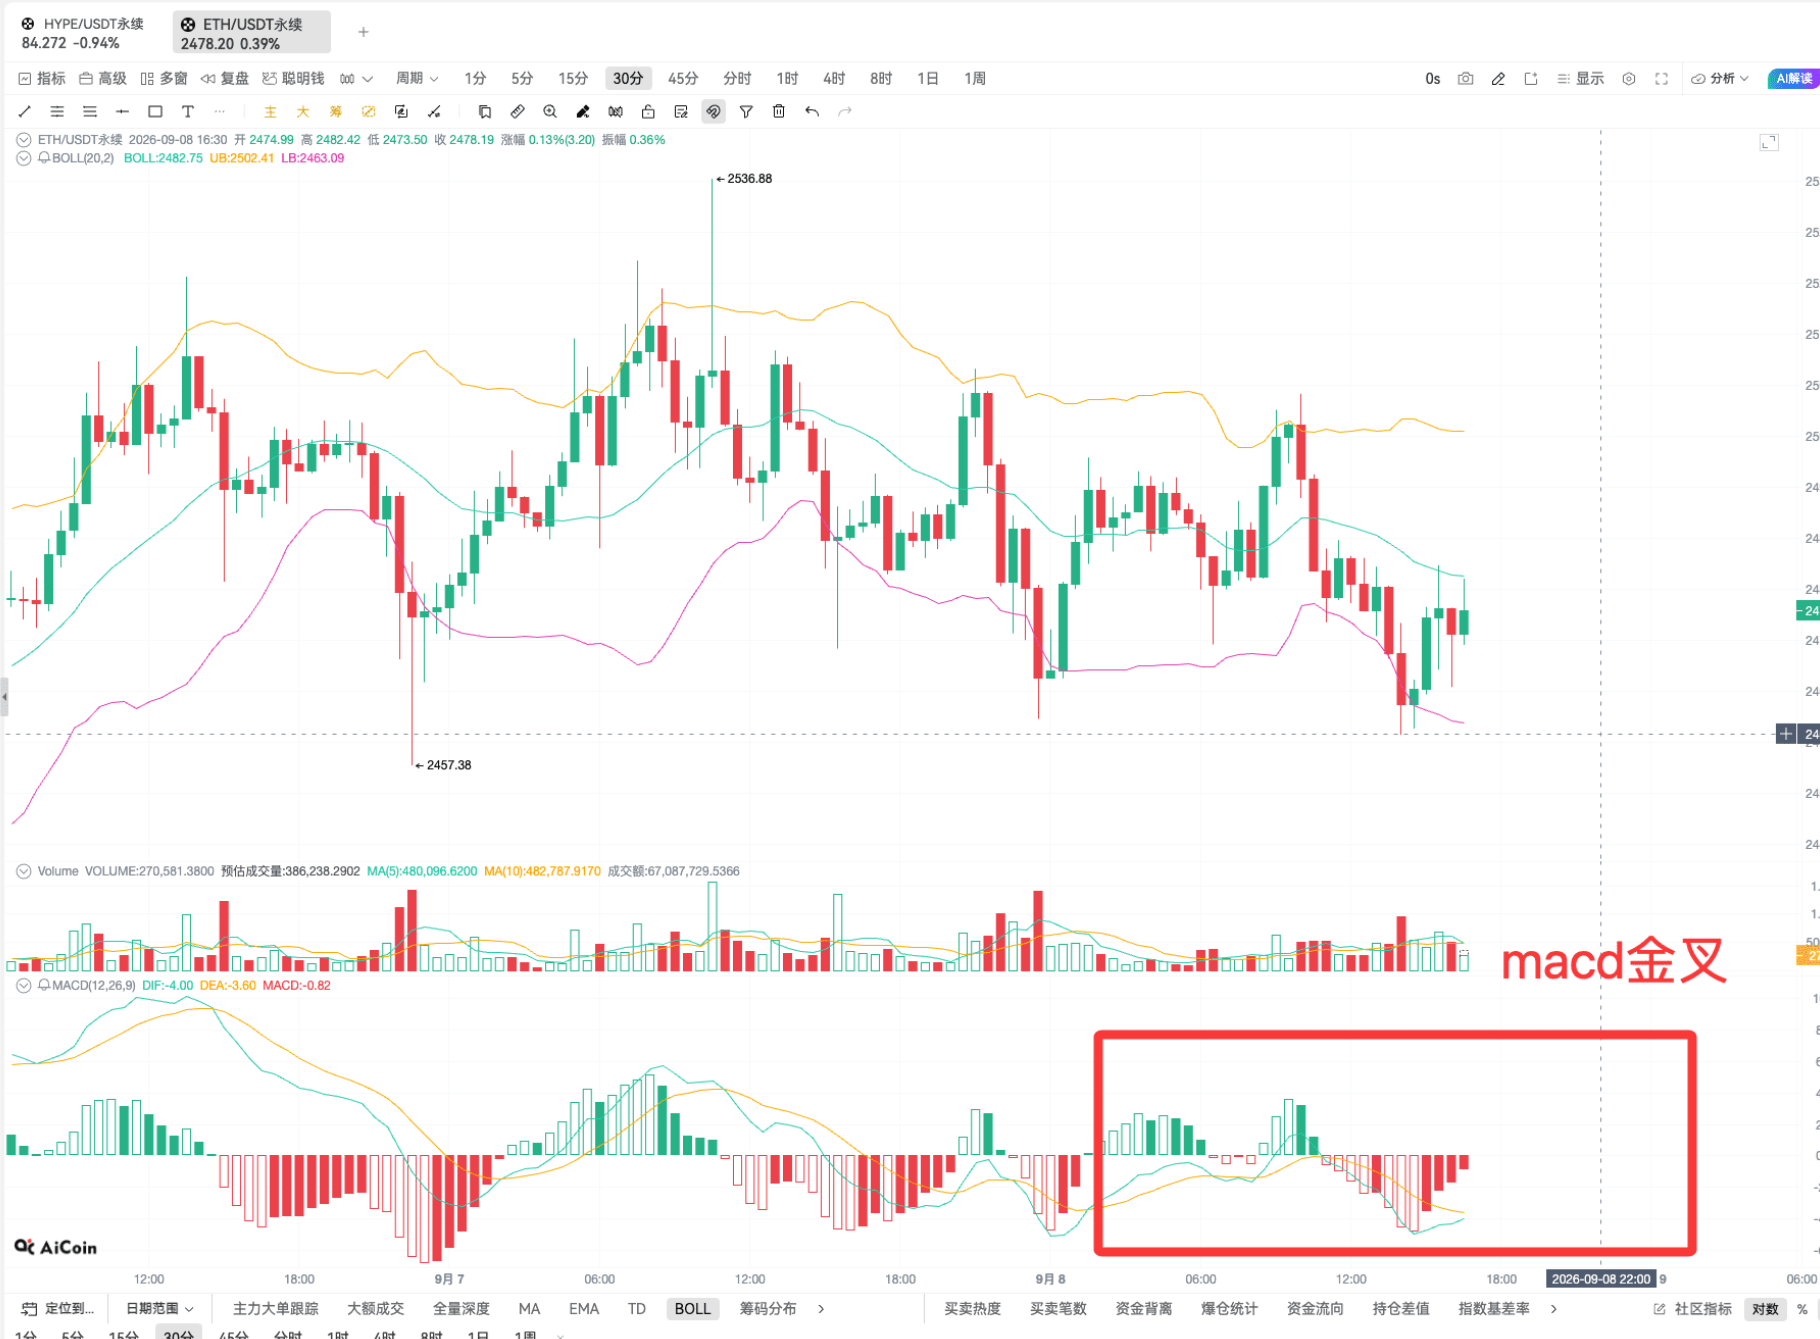
If this buying point is valid and the price continues to break upwards, a second buying point may occur: when the price retraces to the middle band and holds, that becomes the second accumulation point. Here’s an example of this classic buying method.
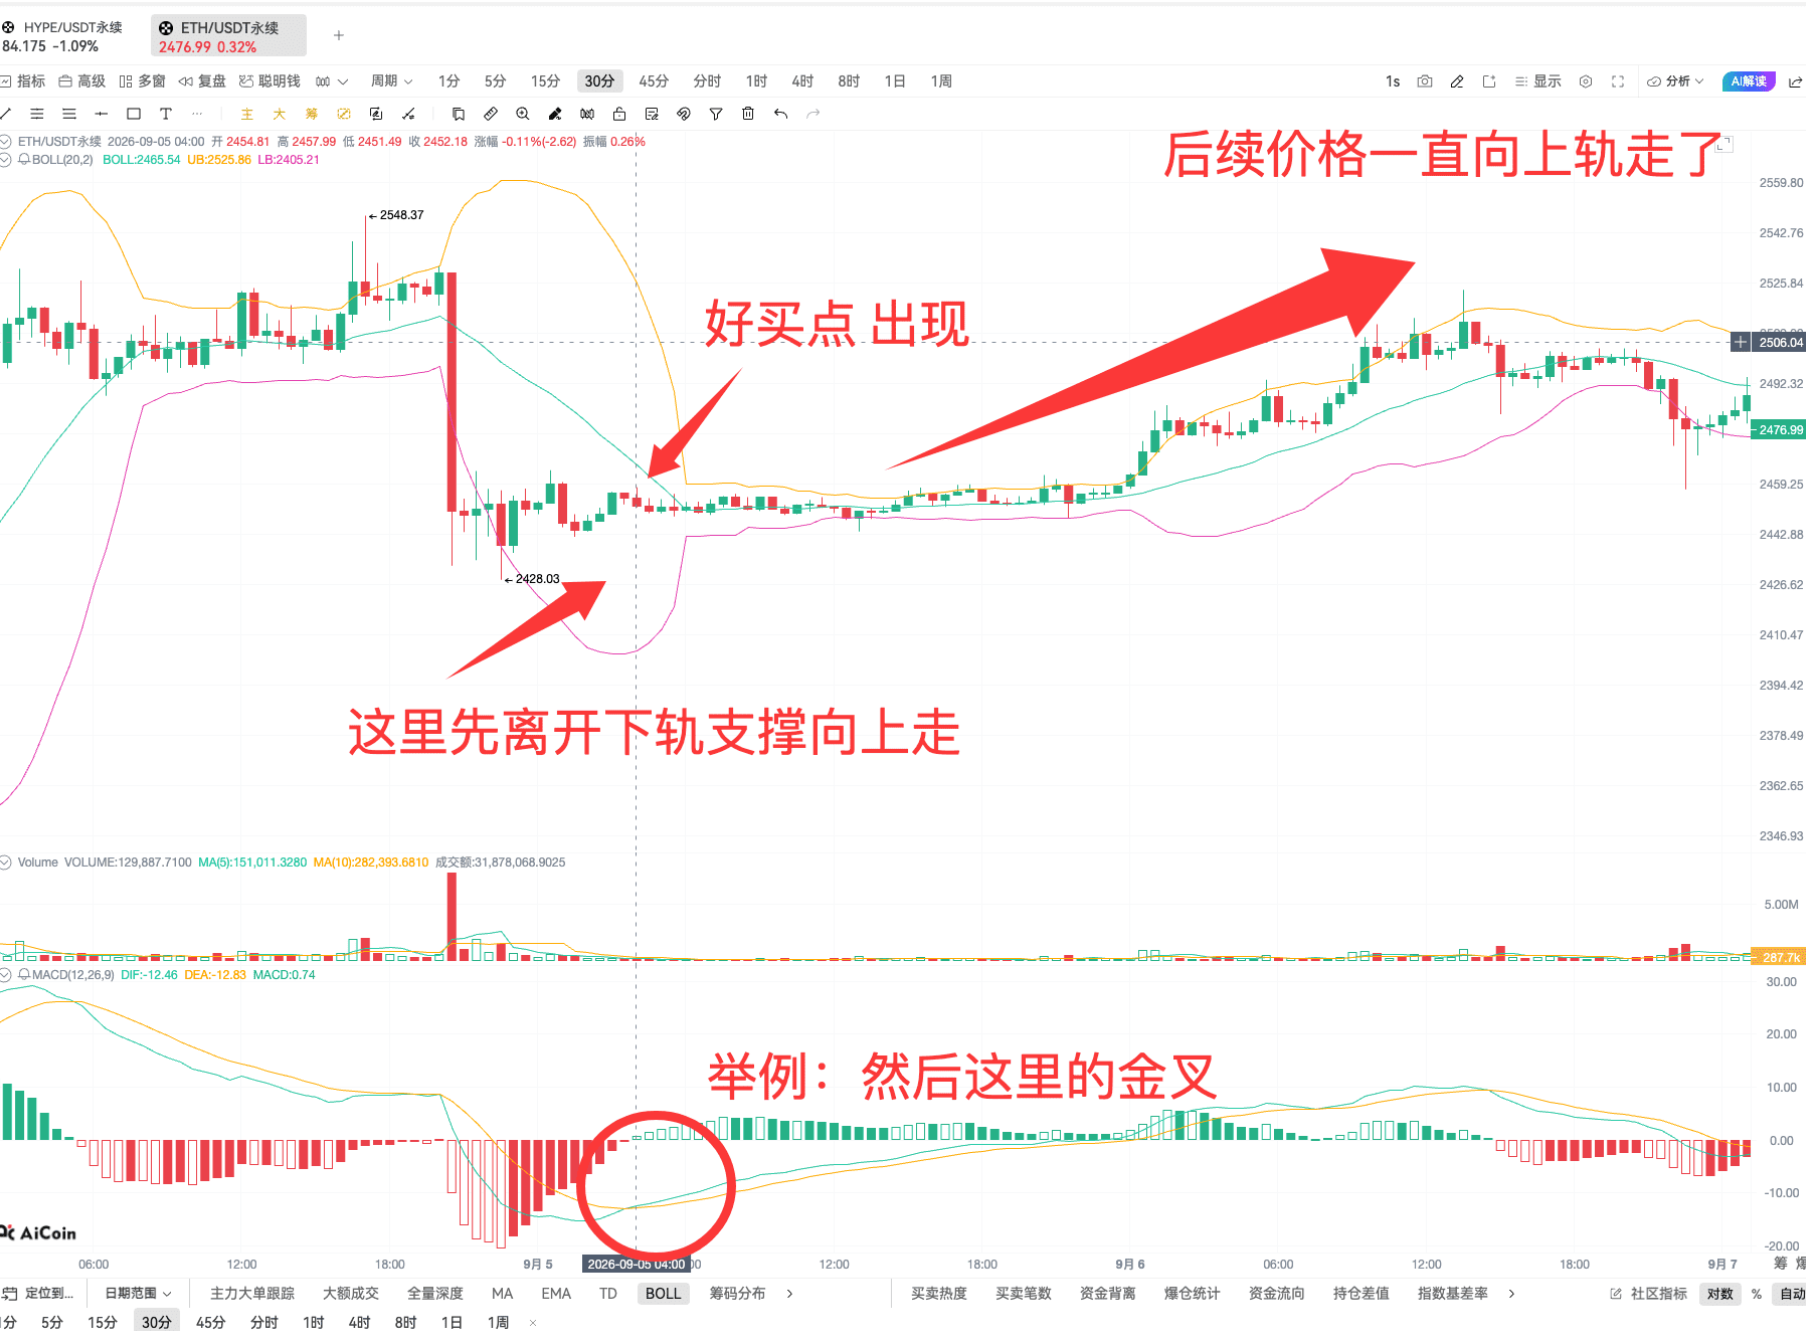
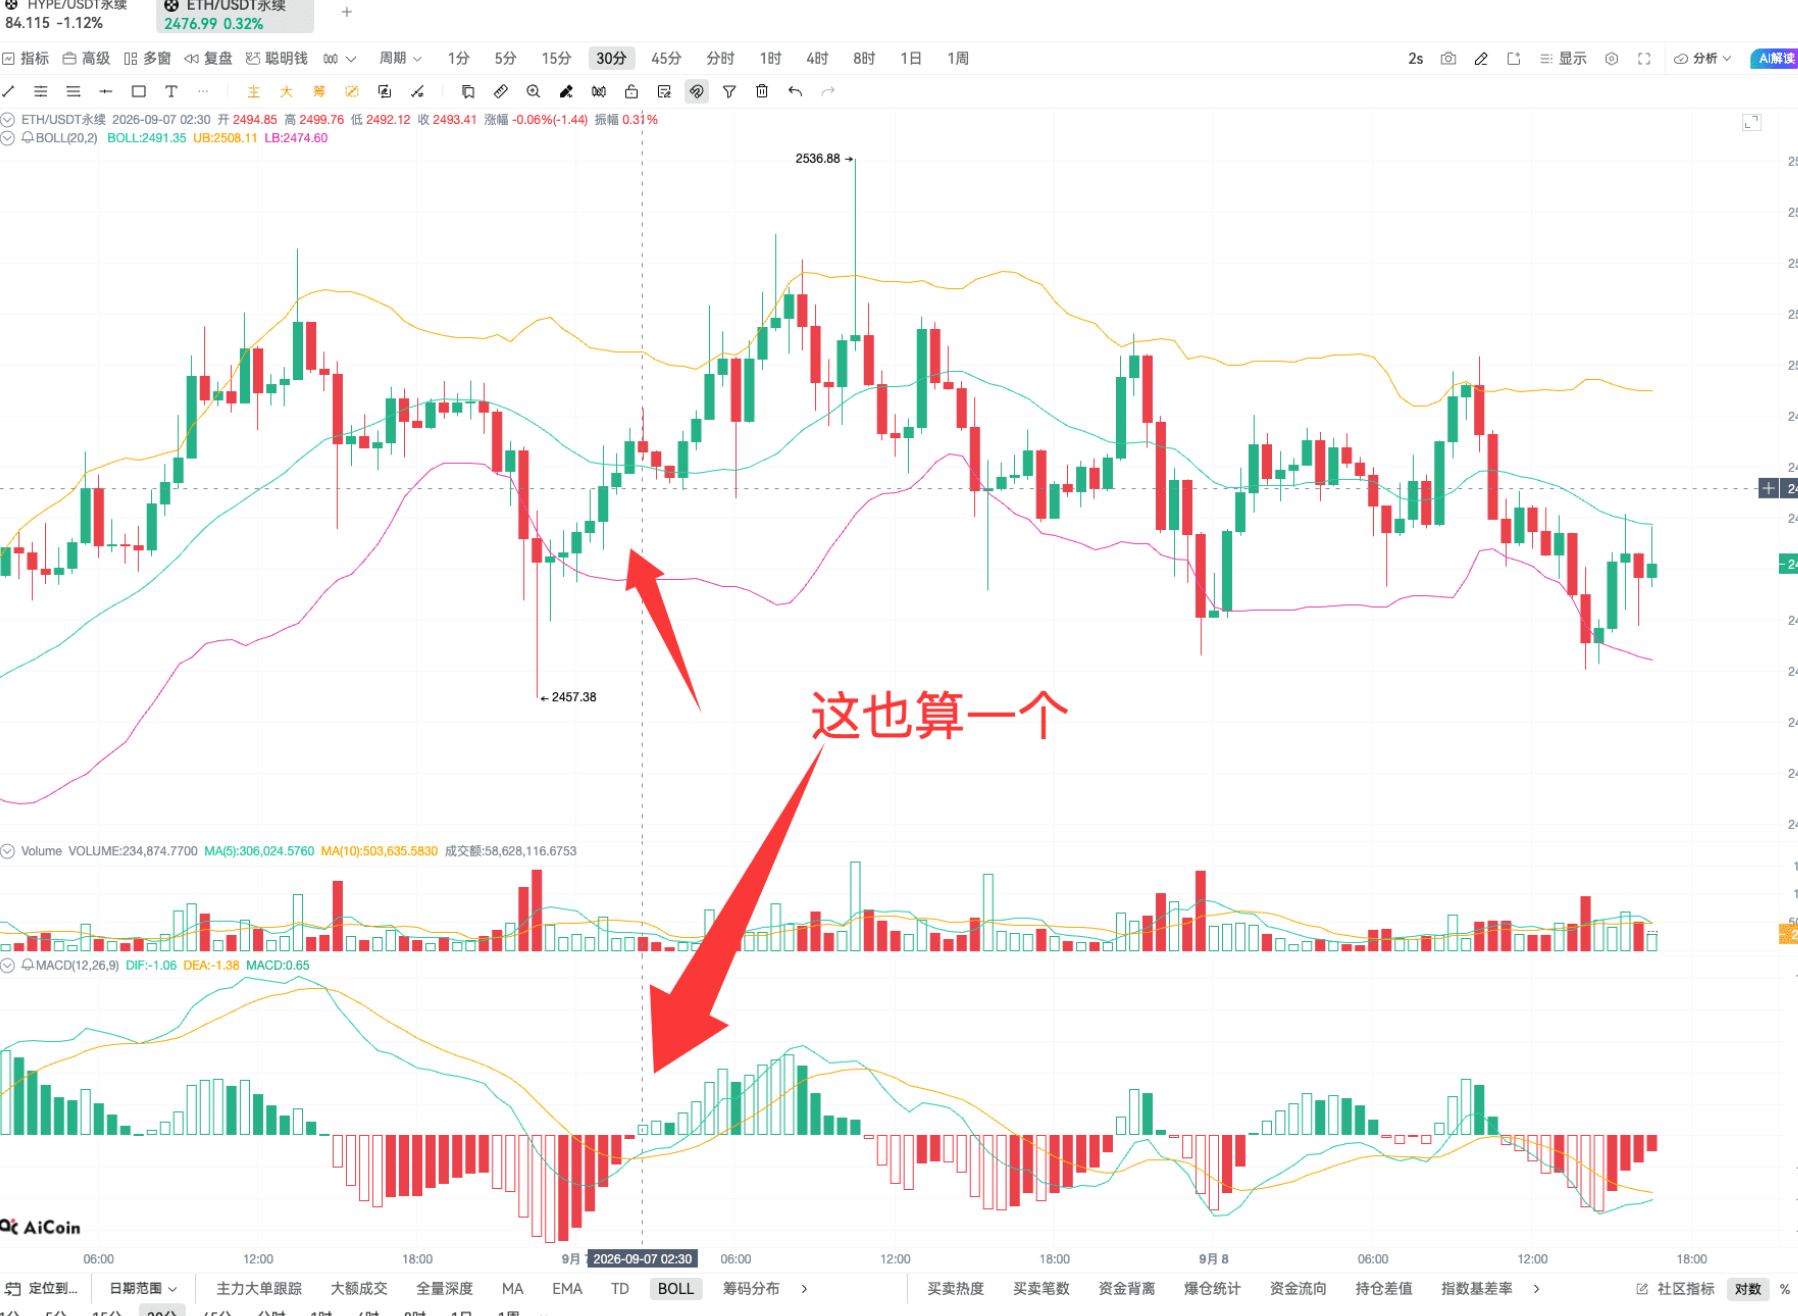
Thus, using BOLL to capture short-term support buying points is indeed very effective. Do you understand? The methods of finding support and resistance with Bollinger Bands and how to identify buying points can be applied to any market situation. Don’t be lazy; learn to analyze independently. I’m just facilitating your mastery of the tools and providing a method with a relatively high success rate; there are many ways to use this indicator, not just this one. Especially the TD indicator, which is particularly accurate in a fluctuating upward trend; each TD9 can be used for trading.
Currently, there are live broadcasts every day, so feel free to continue following the AiCoin team! Pre-booking available👇
https://www.aicoin.com/zh-Hans/live/list?tab=upcoming
Join our community to discuss and grow stronger together!
Official Telegram community:
AiCoin Chinese Twitter: https://x.com/AiCoinzh
Aster Commission:
https://www.asterdex.com/zh-CN/referral/9C50e2
Hype Commission:
https://app.hyperliquid.xyz/join/AICOIN88
Binance Commission:
https://jump.do/zh-Hans/xlink-proxy?id=3
Referral code: aicoin668
Coinbase Commission:
https://jump.do/xlink?checkProxy=true&proxyId=25
Referral code: Y8L23JL
免责声明:本文章仅代表作者个人观点,不代表本平台的立场和观点。本文章仅供信息分享,不构成对任何人的任何投资建议。用户与作者之间的任何争议,与本平台无关。如网页中刊载的文章或图片涉及侵权,请提供相关的权利证明和身份证明发送邮件到support@aicoin.com,本平台相关工作人员将会进行核查。