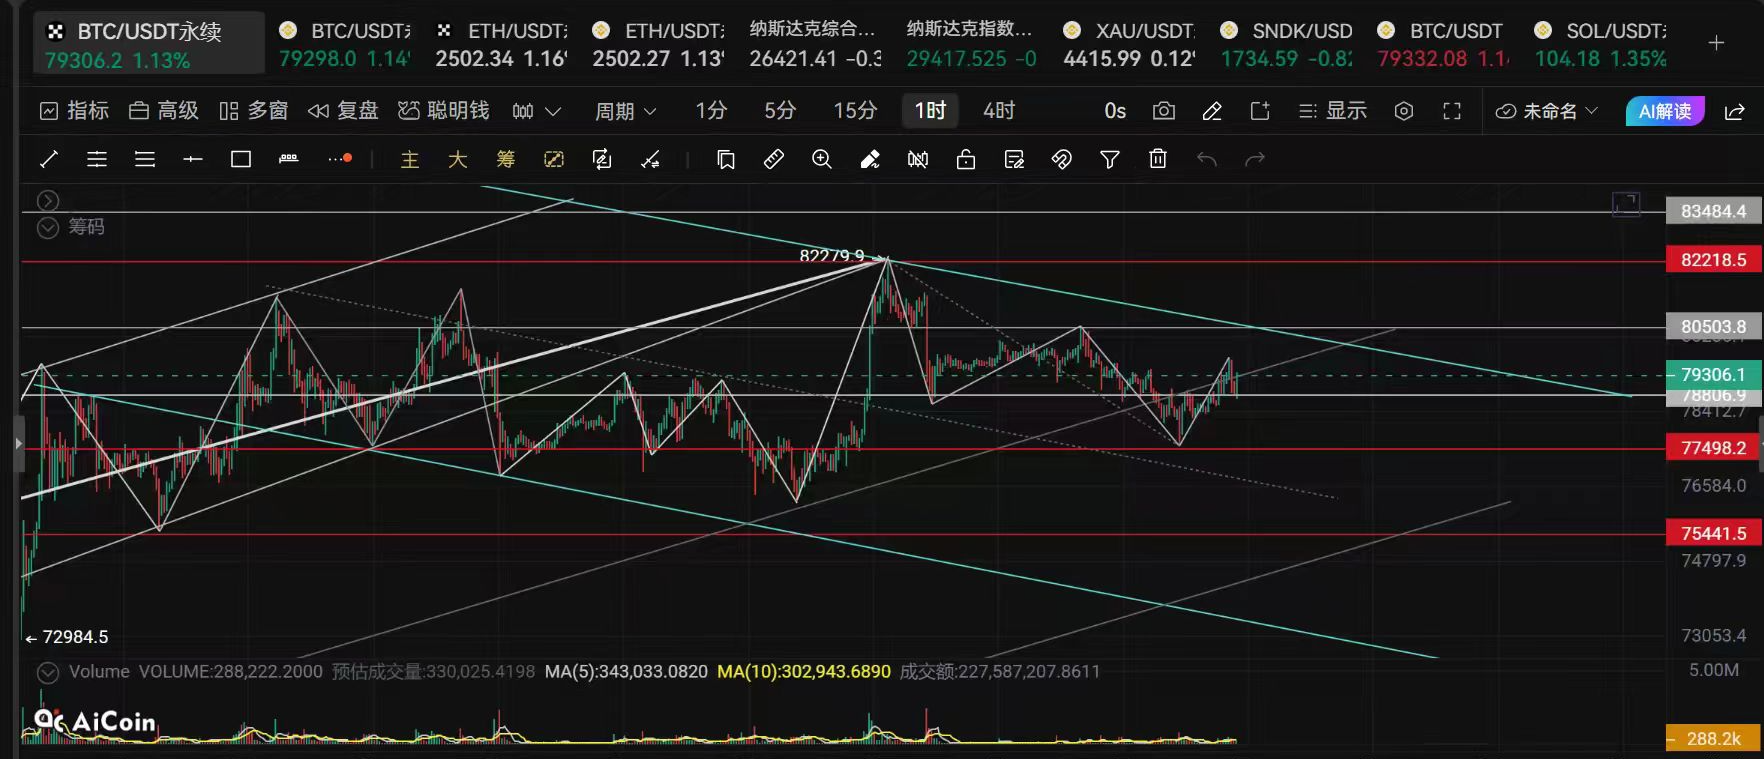
Crypto Circle Academician: The peak and retreat of Bitcoin (BTC) on September 10 is not the end. What are the funding intentions behind BTC's current market situation? Latest market analysis and trading advice.
The current price of Bitcoin is 78,600, and both bulls and bears are arguing fiercely. Many friends who chased the high are now feeling anxious, fearing that a round of pullback will directly eat away their profits, while those who missed the opportunity do not dare to enter the market, worrying that as soon as they buy, they will encounter a decline. In fact, there is no single strong trend in the market right now; it is in a stage of oscillation and digestion after a big rise. There’s no need to blindly guess the top or bottom.
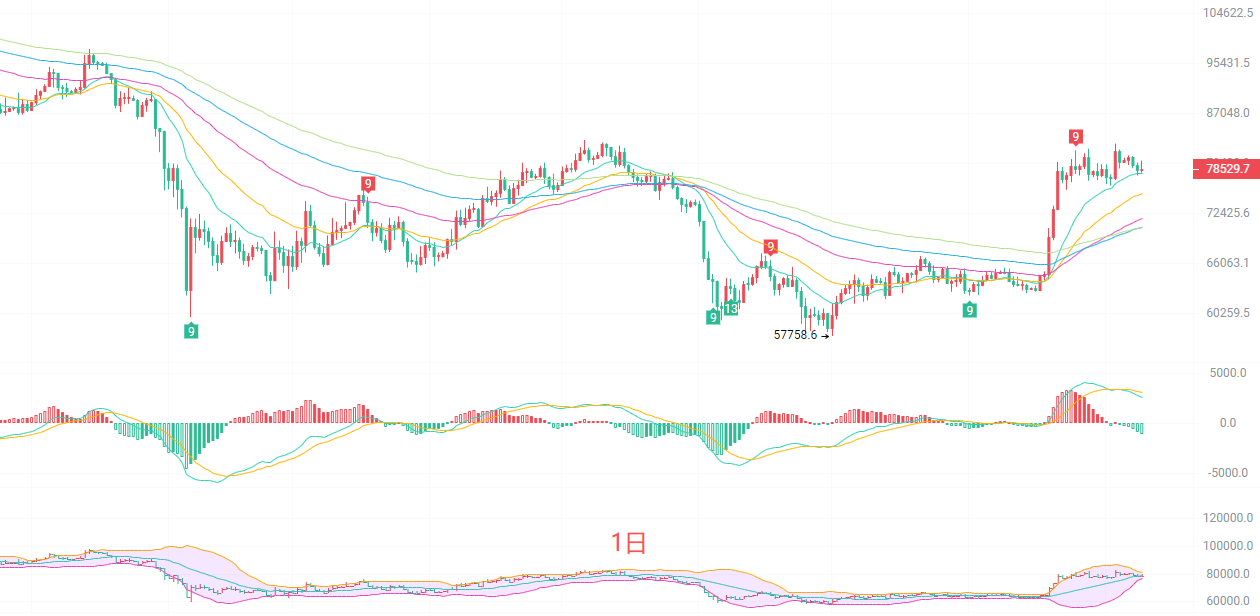
The daily K-line is in a high-level oscillation range. The daily KEMA15 is forming short-term support around 78,013, and the EMA30 has risen to 75,152. The mid-term moving average is still trending upward, and the overall trend has not directly turned bearish. The middle track of the Bollinger Bands is 78,688, and the price is running closely along the middle track of the Bollinger Bands. The upper track is 80,845 and the lower track is 76,531, with the range narrowing, indicating that short-term fluctuations will gradually decrease, waiting for a directional choice. The MACD red bars are continuously shrinking, and the DIF and DEA are turning down from a high position, indicating that bullish momentum is weakening. If the price falls below the 78,000 mark, it will further test the support of the mid-term moving average at 75,152.
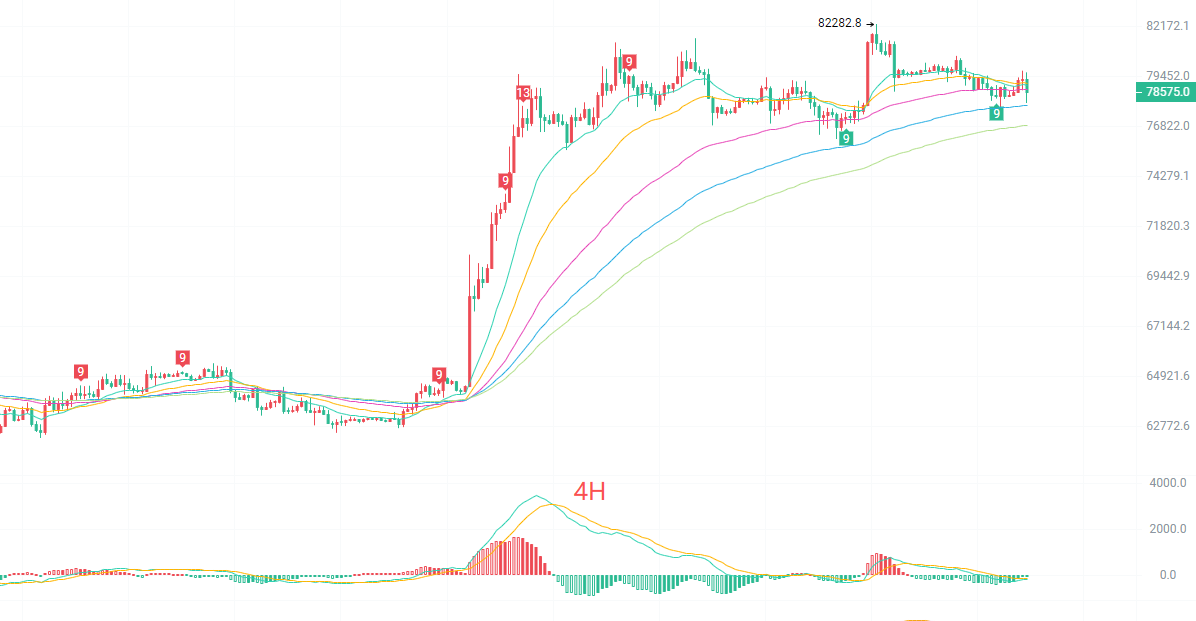
The four-hour K-line has entered a consolidation structure. The EMA15 is at 78,953, and the EMA30 is at 79,075. The short-term moving averages are entangled and competing fiercely between bulls and bears. The middle track of the Bollinger Bands is at 79,115, the upper track at 80,199, and the lower track at 78,031. The range is compressed, and the market is gathering strength. The MACD indicators DIF and DEA are flat above the zero axis, with red bars basically disappearing, indicating that the forces of bulls and bears are becoming balanced. The key pressure above is near 80,200, and strong support below is at 78,000. If it effectively falls below 78,000, the oscillation structure will be broken, leading to a deeper pullback.
Short-term reference:
Buy from 78,100 to 77,700 with a stop loss of 500 points, targeting 79,500 to 80,200.
Sell from 80,000 to 80,300 with a stop loss of 500 points, targeting 78,600 to 78,000.
Specific operations should be based on real-time market data. For more information, you can consult the author. The article’s release may have delays; suggestions are for reference only and risks are to be borne by yourself.

Friendly reminder: The above content is solely created by the author of the public account. The advertisements at the end of the article and in the comments section are unrelated to the author. Please be cautious when discerning, thank you for reading.
免责声明:本文章仅代表作者个人观点,不代表本平台的立场和观点。本文章仅供信息分享,不构成对任何人的任何投资建议。用户与作者之间的任何争议,与本平台无关。如网页中刊载的文章或图片涉及侵权,请提供相关的权利证明和身份证明发送邮件到support@aicoin.com,本平台相关工作人员将会进行核查。