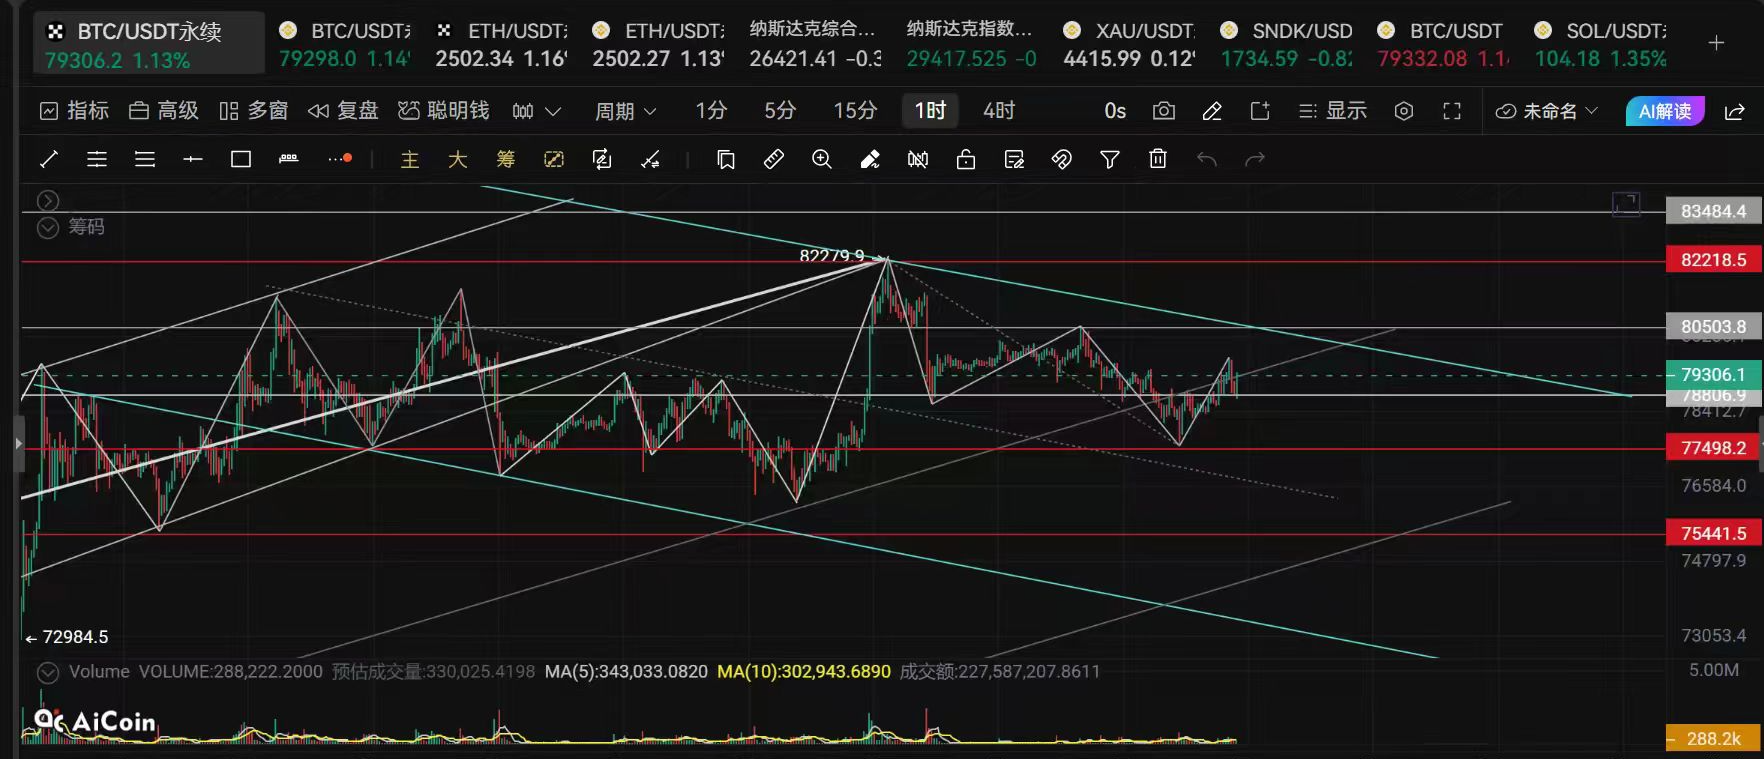
Li Ying Chat Coin: 9.10 Bitcoin (BTC) and Ethereum (ETH) Latest Market Analysis
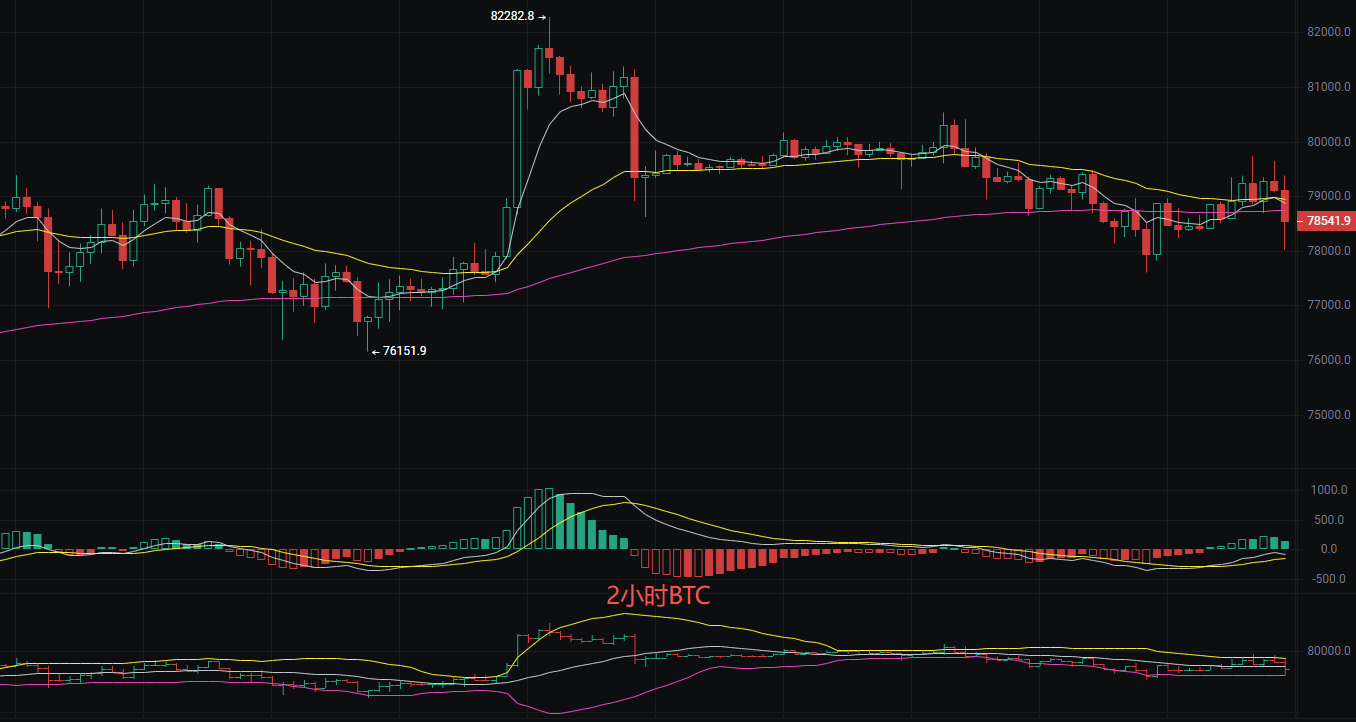
Family! The current price of Bitcoin is 78500, on the 2-hour chart, it previously struggled to rise to 82282 but couldn't hold and has fallen back. Now the price is tightly pressed down by several moving averages, like having a few large stones on top of it. This kind of trend tests the mentality the most; buying high fears being trapped, and buying low fears being half-way up the mountain. The EMA moving average system presents a bearish setup, with EMA7 crossing below EMA30 and EMA120, indicating heavy selling pressure in the short term and layers of resistance above. The MACD indicators DIF and DEA are beginning to shorten, showing that the downward momentum is weakening, and there are signs of a bottom divergence forming. The Bollinger Bands are clearly narrowing, with the upper band at 9447 and the lower band at 7796, with the price tightly following the middle band at 78704, and volatility has dropped to zero, which is a precursor to a trend change. Overall, in the short term, it is a bearish-dominated fluctuation market, but the repair demand after the overselling of indicators is accumulating.
Short-term strategy reference:
Buy point 80000-80500, stop loss 500 points, target 77000 aiming for 76500
Sell point 77500-77000, stop loss 500 points, target 78500 aiming for 79500
Ethereum
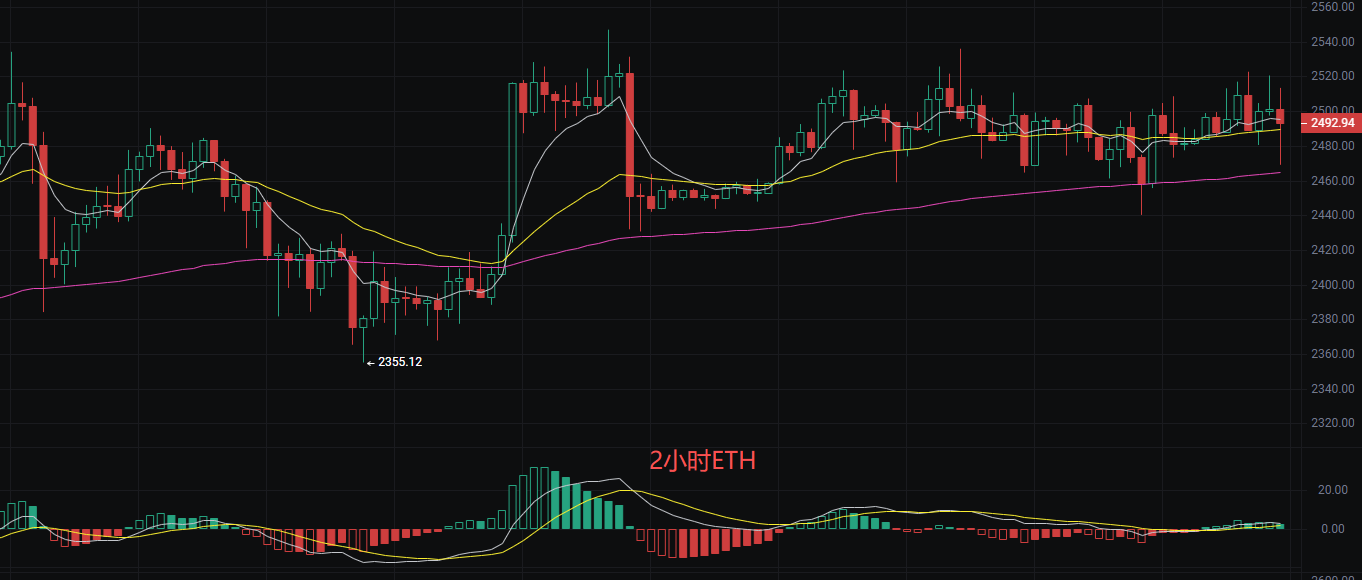
Family! The current price of Ethereum is 2485, with several moving averages entangled together in the short, medium, and long terms, indicating that the market is very tangled and lacks a clear direction. The MACD indicator is swaying near the zero axis, with short red and green bars, indicating that buying and selling forces are about the same. The Bollinger Bands have also narrowed, and the distance between the upper and lower bands has decreased, which is usually a precursor to a trend change. Simply put, it is the calm before the storm; both sides are holding back major moves, and we need to pay close attention to avoid being deceived by fake breakouts. This combination of moving average adhesion + MACD dullness + Bollinger band narrowing typically predicts that a directional breakout will occur in the next 3-5 K-lines, so the effectiveness of breakouts in the 2463-2511 range needs to be closely monitored.
Short-term point reference
Sell point 2510, defending 2520, stop loss 30 points, target 2550 aiming for 2600
Buy point 2460, defending 2475, stop loss 30 points, target 2400 aiming for 2380
The above content is exclusively original by Li Ying; please indicate the source when reprinting! Article publishing review has delays, and the market changes rapidly; the above suggestions are for reference only, and risks are borne by the readers.

Warm reminder: The above content is only created by the author on Weibo, and the ads at the end of the article and in the comments section have nothing to do with the author. Please discern cautiously, thank you for reading.
免责声明:本文章仅代表作者个人观点,不代表本平台的立场和观点。本文章仅供信息分享,不构成对任何人的任何投资建议。用户与作者之间的任何争议,与本平台无关。如网页中刊载的文章或图片涉及侵权,请提供相关的权利证明和身份证明发送邮件到support@aicoin.com,本平台相关工作人员将会进行核查。