Threefold data points to the same resistance: long-term holding cost, liquidation heat map, and ETF breakeven.
Written by: Glassnode
Translated by: AididiaoJP, Foresight News
Bitcoin is approaching a resistance band again. The cost basis data, liquidation heat map, and institutional breakeven levels are all drawn in almost the same position. However, the selling pressure when heading toward this resistance is the lightest it has been this year. Measured inflation has dropped to a two-year low, yet yields remain at a cyclical high.
Key Points
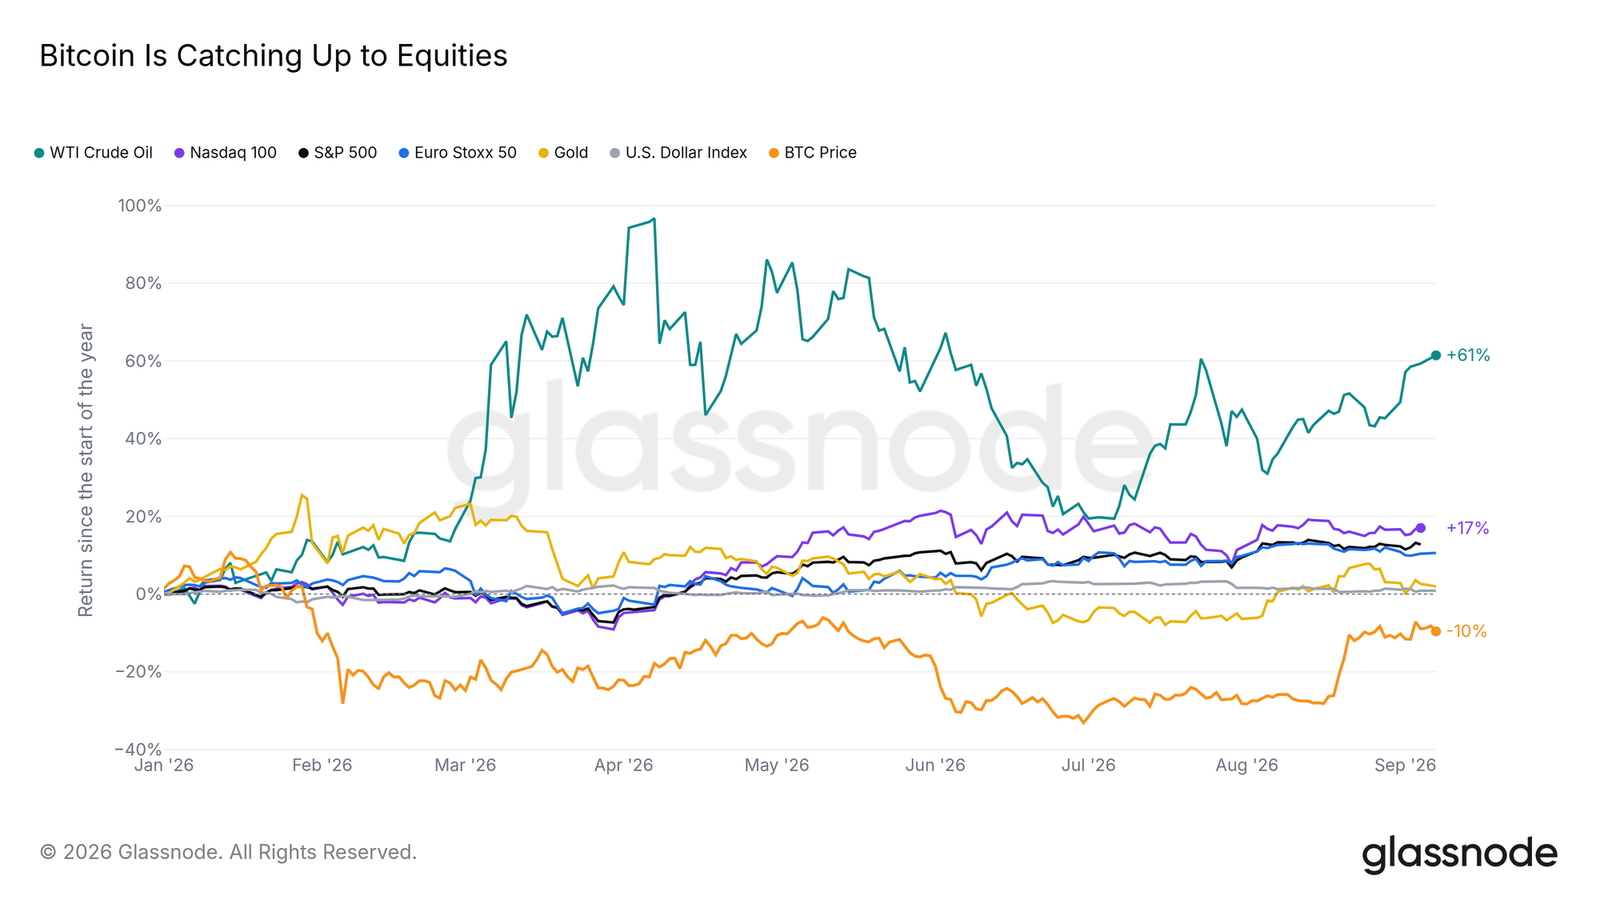
- Bitcoin has risen 23% over the past 21 trading days, while the stock market has barely moved, but it is still down 10% year-to-date.
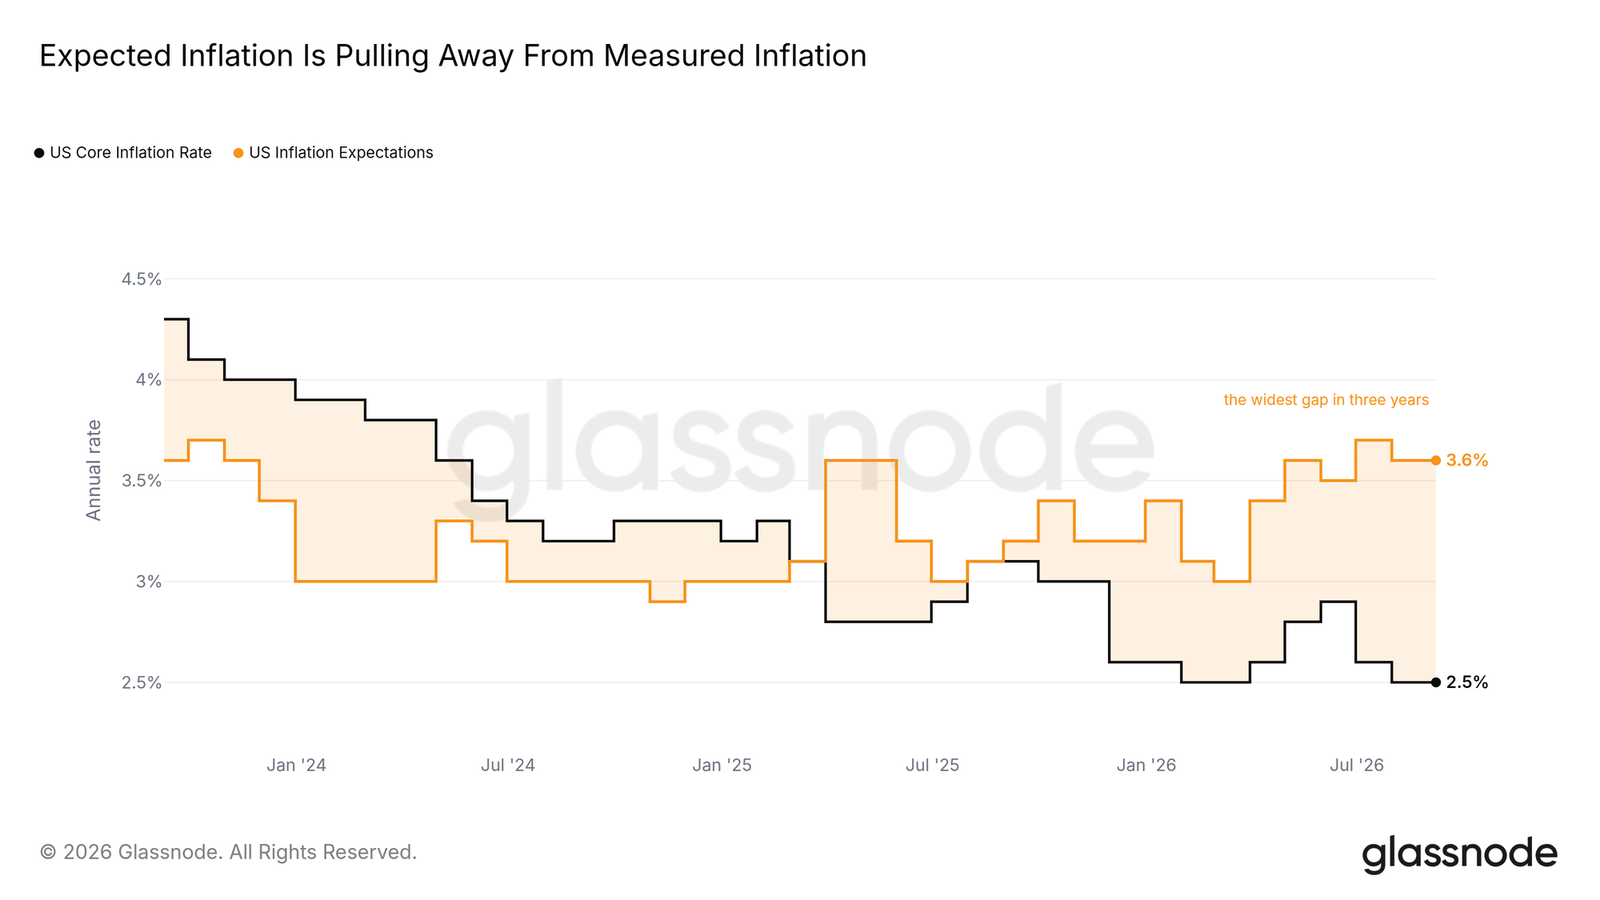
- Core inflation has fallen to a two-year low of 2.5%, while inflation expectations remain at 3.6%, with the gap being the widest in three years.
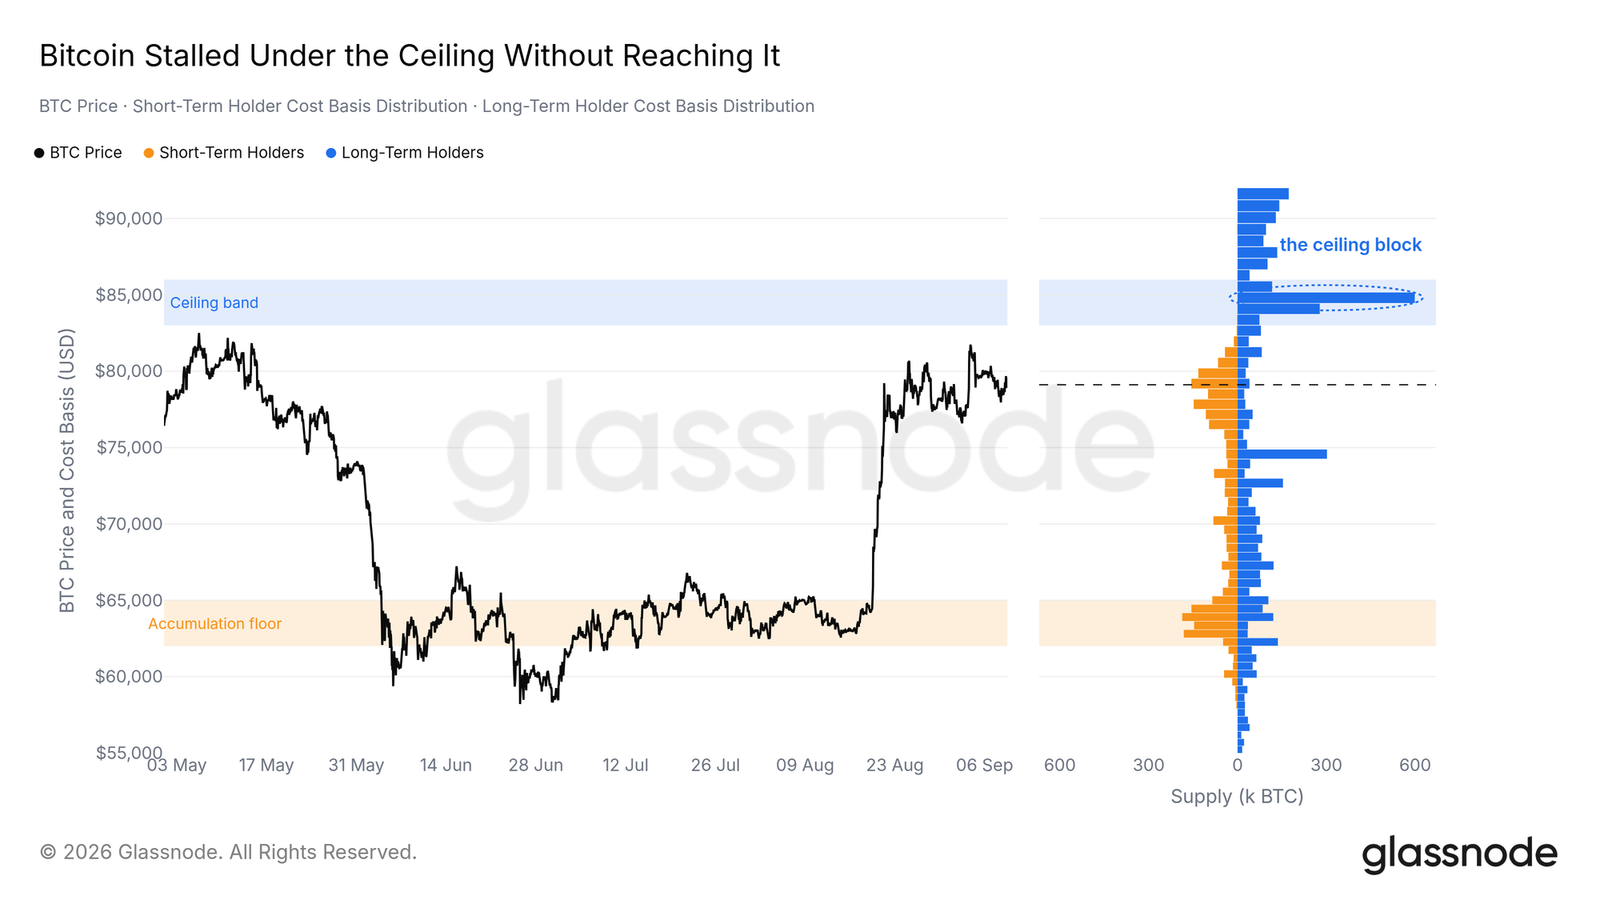
- Cost basis of long-term holders, liquidation heat map, and ETF breakeven all set the ceiling between $83,000 and $86,000; spot prices were only 1.5% away from this lower bound.
- The selling intensity during the price surge was less than half that of August, and long-term holders have basically not participated in this selling wave.
- Bottom signals had been in high resonance for several months but have now faded; altcoins have not taken market share from Bitcoin as they did before previous tops.
A Late Start This Year
Closing the Gap from the Bottom
Over the past 21 trading days, Bitcoin has risen 23%, while the S&P 500 and Nasdaq 100 have remained flat, and the Euro Stoxx 50 has slightly declined. In the seven asset classes we track, Bitcoin ranks first during this period. However, for the whole year, the situation is just the opposite: Bitcoin is still down 10% since January, while the S&P 500 has risen 13%, and crude oil, the best performer this year, has far outperformed both.
Bitcoin spent the entire summer at the bottom of the rankings and has only recently begun to catch up. A month of relative strength has only made up a small portion of the losses from the first half of the year.
Expectations Outpacing Data
Bitcoin's current rebound faces a bond market that remains relatively tight. The yield on the 10-year U.S. Treasury notes is settled at 4.8%, equaling a two-year high; the two-year yield is about 63 basis points higher than the 3.75% federal funds target, indicating a tighter policy stance in the bond market.
Actual inflation data does not support this bias. Core inflation in the U.S. has dropped to 2.5%, a two-year low, while inflation expectations remain at 3.6%. The gap between household expectations and actual data is the widest in three years. Yields are at cyclical highs, but core inflation is cooling, making it difficult to justify rate hikes. The CPI data for August, released on September 11, and the FOMC decision on September 16 will directly test this. If core inflation converges toward expectations, the case for tightening policy will strengthen; if it remains at low levels, yields will be ahead of data.
The Same Ceiling from Different Perspectives
Stopping at the Wall
Last week's report placed the upper ceiling at $83,000 to $86,000. This rebound tested this judgment but did not truly touch it. Spot prices on September 3, 2026, reached a high above August's peak, stopping 1.5% below that range's lower bound, and then traded sideways around $80,000.
The distribution of the cost basis for long-term holders explains why this range is significant. About 1.07 million BTC were bought between $83,000 and $86,000, mostly by long-term holders, with the heaviest concentration near $85,000. This chunk of coins has hardly moved in the past 30 days. The real change is below: between $76,000 and $82,000, the accumulation of coins, mainly purchased by recent buyers, is increasing; meanwhile, the accumulation at $62,000 to $65,000 has thinned out, as the coins bought there have been transferred out. The market has rebuilt a floor just below spot prices, while the ceiling remains intact.
The Same Wall on the Liquidation Heat Map
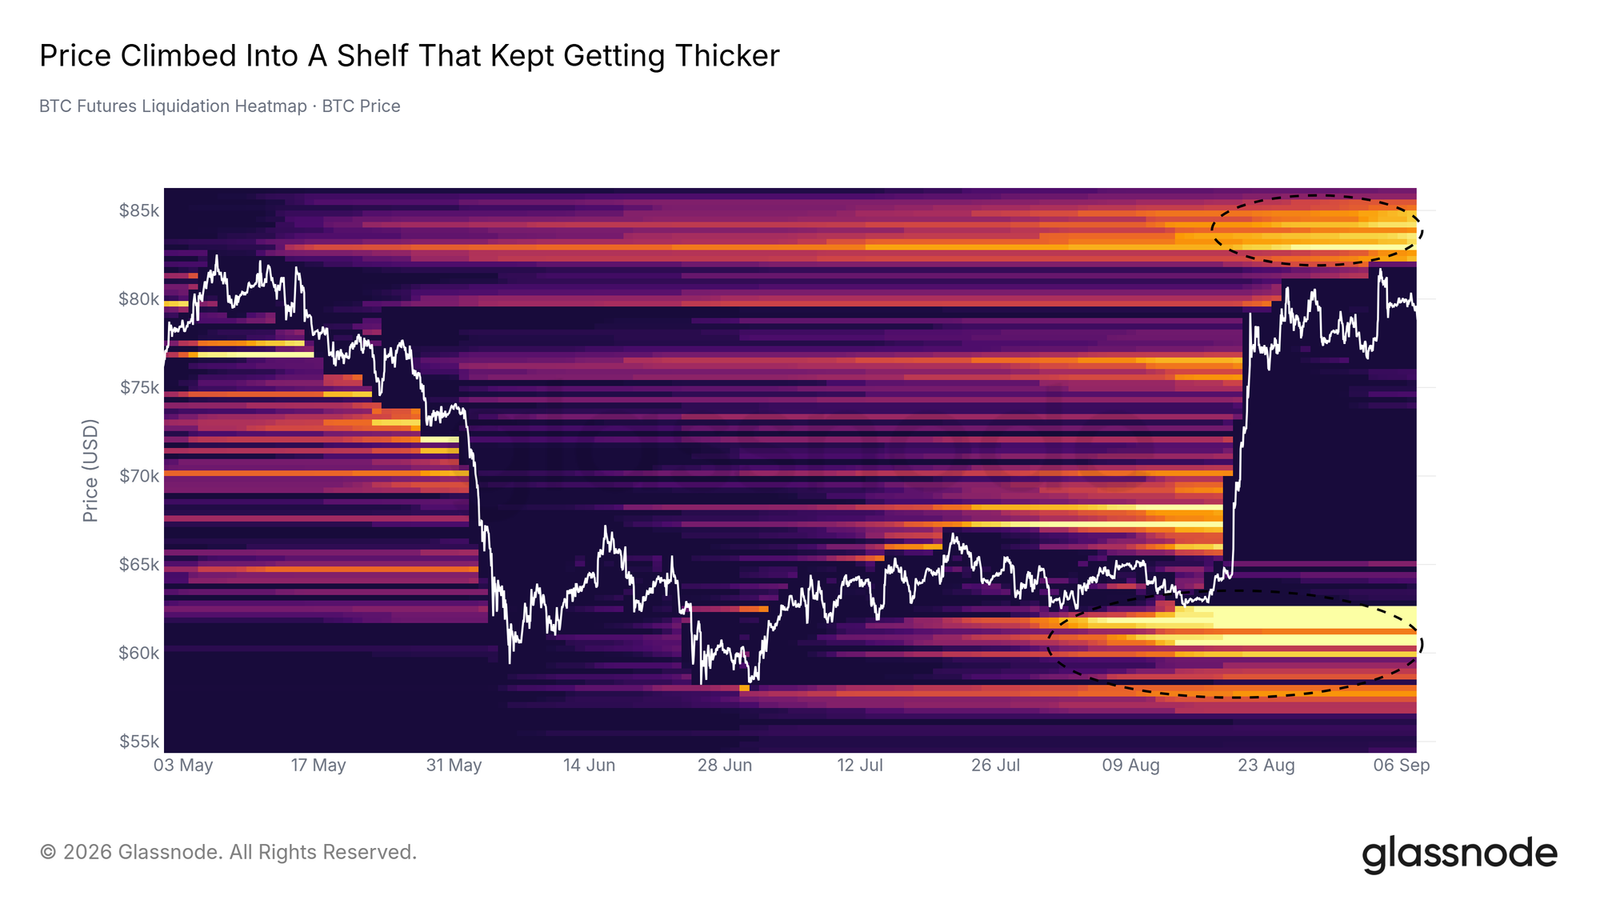
The ceiling drawn by the derivatives market is also at the same position. On the BTC futures liquidation heat map, the bearish liquidation staircase between $82,000 and $86,000 has expanded by 21% since the squeeze on August 19, 2026, while the overall liquidation scale has shrunk by a third. This staircase now accounts for a significant portion of the model's liquidation volume, nearing the highest since the chart's inception.
Prices have climbed into a continuously thickening wall and paused in front of it. Below the spot market, the bullish liquidation cluster between $60,000 and $63,000 remains intact, squeezing the range from the lower bound. If the price continues to break above $86,000, it will consume the densest bearish liquidation fuel on the chart; if it fails to hold above $63,000, it will begin to digest the bullish side.
Institutional Breakeven Just Above
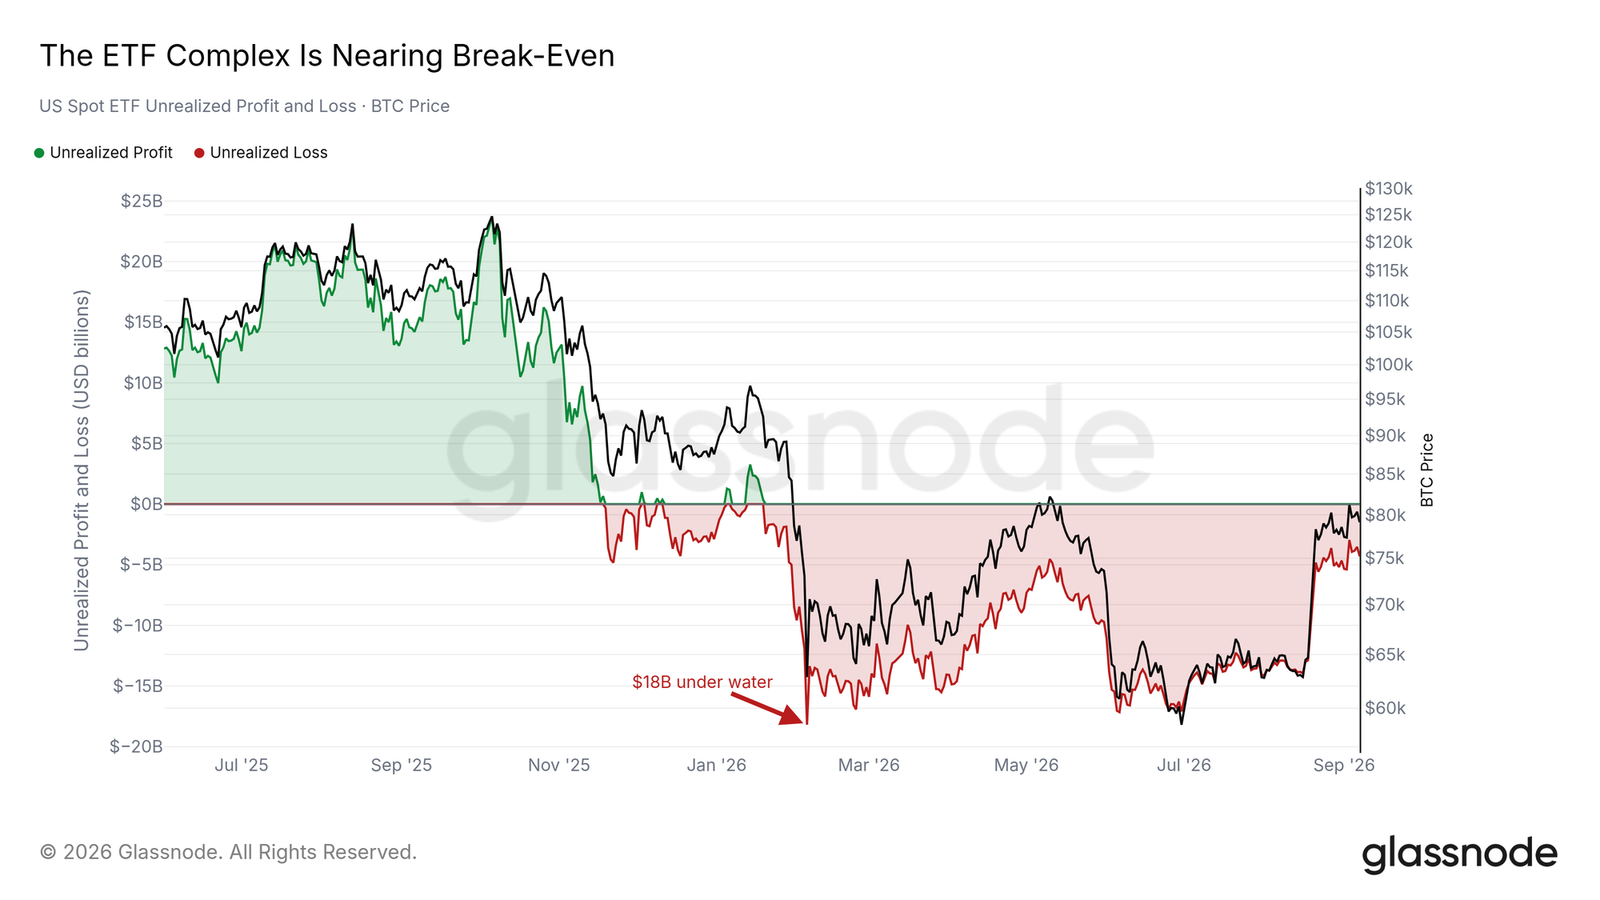
The third independent source also falls at the same level. The U.S. spot ETF portfolio, calculated based on coins created since inception, has a breakeven of about $86,000. It has spent 228 consecutive trading days below this level, with an unrealized loss reaching about $18 billion on February 5, 2026. This rebound has narrowed the loss to about $3.9 billion, marking the closest to breakeven since January.
The breakeven for corporate treasury is about $80,500, slightly below that of the spot market. In the five cost basis models we track, all five are above the current price, ranging from the real market average of $76,600 to the ETF breakeven of $86,000. The resistance above represents a cluster of real costs; if the price can reclaim $86,000, the largest institutional holders will return to profitability for the first time this year.
No Large Seller Presence
Reduced Selling Pressure on the Surge
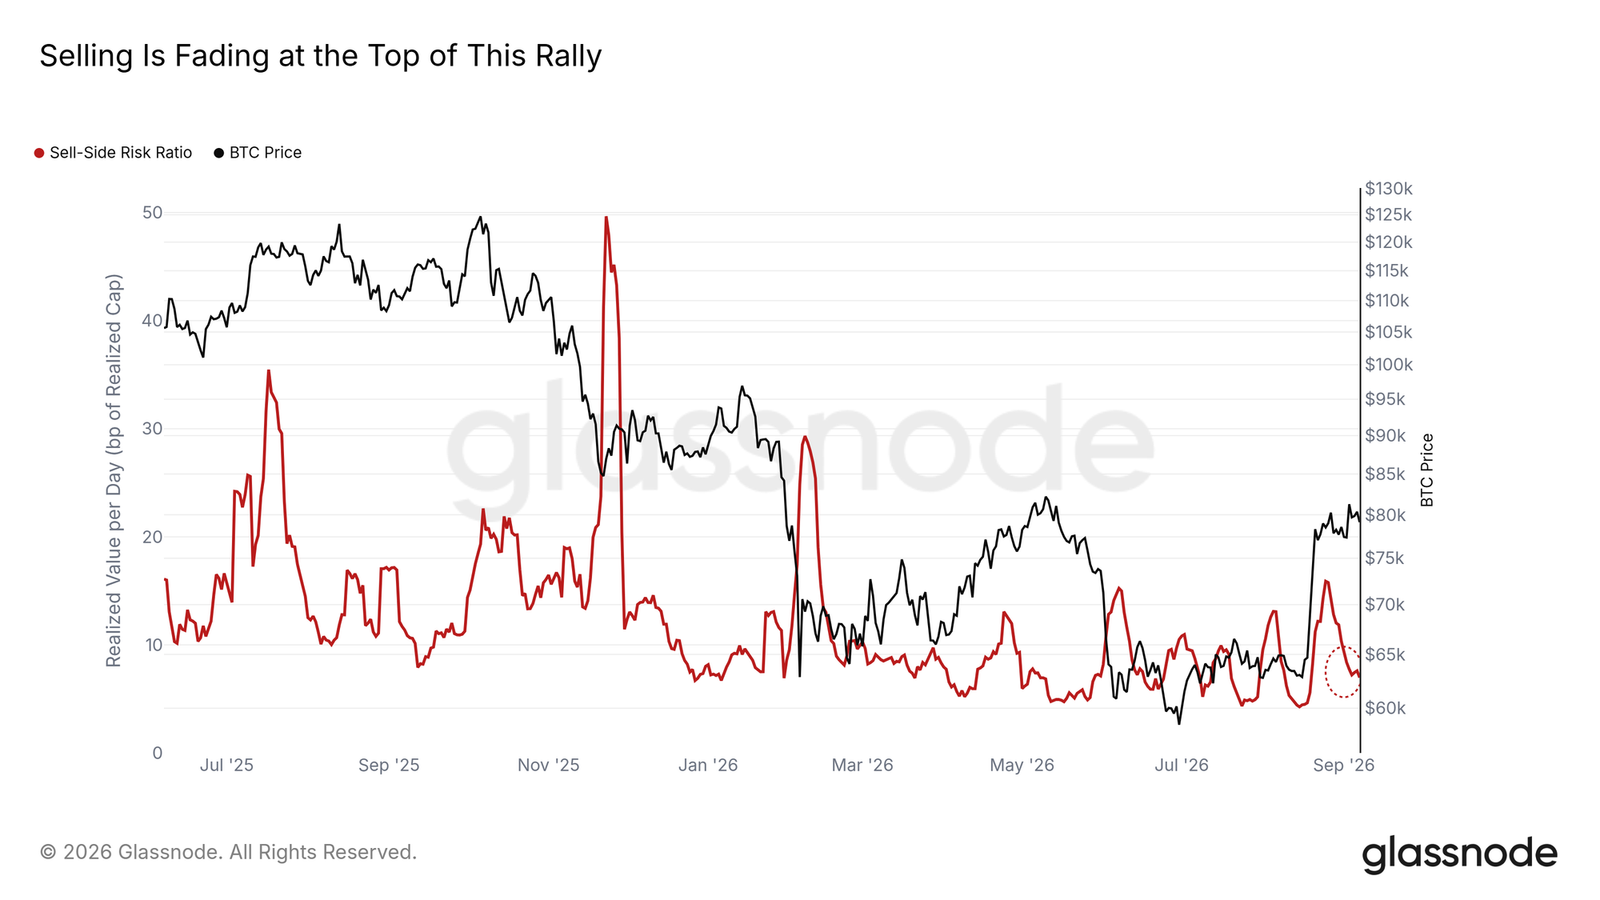
When heading toward the ceiling, not many coins were released. The seller risk ratio (the sum of realized profits and losses relative to realized market value) has dropped to a seven-day average of just 7 basis points, which is less than half of August's high of 16 basis points. The peak in July and October 2025 saw this same metric surge to 35 and 23 basis points, respectively. There haven't been many trading days in the past year lower than today's level.
The proportion of long-term holders among realized profits has dropped from 88% at August's peak to 47%; the realized profit spike on September 3 was less than half the size of August's. This month, the main sellers have been recent buyers, who are selling even less. If this metric continues to return above 16 basis points, it would indicate the return of sellers of the August variety; prior to that, the spot market lacks sellers at these price levels.
Between Bottom and Top
Bottom Signals Have Completed Their Task
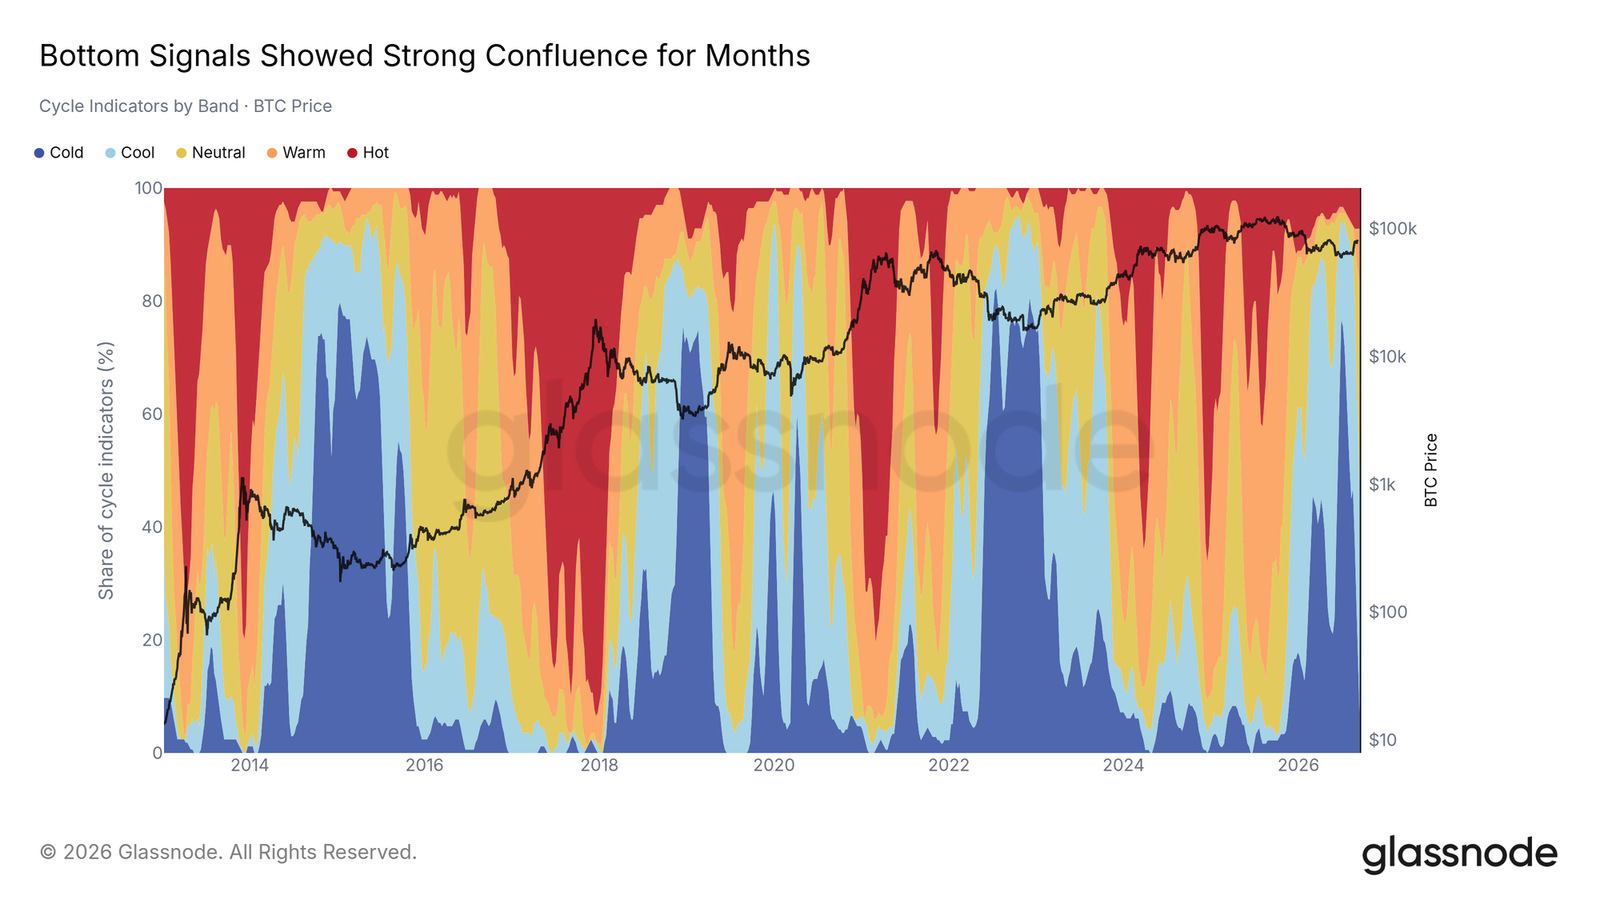
Among the 45 cyclical indicators on the market compass board, the proportion in the coldest range peaked at 82% in the week of June 29, 2026, and has remained above the long-term median for 41 consecutive weeks. This was the strongest resonance of bottom signals in this cycle. It has now faded: in the latest complete week, the proportion in the coldest range dropped to 2%, with valuations recovering with the rebound.
The indicators have not shifted to the other extreme. Three-quarters of the indicators remain below their historical median, and there has not been a week in 43 weeks where more than half of the indicators stood above 50. The readout state indicates that the market has left the value zone but has not become expensive. If the majority of indicators rise above 50, it will be the cleanest confirmation of a cyclical turn.
No Large Influx into Altcoins
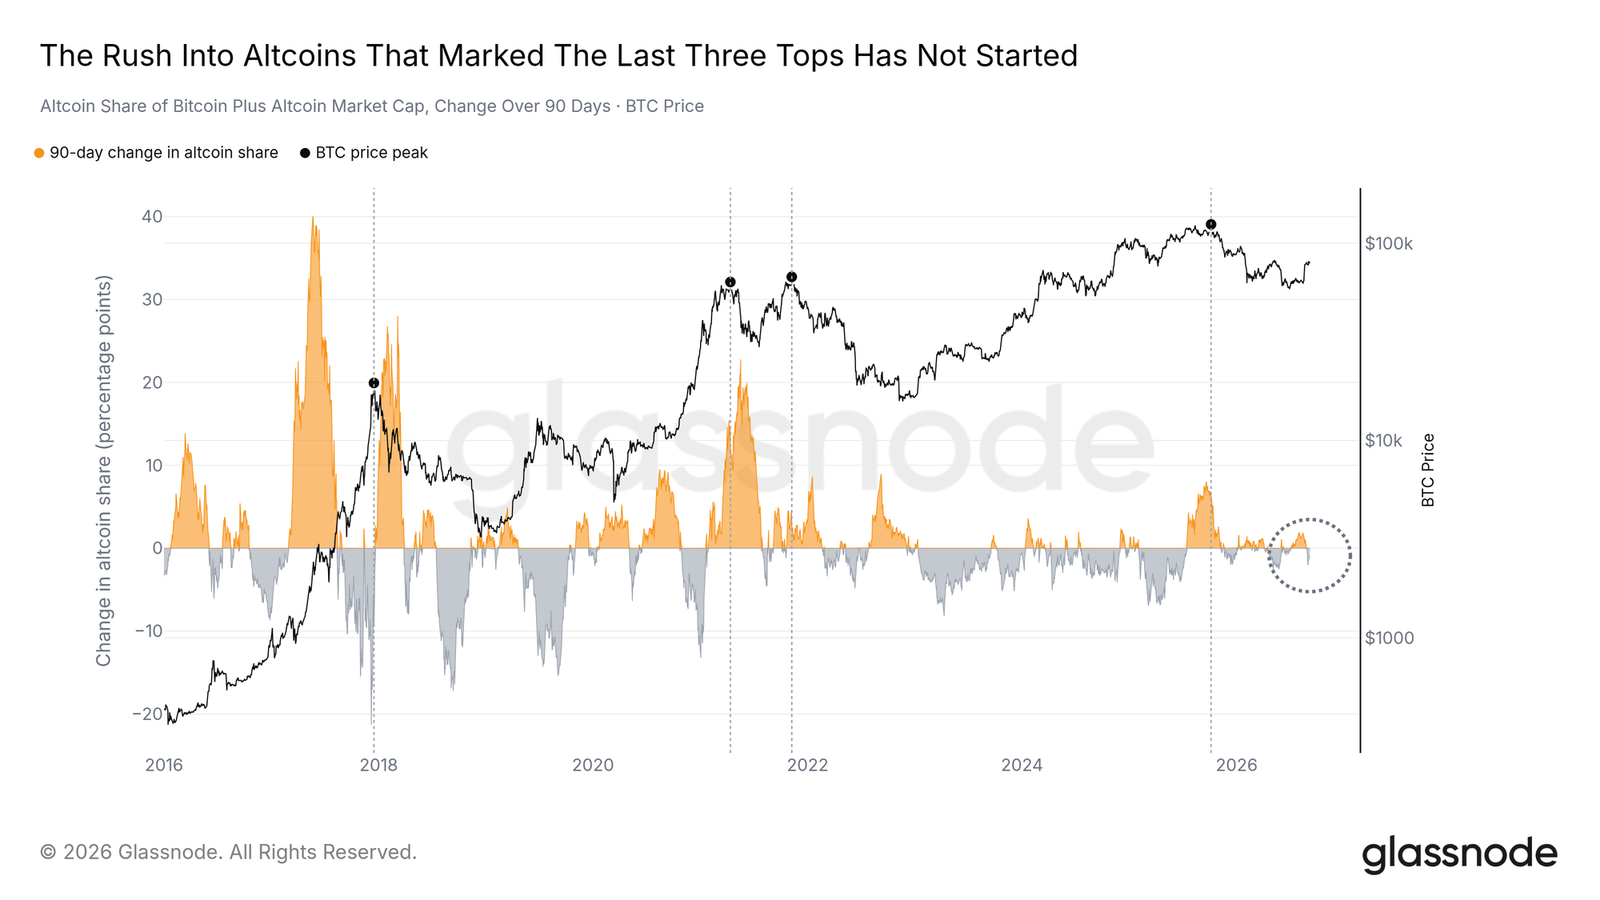
Many altcoins are moving, with the total market cap of altcoins rising 21% in a month. This metric truly tests whether this recent rally is excessive relative to the overall crypto market—whether altcoins are taking market share from Bitcoin as they have before at tops. Among the four peaks marked in Bitcoin's price, three saw altcoins' share of the combined market capitalization of Bitcoin and altcoins rise at least 2.8 percentage points within 90 days before topping; December 2017 was an exception. Today, the 90-day change in altcoin share is -0.9 percentage points.
Altcoins are appreciating in dollar terms, but not relative to Bitcoin; the rise is taking place collectively, led by the largest coins. The kind of rotation commonly seen at mature tops, where funds descend the risk curve faster than Bitcoin's market cap grows, has not yet begun. If the 90-day increase in altcoin share reaches or exceeds 2.8 percentage points while Bitcoin approaches historical highs, it would serve as a warning based on precedent; currently, neither condition is met.
Conclusion
Bitcoin is consolidating slightly below a ceiling. Three independent sources point to the same range: cost basis of long-term holders, liquidation heat map, and ETF breakeven, all between $83,000 and $86,000. The current pattern shows a floor that has been repaired, with the top yet to be truly tested. Unlike August, the sellers are absent: selling pressure is less than half of that in August, long-term holders are stepping back, and the upper layer of derivative fuel is thickening. If prices continue to close above $86,000 while the seller risk ratio remains low, it will confirm that the ceiling has been absorbed; if selling pressure returns above 16 basis points or the floor at $62,000 to $65,000 is lost, this judgment will be invalidated.
Note: On-chain indicators, prices, and derivatives data are as of September 7, 2026, ETF fund flows are as of September 4, 2026, and market compass data is as of the week ending September 7, 2026.
免责声明:本文章仅代表作者个人观点,不代表本平台的立场和观点。本文章仅供信息分享,不构成对任何人的任何投资建议。用户与作者之间的任何争议,与本平台无关。如网页中刊载的文章或图片涉及侵权,请提供相关的权利证明和身份证明发送邮件到support@aicoin.com,本平台相关工作人员将会进行核查。


