Bitcoin BTC Holds at $78,000, Yet the Market Has Not Really Strengthened
A rather interesting phenomenon has emerged in the recent cryptocurrency market.
Bitcoin has not continued to decline significantly, but other major coins have begun to bear greater selling pressure.
Currently, BTC is maintaining around $78,000, down about 1% in the last 24 hours.
Meanwhile, DOGE has fallen over 5%, making it one of the weakest performers among major crypto assets, while BNB, XRP, SOL, HYPE, and ETH have also dropped simultaneously.
On the surface, this appears to be a typical market adjustment.
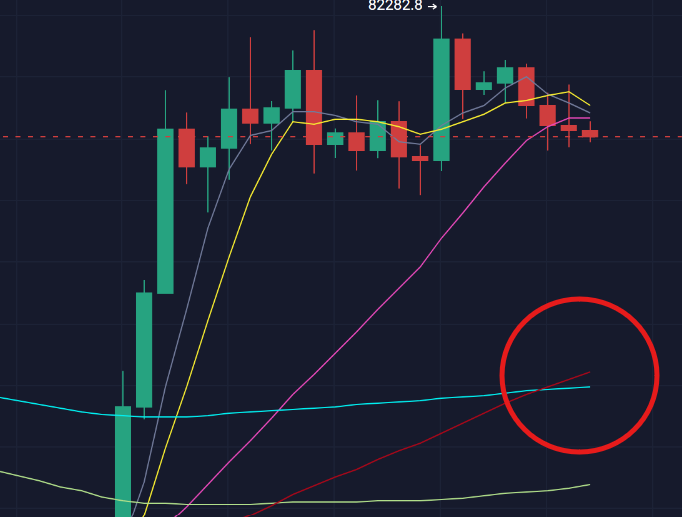
However, if we extend the time frame a bit, we can see that BTC has recently shown a noteworthy technical signal:
The 50-day moving average has crossed above the 200-day moving average.
This is what the market often refers to as a "golden cross."
For technical analysis traders, this is usually viewed as a signal of medium to long-term trend improvement.
But here comes the question:
Does the appearance of a golden cross mean that BTC has confirmed a reversal?
The answer is not that simple.
What is a Golden Cross?
A golden cross, simply put, is when a short-term moving average breaks above a long-term moving average.
This time, BTC has shown the 50-day moving average crossing above the 200-day moving average.
Why is the market paying attention to this signal?
Because the 200-day moving average is typically used to assess an asset's medium to long-term trend.
When the 50-day moving average crosses above the 200-day moving average, it means that recent price performance has started to exceed the average level of a longer time period.
Therefore, many technical analysts interpret it as:
The market's medium-term momentum is improving.
Historically, golden crosses have indeed appeared before some significant upwards cycles.
But its biggest problem is also quite obvious:
It is a lagging indicator.
Moving averages are calculated based on past prices.
So when a golden cross actually forms, the price has often already gone through a phase of increase.
This means that a golden cross is better suited to confirm a trend rather than predict it on its own.
📌 If you want to track BTC's key support and resistance levels daily, you can follow the public account "Bitcoin Spring" to continuously gather market hot topics and price logic.
Why Not Focus Solely on the Golden Cross This Time?
If there were only a single golden cross signal right now, the market might be simpler.
The problem is that the current macro environment is not cooperating.
Brent crude oil was once close to $102.
Meanwhile, the yield on the 10-year U.S. Treasury bond rose to around 4.85%.
Both of these figures indicate a single issue:
The market's inflation pressure still exists.
Rising oil prices will directly increase energy costs.
If high oil prices last for a prolonged period, they could also translate to other goods through transportation and production channels.
This will cause the market to worry about inflation again.
And inflation directly relates to the Federal Reserve's interest rate policy.
Thus, BTC is currently facing two opposing forces:
On one hand is the technical improvement.
On the other hand, the macro liquidity environment remains tight.
This is also why, after the golden cross appeared, BTC still has not quickly broken through the key resistance area.
Why Would Oil Prices Affect Bitcoin?
Many investors may feel:
"What is the connection between crude oil and Bitcoin?"
In fact, the link between the two is stronger than expected.
Bitcoin itself does not generate cash flow, so its market pricing is largely influenced by liquidity and risk appetite.
When oil prices rise and inflation expectations increase, the market may reassess expectations for the Federal Reserve to maintain high interest rates or even tighten policies further.
The higher the interest rates, the stronger the appeal of dollar-denominated assets may be.
At the same time, high interest rates also mean the liquidity environment in the financial markets is tighter.
For BTC, tech stocks, and other high-volatility risk assets, such an environment is often not friendly.
Therefore, the real transmission chain is actually:
Rising oil prices → Increasing inflation expectations → Changes in Federal Reserve policy expectations → Changes in U.S. Treasury yields and the dollar → Impact on the valuation of risk assets.
Bitcoin is merely one link in this chain.
CPI May Become the Next True Test
What the market really needs to focus on now is not the golden cross itself.
But rather, the upcoming U.S. CPI announcement.
The reason is simple.
Previously, U.S. employment data had clearly exceeded market expectations, prompting the market to start trading the risks of Federal Reserve rate hikes again.
If the upcoming CPI continues to run high, market concerns about Federal Reserve policy may further intensify.
At that point, even if BTC has formed a golden cross, it does not mean that the price will necessarily continue to rise.
Conversely, if the CPI comes in below expectations, and inflation pressures ease, the market may reduce concerns about interest rate hikes.
At that time, the golden cross will be more likely to gain support from the macro environment.
Thus, for BTC:
Technical indicators tell us the trend may be improving, while macro data determines whether this improvement has enough funding support.
📌 If you want to continue tracking key support and resistance levels for BTC daily, you can follow the public account "Bitcoin Spring" to keep getting market highlights and price logic.
Why is $78,000 Important for BTC?
From a short-term price structure perspective, around $78,000 is the zone that the market needs to pay attention to now.
If BTC can hold this level, it at least indicates that buy orders still exist after the previous decline.
However, holding support and confirming a reversal are two completely different concepts.
If BTC can stabilize around $78,000 and further break through the $79,000 to $80,000 zone, market sentiment may improve significantly.
Especially if it can maintain above $80,000 after breaking through, the significance of the golden cross will further enhance.
Conversely, if BTC drops below $78,000 again, the recent technical improvements may need to be reassessed.
Therefore, what is most important now is not to see the phrase "golden cross" and chase after it.
But rather to observe:
Can BTC convert the technical signal into a real price breakout?
Why Do Major Coins Like DOGE Decline More Significantly?
Another noteworthy phenomenon is that major coins have shown obvious differentiation.
DOGE has fallen more than 5%, while BNB, XRP, SOL, HYPE, and ETH have also dropped simultaneously.
This indicates that the current market's risk appetite has not clearly recovered.
If the market genuinely enters a strong upward phase, there is usually an observable transfer of more funds from BTC to ETH and other high-beta assets.
But the current situation is quite the opposite.
BTC remains relatively resistant to declines, while some major coins and highly volatile assets have dropped more sharply.
This indicates that funds are still being cautious.
Investors prefer to observe macro data and BTC's key positions rather than broadly increasing their risk exposure.
From this perspective, it seems more like:
The market is waiting for the next directional choice.
Technical Positivity and Macro Pressure, Which Will Prevail?
Putting all the current information together, the market is actually in a rather critical phase.
Technical Aspect:
BTC has shown a golden cross with the 50-day moving average crossing above the 200-day moving average.
Price Aspect:
BTC has temporarily held around $78,000.
Market Structure:
DOGE and other major coins are performing poorly; risk appetite remains limited.
Macro Aspect:
Brent crude oil is approaching $102, and the yield on 10-year U.S. bonds has risen to about 4.85%.
Policy Aspect:
The market is revisiting the risks of Federal Reserve rate hikes.
Next:
The U.S. CPI is about to be announced.
Thus, this is not a market that can simply be characterized as "bullish" or "bearish."
The real key is:
The technical aspect is improving, but the macro environment has not fully turned.
📌 If you want to keep tracking how BTC, ETH, and macro data affect the market, you can follow the public account "Bitcoin Spring," which explains important market changes and the logic behind them daily.
What Should Be Focused on Next?
For BTC, there are three key variables to focus on in the short term.
First, can it continue to hold above $78,000?
This is an important observation area for the current price structure.
Second, can it effectively break through the $79,000 to $80,000 range?
If BTC can stabilize above $80,000, the confirmation of the golden cross becomes easier.
The third and most important:
How will the U.S. CPI perform?
If inflation continues to run high, the rise in oil prices and the increase in Treasury yields may further strengthen the market's tightening expectations.
If the CPI shows a significant cooling, the market's concerns about interest rate hikes may ease, providing some support for risk assets.
Therefore, don't just focus on BTC's candlestick charts from here on out.
You also need to observe:
Oil prices, Treasury yields, the dollar index, and U.S. inflation data.
📌 Web3 Mr. X: The Golden Cross is a Signal, Not the Answer
This time the occurrence of a golden cross in BTC is indeed a technical signal worth paying attention to.
But for investors, it is more important to understand its limits.
A golden cross indicates that the price momentum over the past period is improving.
It does not guarantee that prices will rise in the future.
Especially under conditions where oil prices are near $102, Treasury yields are high, and the market is revisiting the risks of Federal Reserve rate hikes, BTC still has to face macro liquidity pressures.
So what is most worth paying attention to now is not:
"The golden cross has appeared, is BTC about to rise?"
But rather:
Can BTC hold at $78,000 and break through $80,000, and can the CPI provide the market with a relatively friendly answer?
If these conditions gradually resonate, then the technical improvements may truly translate into a trend.
Conversely, if inflation continues to heat up, yields keep rising, and BTC fails to break through $80,000, then the golden cross may just be a lagging technical signal.
📌 For ordinary investors, the most important thing now is not to predict the next candlestick, but to put together price, funding, and macro variables.
—— I am Web3 Mr. X, with 6 years of growth in Web3, focused on Bitcoin, the crypto market, macroeconomics, and industry trends. If you want to continue tracking the impact of BTC, ETH, HYPE, and macro data on the market, you can follow the public account "Bitcoin Spring." Understand the hot topics, gain insights into the logic, and build your own judgment, rather than just fixating on price fluctuations.

免责声明:本文章仅代表作者个人观点,不代表本平台的立场和观点。本文章仅供信息分享,不构成对任何人的任何投资建议。用户与作者之间的任何争议,与本平台无关。如网页中刊载的文章或图片涉及侵权,请提供相关的权利证明和身份证明发送邮件到support@aicoin.com,本平台相关工作人员将会进行核查。